
Ski Season 2026-27: When to Go, State by State
When the snow actually falls: typical season windows by region, the snowiest weeks from 30 years of NOAA normals, what NOAA’s winter outlook implies, when spring corn arrives, and where the crowds are. For the 37 states that have ski areas.
When should I go?
Pick a state and see its normal month-by-month snowfall from NOAA’s 1991 to 2020 climate normals, with this winter’s NOAA outlook, the season window and the crowd weeks laid on the same axis. Everything here is climatology and one seasonal probability shift. For today’s snow, check the resort.
When should I go?
Normal monthly snowfall at CLIMAX, 11,344 ft, about 24 miles from the nearest of the listed Colorado areas. NOAA NCEI 1991 to 2020 climate normals. This is the shape of a normal season near the ski terrain, not a reading on any mountain and not a forecast.
Late January through mid March, when the snowpack is deep and the storms are still cold. March is the snowiest month at many Colorado study sites, and the crowds thin midweek.
Wetter than normal with no temperature lean: more precipitation events, and whether they snow depends on each storm's cold supply. Ice and mixed events become more likely in the transition zones.
Earliest openings around October 20, last closings around June 1. These are regional patterns, not opening days; individual areas publish their own dates.
The I-70 corridor is the crowd story here, not the lift lines: westbound Friday afternoons and eastbound Sunday afternoons routinely add two hours to the drive. Skiing Tuesday to Thursday changes the trip more than choosing a different resort does.
Full picture for this state, including its ski areas and any measured snowpack nearby: Colorado ski season timing →
When each region opens, and why
The Rockies
High-elevation areas here open on natural snow as much as on snowmaking, so the calendar bends with the weather: a cold, wet October can put a state open two weeks early, and a warm one pushes almost everything to December.
The West Coast and Alaska
Pacific storms decide the calendar on this coast. Opening dates swing more here than anywhere else in the country, because one atmospheric river in November can do what a whole month of snowmaking does in the East.
The Southwest
Everything here depends on a few big storms rather than a steady drip. Southwestern areas have opened before Thanksgiving in a good year and sat closed into January in a bad one, which is why the season windows on this page carry the widest spread in the country.
The Northeast
Snowmaking, not snowfall, sets opening day across the Northeast. The trigger is a run of nights below about 28°F, which is why the season here starts on a cold snap rather than on a storm.
The Southern Appalachians
Every southern Appalachian area is a snowmaking operation first. Opening depends on getting several consecutive nights cold enough to blow snow, so the season starts later and ends earlier than the latitude alone suggests.
The Midwest
Midwest hills run almost entirely on snowmaking and open on the first sustained cold snap, usually well before the natural snowpack arrives. Seasons are short and the shoulder weeks are genuinely marginal.
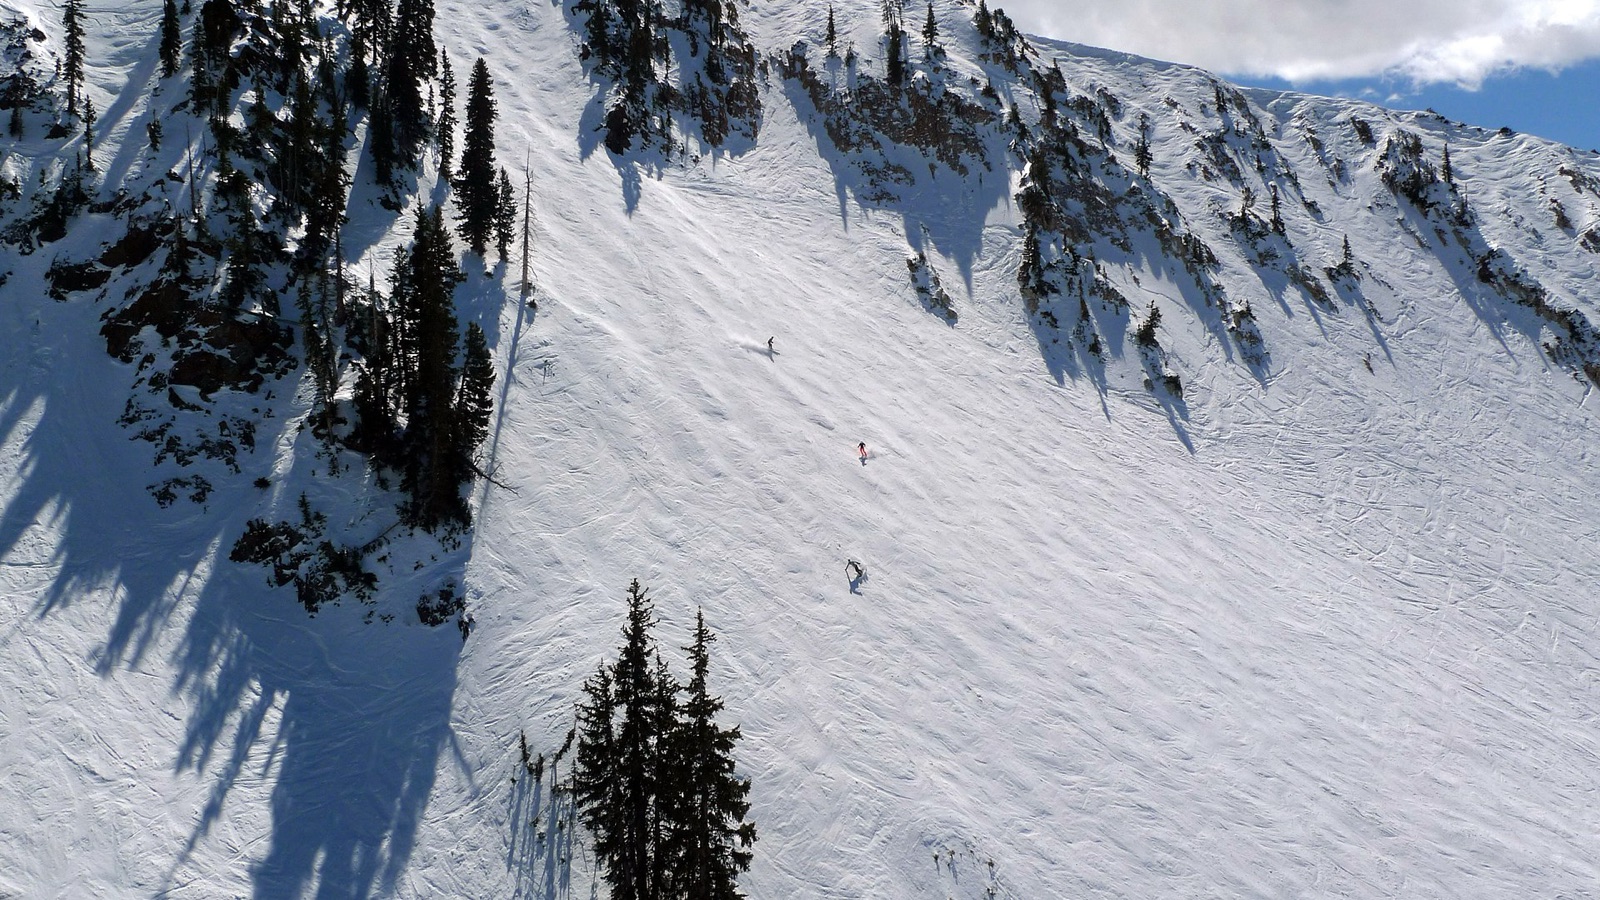
Ski season timing by state
Season windows are regional patterns with a spread of weeks, not opening or closing dates for any single area. Snowiest months and normal seasonal snowfall come from NOAA NCEI 1991 to 2020 climate normals at one reference station per state, named on that state’s page along with its elevation and its distance from the nearest listed ski area.
| State | Most areas running | Most areas closed | Snowiest | Areas | Biggest drop | Measured snowpack |
|---|---|---|---|---|---|---|
| Alabama | Jan 10 | Feb 20 | Mar | 1 | 109 ft | none |
| Alaska | Dec 10 | Apr 15 | Dec | 4 | 2,484 ft | 3 SNOTEL |
| Arizona | Dec 20 | Apr 5 | Jan | 3 | 2,357 ft | 2 SNOTEL |
| California | Dec 10 | Apr 15 | Feb | 23 | 2,962 ft | 3 SNOTEL |
| Colorado | Dec 5 | Apr 12 | Apr | 26 | 4,400 ft | 6 SNOTEL |
| Connecticut | Dec 22 | Mar 15 | Jan | 4 | 581 ft | none |
| Idaho | Dec 10 | Apr 5 | Jan | 15 | 3,362 ft | 6 SNOTEL |
| Illinois | Dec 20 | Mar 8 | Jan | 1 | 410 ft | none |
| Indiana | Dec 20 | Mar 8 | Jan | 2 | 374 ft | none |
| Iowa | Dec 22 | Mar 8 | Jan | 2 | 429 ft | none |
| Maine | Dec 15 | Apr 12 | Dec | 11 | 2,767 ft | none |
| Maryland | Dec 15 | Mar 15 | Jan | 1 | 635 ft | none |
| Massachusetts | Dec 20 | Mar 22 | Jan | 10 | 1,118 ft | none |
| Michigan | Dec 15 | Mar 25 | Jan | 30 | 627 ft | none |
| Minnesota | Dec 10 | Mar 22 | Dec | 16 | 774 ft | none |
| Missouri | Dec 26 | Mar 5 | Feb | 2 | 291 ft | none |
| Montana | Dec 12 | Apr 5 | Dec | 10 | 4,346 ft | 6 SNOTEL |
| Nevada | Dec 10 | Apr 12 | Feb | 5 | 3,320 ft | 4 SNOTEL |
| New Hampshire | Dec 15 | Apr 5 | Dec | 19 | 2,186 ft | none |
| New Jersey | Dec 20 | Mar 15 | Jan | 2 | 1,001 ft | none |
| New Mexico | Dec 15 | Apr 1 | Mar | 8 | 2,468 ft | 5 SNOTEL |
| New York | Dec 18 | Apr 5 | Jan | 35 | 3,154 ft | none |
| North Carolina | Dec 10 | Mar 20 | Dec | 5 | 1,171 ft | none |
| North Dakota | Dec 20 | Mar 10 | Dec | 4 | 340 ft | none |
| Ohio | Dec 18 | Mar 10 | Jan | 5 | 285 ft | none |
| Oregon | Dec 10 | Apr 20 | Dec | 8 | 4,498 ft | 4 SNOTEL |
| Pennsylvania | Dec 15 | Mar 20 | Jan | 21 | 1,077 ft | none |
| Rhode Island | Jan 2 | Mar 8 | Jan | 1 | 185 ft | none |
| South Dakota | Dec 10 | Apr 1 | Apr | 2 | 1,068 ft | none |
| Tennessee | Dec 20 | Mar 8 | Mar | 1 | 557 ft | none |
| Utah | Dec 5 | Apr 12 | Feb | 16 | 3,248 ft | 5 SNOTEL |
| Vermont | Dec 12 | Apr 5 | Feb | 21 | 2,976 ft | none |
| Virginia | Dec 20 | Mar 12 | Feb | 3 | 1,064 ft | none |
| Washington | Dec 15 | Apr 12 | Dec | 17 | 2,355 ft | 5 SNOTEL |
| West Virginia | Dec 15 | Mar 22 | Jan | 4 | 1,563 ft | none |
| Wisconsin | Dec 15 | Mar 15 | Jan | 20 | 660 ft | none |
| Wyoming | Dec 5 | Apr 5 | Dec | 7 | 4,070 ft | 5 SNOTEL |
The thirteen states with no ski areas
These states have no operating lift-served downhill ski area.
- Arkansas
- Delaware
- Florida
- Georgia
- Hawaii
- Kansas
- Kentucky
- Louisiana
- Mississippi
- Nebraska
- Oklahoma
- South Carolina
- Texas
The US ski season, month by month
October and November the race
A few high Colorado and Utah areas open on a single ribbon of manmade snow. It is skiing, but it is one run. Across the Northeast, Midwest and southern Appalachians, nothing opens until nights run consistently below about 28°F and the snowmaking can start.
December most areas running
Most of the country is open by mid December, and the Christmas to New Year window is the busiest and most expensive fortnight of the year with the least terrain open. If you can move the trip a week either side, do.
January and February deepest and coldest
The most reliable snow of the year almost everywhere, and the reason the answer to "when should I go" is usually mid January to early March. The exception is the crowd calendar: the mid-January holiday weekend and Presidents' week in February both land inside this window.
March and April the underrated half
The snowiest month of the year in Colorado, New Mexico and the Black Hills, and the start of spring corn nearly everywhere else. Lift lines thin, lodging drops, and the daylight is back. The trade-off is that closing dates are set by visitor numbers as much as by snow.
May and beyond holdouts only
A handful of high western areas run into May and, in one case in Colorado, June. Oregon is the only state with lift-served skiing in July and August, on the permanent snowfield above Timberline Lodge on Mount Hood.
What NOAA’s 2026-27 outlook implies for snow
El Niño conditions are present and strengthening. In its August 13, 2026 ENSO Diagnostic Discussion, CPC gave a greater than 90% chance of a very strong event during fall and winter 2026–27, and a 69% chance that the October–December season sets a record (+2.5°C or more, 3-month RONI) for any El Niño since 1950. CPC is explicit that impacts consistent with El Niño become more likely with an event this large, but are not guaranteed.
What that historically means for skiing, stated as tendencies rather than predictions:
- A stronger, southward-shifted Pacific jet stream: wetter than normal across the southern tier from California to the Southeast, especially in late winter (Jan–Mar).
- Milder than normal across the northern tier — Pacific Northwest, northern Rockies, northern Plains, Great Lakes, and Northeast — with below-normal snowfall often following from the warmth, not from a lack of storms.
- Drier than normal across the northern Rockies, northern High Plains, and parts of the Great Lakes and Ohio Valley; mainland Alaska trends drier and milder.
- Nor'easters and Gulf-coast storms are often more frequent in strong El Niño winters; whether they fall as snow or rain in the mid-Atlantic is the big unknown and depends on the cold supply week to week.
- Ice-storm risk climbs in the Southern Plains and Southeast when a wet southern storm track meets shallow cold air — exactly the setup strong El Niño favors.
Each state's tilt here is read straight off CPC's official Dec–Feb probability map, at the three reference cities listed on that state's page. CPC forecasts by region, not by state: its probability bands cross state lines, so where a state's three cities land in different bands the tilt shows as equal chances. Check any state against CPC's own map.
| State | Temperature tilt | Precipitation tilt | What it means for snow |
|---|---|---|---|
| Alabama | milder than normal | wetter than normal | More storms, marginal cold: expect an active winter where the rain/snow line decides everything. Elevation and the interior are the safer snow bets; valley and coastal totals often finish below normal in this combination. |
| Alaska | milder than normal | equal chances (no lean) | A milder tilt with no precipitation lean usually means snowfall slightly below normal — fewer days cold enough for snow, not necessarily fewer storms. |
| Arizona | equal chances (no lean) | wetter than normal | Wetter than normal with no temperature lean: more precipitation events, and whether they snow depends on each storm's cold supply. Ice and mixed events become more likely in the transition zones. |
| California | milder than normal | wetter than normal | More storms, marginal cold: expect an active winter where the rain/snow line decides everything. Elevation and the interior are the safer snow bets; valley and coastal totals often finish below normal in this combination. |
| Colorado | equal chances (no lean) | wetter than normal | Wetter than normal with no temperature lean: more precipitation events, and whether they snow depends on each storm's cold supply. Ice and mixed events become more likely in the transition zones. |
| Connecticut | milder than normal | wetter than normal | More storms, marginal cold: expect an active winter where the rain/snow line decides everything. Elevation and the interior are the safer snow bets; valley and coastal totals often finish below normal in this combination. |
| Idaho | milder than normal | equal chances (no lean) | A milder tilt with no precipitation lean usually means snowfall slightly below normal — fewer days cold enough for snow, not necessarily fewer storms. |
| Illinois | milder than normal | equal chances (no lean) | A milder tilt with no precipitation lean usually means snowfall slightly below normal — fewer days cold enough for snow, not necessarily fewer storms. |
| Indiana | milder than normal | equal chances (no lean) | A milder tilt with no precipitation lean usually means snowfall slightly below normal — fewer days cold enough for snow, not necessarily fewer storms. |
| Iowa | milder than normal | equal chances (no lean) | A milder tilt with no precipitation lean usually means snowfall slightly below normal — fewer days cold enough for snow, not necessarily fewer storms. |
| Maine | milder than normal | equal chances (no lean) | A milder tilt with no precipitation lean usually means snowfall slightly below normal — fewer days cold enough for snow, not necessarily fewer storms. |
| Maryland | milder than normal | wetter than normal | More storms, marginal cold: expect an active winter where the rain/snow line decides everything. Elevation and the interior are the safer snow bets; valley and coastal totals often finish below normal in this combination. |
| Massachusetts | milder than normal | wetter than normal | More storms, marginal cold: expect an active winter where the rain/snow line decides everything. Elevation and the interior are the safer snow bets; valley and coastal totals often finish below normal in this combination. |
| Michigan | milder than normal | drier than normal | Milder and drier is the least snowy combination CPC can give — seasonal snowfall in comparable winters has usually finished below normal, though a single cold storm can still produce a big week. |
| Minnesota | milder than normal | equal chances (no lean) | A milder tilt with no precipitation lean usually means snowfall slightly below normal — fewer days cold enough for snow, not necessarily fewer storms. |
| Missouri | milder than normal | equal chances (no lean) | A milder tilt with no precipitation lean usually means snowfall slightly below normal — fewer days cold enough for snow, not necessarily fewer storms. |
| Montana | milder than normal | drier than normal | Milder and drier is the least snowy combination CPC can give — seasonal snowfall in comparable winters has usually finished below normal, though a single cold storm can still produce a big week. |
| Nevada | milder than normal | wetter than normal | More storms, marginal cold: expect an active winter where the rain/snow line decides everything. Elevation and the interior are the safer snow bets; valley and coastal totals often finish below normal in this combination. |
| New Hampshire | milder than normal | wetter than normal | More storms, marginal cold: expect an active winter where the rain/snow line decides everything. Elevation and the interior are the safer snow bets; valley and coastal totals often finish below normal in this combination. |
| New Jersey | milder than normal | wetter than normal | More storms, marginal cold: expect an active winter where the rain/snow line decides everything. Elevation and the interior are the safer snow bets; valley and coastal totals often finish below normal in this combination. |
| New Mexico | equal chances (no lean) | wetter than normal | Wetter than normal with no temperature lean: more precipitation events, and whether they snow depends on each storm's cold supply. Ice and mixed events become more likely in the transition zones. |
| New York | milder than normal | wetter than normal | More storms, marginal cold: expect an active winter where the rain/snow line decides everything. Elevation and the interior are the safer snow bets; valley and coastal totals often finish below normal in this combination. |
| North Carolina | milder than normal | wetter than normal | More storms, marginal cold: expect an active winter where the rain/snow line decides everything. Elevation and the interior are the safer snow bets; valley and coastal totals often finish below normal in this combination. |
| North Dakota | milder than normal | equal chances (no lean) | A milder tilt with no precipitation lean usually means snowfall slightly below normal — fewer days cold enough for snow, not necessarily fewer storms. |
| Ohio | milder than normal | equal chances (no lean) | A milder tilt with no precipitation lean usually means snowfall slightly below normal — fewer days cold enough for snow, not necessarily fewer storms. |
| Oregon | milder than normal | equal chances (no lean) | A milder tilt with no precipitation lean usually means snowfall slightly below normal — fewer days cold enough for snow, not necessarily fewer storms. |
| Pennsylvania | milder than normal | equal chances (no lean) | A milder tilt with no precipitation lean usually means snowfall slightly below normal — fewer days cold enough for snow, not necessarily fewer storms. |
| Rhode Island | milder than normal | wetter than normal | More storms, marginal cold: expect an active winter where the rain/snow line decides everything. Elevation and the interior are the safer snow bets; valley and coastal totals often finish below normal in this combination. |
| South Dakota | milder than normal | equal chances (no lean) | A milder tilt with no precipitation lean usually means snowfall slightly below normal — fewer days cold enough for snow, not necessarily fewer storms. |
| Tennessee | milder than normal | equal chances (no lean) | A milder tilt with no precipitation lean usually means snowfall slightly below normal — fewer days cold enough for snow, not necessarily fewer storms. |
| Utah | equal chances (no lean) | equal chances (no lean) | Equal chances on both temperature and precipitation: CPC's map shows no usable signal for your area, so plan on a normal winter — the climatology on this page is the best available guide. |
| Vermont | milder than normal | wetter than normal | More storms, marginal cold: expect an active winter where the rain/snow line decides everything. Elevation and the interior are the safer snow bets; valley and coastal totals often finish below normal in this combination. |
| Virginia | milder than normal | wetter than normal | More storms, marginal cold: expect an active winter where the rain/snow line decides everything. Elevation and the interior are the safer snow bets; valley and coastal totals often finish below normal in this combination. |
| Washington | milder than normal | equal chances (no lean) | A milder tilt with no precipitation lean usually means snowfall slightly below normal — fewer days cold enough for snow, not necessarily fewer storms. |
| West Virginia | milder than normal | wetter than normal | More storms, marginal cold: expect an active winter where the rain/snow line decides everything. Elevation and the interior are the safer snow bets; valley and coastal totals often finish below normal in this combination. |
| Wisconsin | milder than normal | equal chances (no lean) | A milder tilt with no precipitation lean usually means snowfall slightly below normal — fewer days cold enough for snow, not necessarily fewer storms. |
| Wyoming | milder than normal | equal chances (no lean) | A milder tilt with no precipitation lean usually means snowfall slightly below normal — fewer days cold enough for snow, not necessarily fewer storms. |
Tilts are a point read of NOAA CPC’s official Dec to Feb probability map issued August 20, 2026, taken at each state’s three reference cities. Next CPC update September 17, 2026. See CPC’s own map.
Where you can see real snowpack numbers
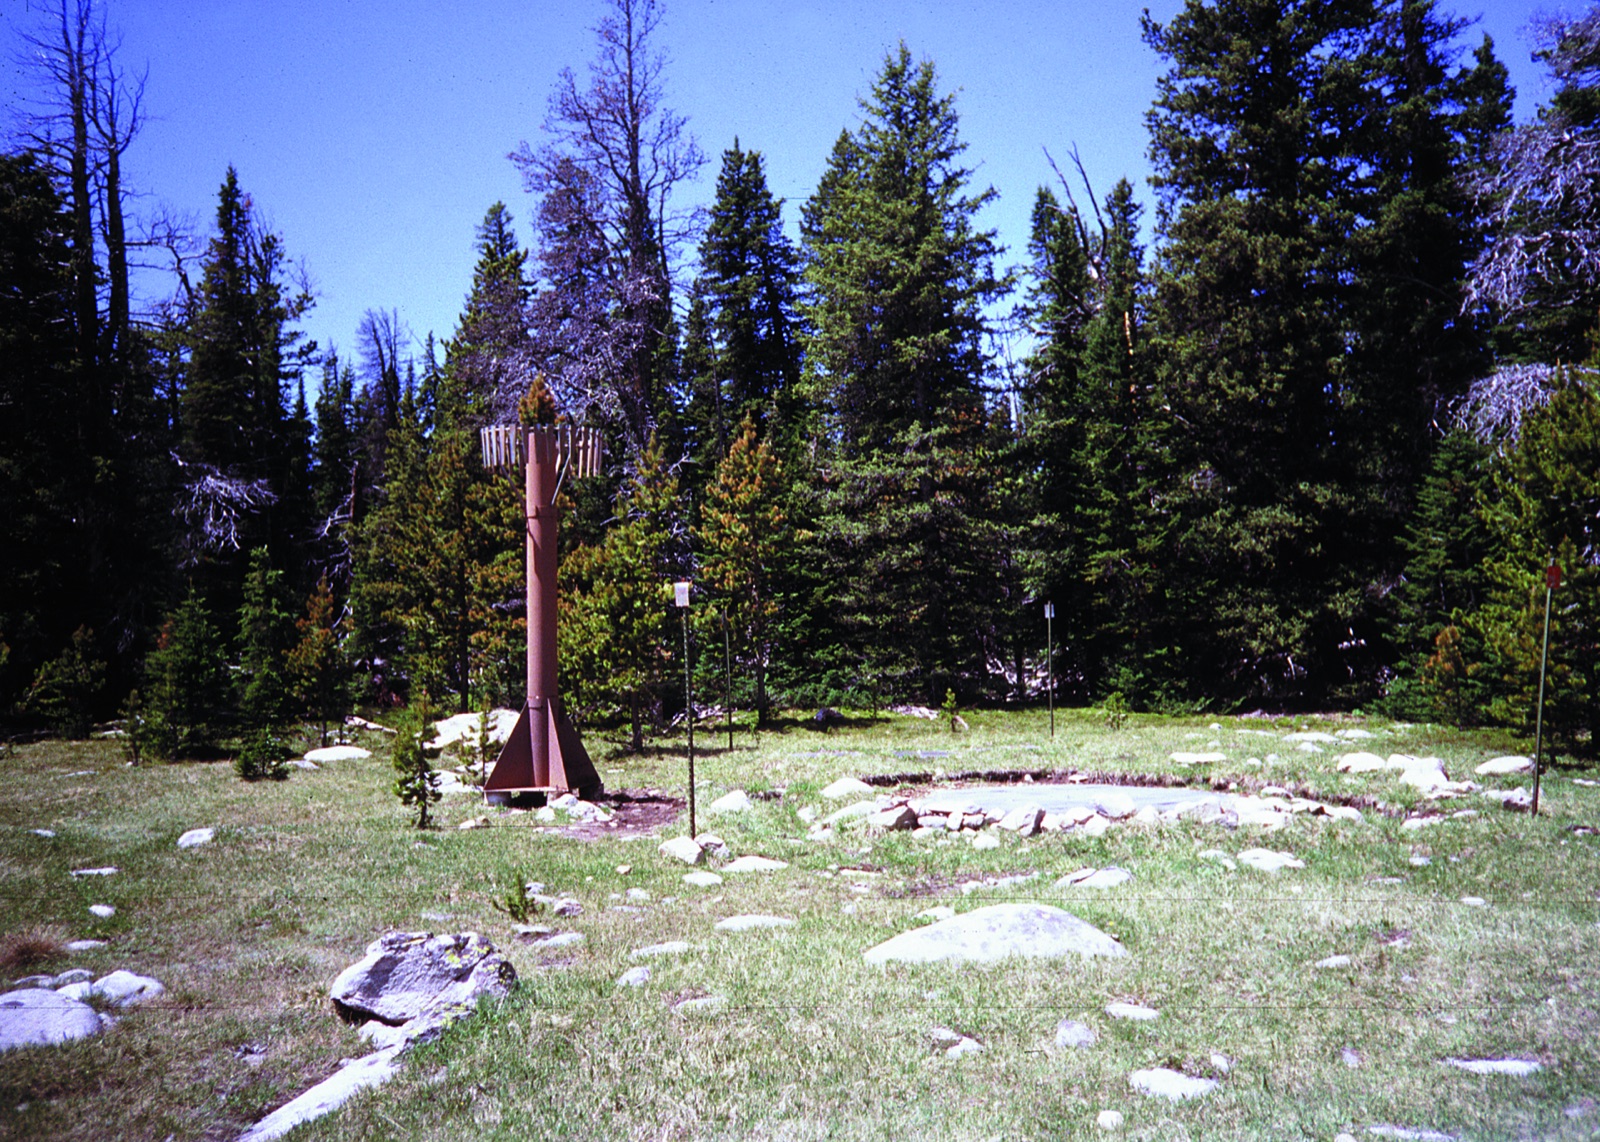
Almost everything published about snow is a model. SNOTEL is not. USDA NRCS runs roughly 900 automated sites, each with a sonic ranger measuring the depth of snow on the ground and a fluid-filled pillow weighing the water inside it. Those are physical measurements, they are free, and they are keyless, which is why the state pages for the West read them live and put them next to the forecast.
Where it reaches. SNOTEL exists in the 11 western states and Alaska. 12 of the 37 ski states on this site get a measured panel; the other 25 carry climatology and NOAA forecast snowfall. The Northeast and Midwest, which have no stations, together accounted for roughly 18.7 million of about 52.6 million US skier visits in a recent season, so for most of that skiing the 30 year normals and the forecast are the numbers to plan on.
The four weeks everyone else is also skiing
Snow is only half the question. The other half is a school calendar, and it is the same one nationwide, which makes it the most predictable variable in the whole trip.
Ski season timing FAQ
Season windows are regional patterns compiled by MyWild, not opening or closing dates for any individual ski area; any single year runs weeks either side, and areas publish their own dates. Monthly snowfall and temperature are NOAA NCEI 1991-2020 Climate Normals (US Government, public domain). Ski area names, elevations, vertical, run and lift counts come from OpenSkiMap, derived from OpenStreetMap and used under the Open Database License (ODbL 1.0); data © OpenStreetMap contributors. Measured snowpack is USDA NRCS SNOTEL (US Government, public domain), read live in your browser. The winter tilt is NOAA CPC’s official Dec to Feb probability map. The full winter outlook →
Hero image: “View of Crystal Mountain ski resort (below) and Norse Peak massif (above) from Silver Queen (7 March 2025)” by Buidhe, CC BY-SA 4.0