
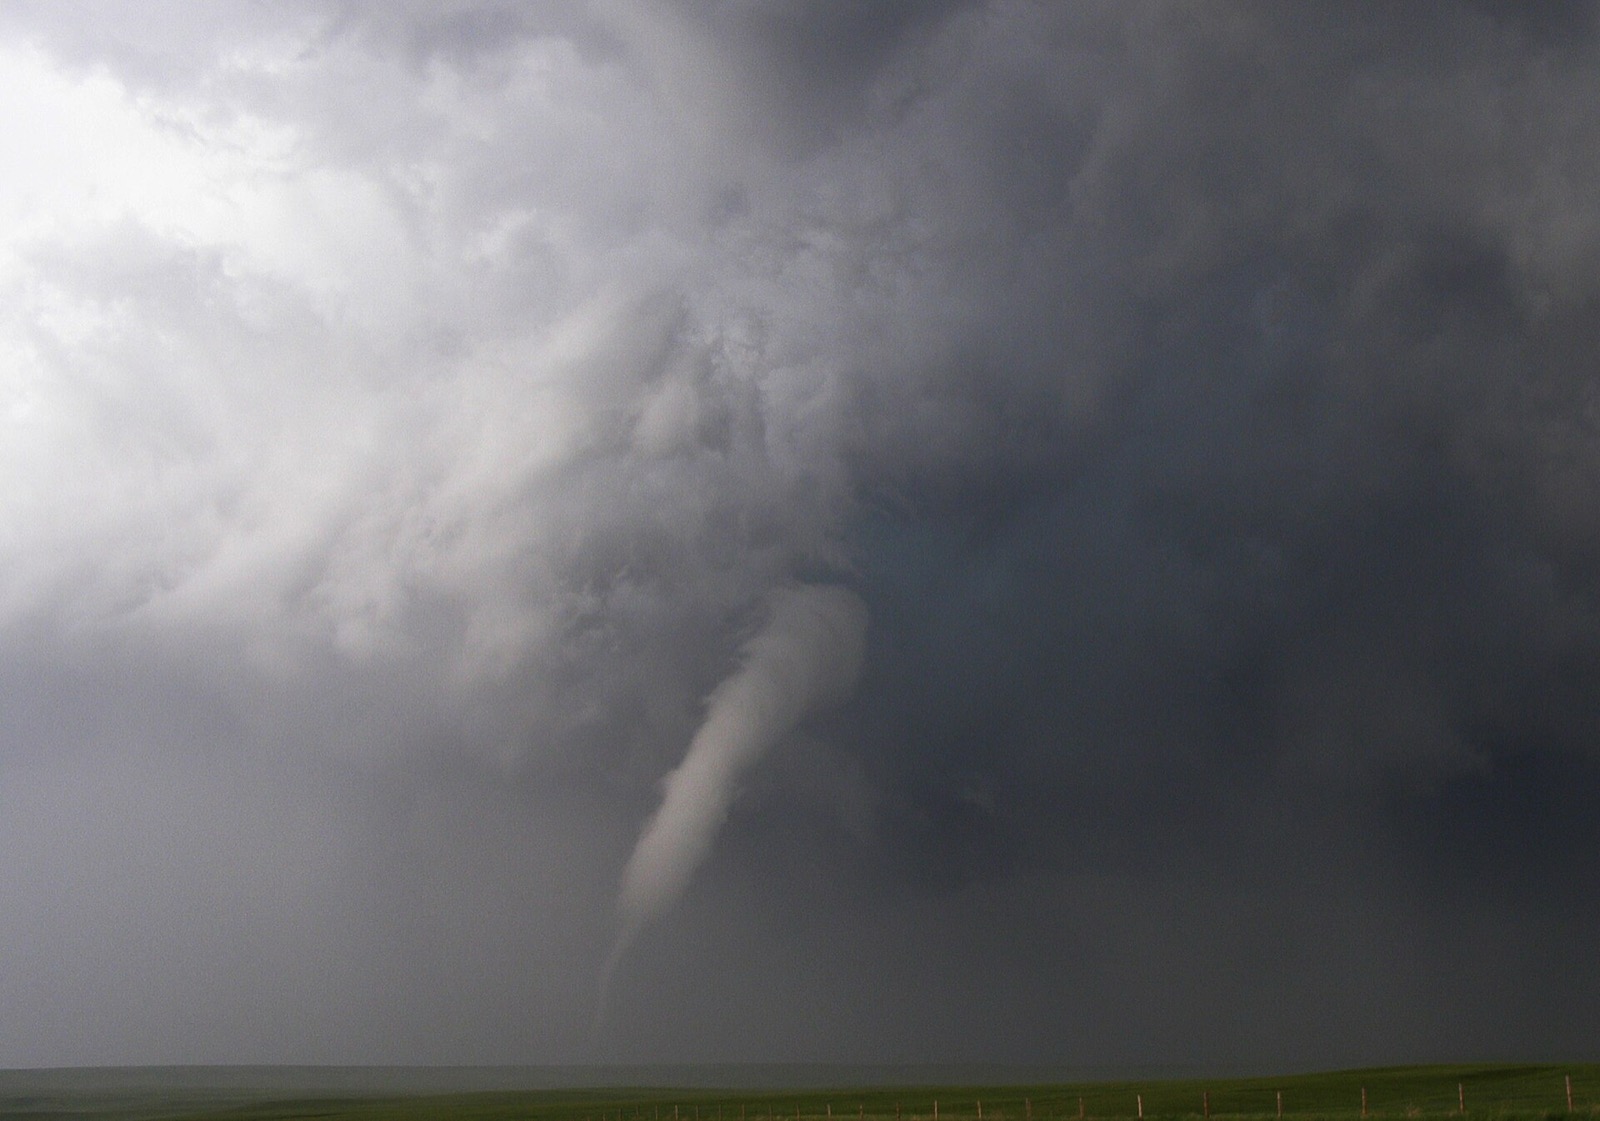
Tornado Season: When and Where Tornadoes Strike
Tornadoes a year, season windows, night shares, county by county history and the strongest on record, for all 50 states. Thirty years of the NOAA Storm Prediction Center database, counted properly, plus live National Weather Service warnings read the moment you open the page.
Thirty years of the NOAA Storm Prediction Center database, plus live National Weather Service warningsTornado history for your county, by ZIP code
A state average hides almost everything that matters about tornado geography: Washington County, Colorado has recorded more tornadoes than Connecticut and Massachusetts combined. Enter a ZIP and get the 30 year record for every county it touches, from the same Storm Prediction Center database as the state pages.
Active tornado warnings and watches
Read live from api.weather.gov when this page loads and shown exactly as issued: Tornado Warnings with the office's own tag saying whether the tornado was observed or radar indicated, Tornado Watches from the Storm Prediction Center, and the Severe Thunderstorm Warnings on which an office chose to write a tornado possible tag.
Checking api.weather.gov for active tornado products.
Products are shown exactly as issued, with the office's own tornadoDetection tag saying whether the tornado was observed or radar indicated. A missing tag is shown as missing. Source: api.weather.gov
How many tornadoes each state gets, and when
Sorted by tornado days a year: the number of days with at least one tornado in the state, which reads through the outbreak clustering that makes raw counts jumpy. Every figure covers 1996 to 2025 and counts each tornado once per state it touched. Read the biggest numbers knowing that a state total counts a tornado anywhere inside a big state, and that weak, brief tornadoes dominate every raw count.
National Weather Service, Tornado Safety“A tornado is a violently rotating column of air extending from the base of a thunderstorm down to the ground. Tornadoes are capable of completely destroying well-made structures, uprooting trees, and hurling objects through the air like deadly missiles. Tornadoes can occur at any time of day or night and at any time of the year. Although tornadoes are most common in the Central Plains and the southeastern United States, they have been reported in all 50 states.”
| State | Tornadoes a year | Tornado days a year | EF2+ a year | Season, middle 80 percent | Strongest since 1996 | Page shape |
|---|---|---|---|---|---|---|
| Texas | 130 | 38 | 12 | Mar 19 to Oct 15 | F5 | Frequent |
| Florida | 55 | 28 | 3.1 | Feb 25 to Oct 20 | EF3 | Frequent |
| Kansas | 81 | 20 | 6.5 | Apr 16 to Aug 31 | EF5 | Frequent |
| Colorado | 44 | 18 | 1.6 | May 8 to Aug 20 | EF3 | Seasonal |
| Illinois | 65 | 17 | 7 | Mar 30 to Sep 9 | EF4 | Frequent |
| Nebraska | 51 | 16 | 4.6 | Apr 28 to Aug 20 | F4 | Frequent |
| Oklahoma | 71 | 16 | 7.9 | Mar 30 to Oct 9 | EF5 | Frequent |
| Louisiana | 46 | 16 | 5.6 | Feb 12 to Nov 27 | F4 | Frequent |
| Missouri | 50 | 15 | 6.6 | Mar 15 to Oct 10 | EF5 | Frequent |
| Mississippi | 60 | 15 | 9.6 | Feb 5 to Nov 29 | EF5 | Frequent |
| Alabama | 60 | 15 | 9.4 | Feb 9 to Nov 29 | EF5 | Frequent |
| Iowa | 56 | 14 | 5.8 | Apr 18 to Aug 31 | EF5 | Frequent |
| Minnesota | 45 | 14 | 3.9 | May 18 to Aug 31 | F4 | Frequent |
| Arkansas | 42 | 12 | 8.6 | Mar 1 to Nov 3 | EF4 | Frequent |
| Georgia | 37 | 12 | 5.4 | Feb 7 to Nov 20 | EF4 | Frequent |
| North Carolina | 31 | 11 | 3.5 | Mar 16 to Oct 8 | F4 | Frequent |
| North Dakota | 31 | 11 | 2.4 | May 29 to Aug 20 | EF5 | Frequent |
| Indiana | 29 | 9.8 | 4.6 | Mar 25 to Sep 22 | EF4 | Seasonal |
| South Dakota | 27 | 9.8 | 2.6 | May 15 to Aug 23 | F4 | Seasonal |
| Ohio | 25 | 9.3 | 2.9 | Apr 2 to Sep 20 | F4 | Seasonal |
| Kentucky | 29 | 9.1 | 5.7 | Feb 22 to Oct 19 | EF4 | Seasonal |
| Wisconsin | 26 | 9 | 2.1 | May 9 to Aug 28 | F5 | Seasonal |
| Tennessee | 31 | 8.7 | 7 | Feb 11 to Oct 24 | F5 | Seasonal |
| South Carolina | 25 | 8.3 | 2.9 | Feb 28 to Oct 8 | EF4 | Seasonal |
| Pennsylvania | 18 | 7.7 | 2 | Apr 28 to Sep 22 | F4 | Seasonal |
| Virginia | 18 | 7.1 | 1.7 | Mar 9 to Sep 27 | F4 | Seasonal |
| Michigan | 14 | 6.7 | 1.2 | Apr 26 to Sep 24 | EF3 | Seasonal |
| California | 8.8 | 6.4 | 0.1 | Jan 21 to Nov 26 | EF2 | Seasonal |
| Wyoming | 10 | 6.2 | 0.8 | May 18 to Aug 22 | EF3 | Seasonal |
| New Mexico | 9.3 | 5.9 | 0.3 | May 6 to Sep 29 | EF2 | Seasonal |
| New York | 9.4 | 5.1 | 1.1 | May 15 to Sep 25 | F3 | Seasonal |
| Maryland | 8.5 | 4.5 | 0.6 | Apr 20 to Sep 29 | F4 | Seasonal |
| Montana | 6.4 | 4.3 | 0.5 | May 23 to Aug 11 | EF3 | Seasonal |
| Arizona | 4.8 | 3.7 | 0.2 | May 9 to Oct 18 | EF3 | Seasonal |
| Idaho | 3.4 | 2.6 | 0.1 | no stable season | F2 | Occasional |
| Oregon | 2.9 | 2.5 | 0.1 | no stable season | EF2 | Occasional |
| Washington | 2.7 | 2.2 | 0 | no stable season | EF2 | Occasional |
| West Virginia | 3.1 | 1.9 | 0.4 | no stable season | EF3 | Occasional |
| Utah | 2.1 | 1.8 | 0.2 | no stable season | F2 | Occasional |
| New Jersey | 2.5 | 1.7 | 0.3 | no stable season | EF3 | Occasional |
| Connecticut | 2.1 | 1.4 | 0 | no stable season | F2 | Occasional |
| Maine | 1.8 | 1.4 | 0.1 | no stable season | F2 | Occasional |
| Nevada | 1.6 | 1.4 | 0 | no stable season | EF1 | Occasional |
| Massachusetts | 2.2 | 1.3 | 0.2 | no stable season | EF3 | Occasional |
| New Hampshire | 0.9 | 0.8 | 0.2 | no stable season | EF2 | Occasional |
| Delaware | 0.8 | 0.6 | 0.1 | no stable season | EF3 | Rare |
| Hawaii | 0.5 | 0.5 | 0 | no stable season | F0 | Rare |
| Vermont | 0.6 | 0.5 | 0.1 | no stable season | F3 | Rare |
| Rhode Island | 0.4 | 0.3 | 0 | no stable season | EF2 | Rare |
| Alaska | 0.1 | 0.1 | 0 | no stable season | EF0 | Rare |
Frequent
states with 10 or more tornado days a year AND 2 or more EF2+ tornadoes a year. Tornadoes are a season here, so those pages lead with frequency and strength.
Seasonal
states above 3 tornado days a year. Tornadoes come every year with a season that has real shape, so those pages lead with the window and the peak month.
Occasional
states under 3 tornado days a year with tornadoes in at least 15 of the 30 years. Those pages lead with how seldom tornadoes come and what the strongest on record was.
Rare
states (Alaska, Delaware, Hawaii, Rhode Island, Vermont) with tornadoes in fewer than 15 of the 30 years. No season exists to describe, so those pages show the entire record instead.
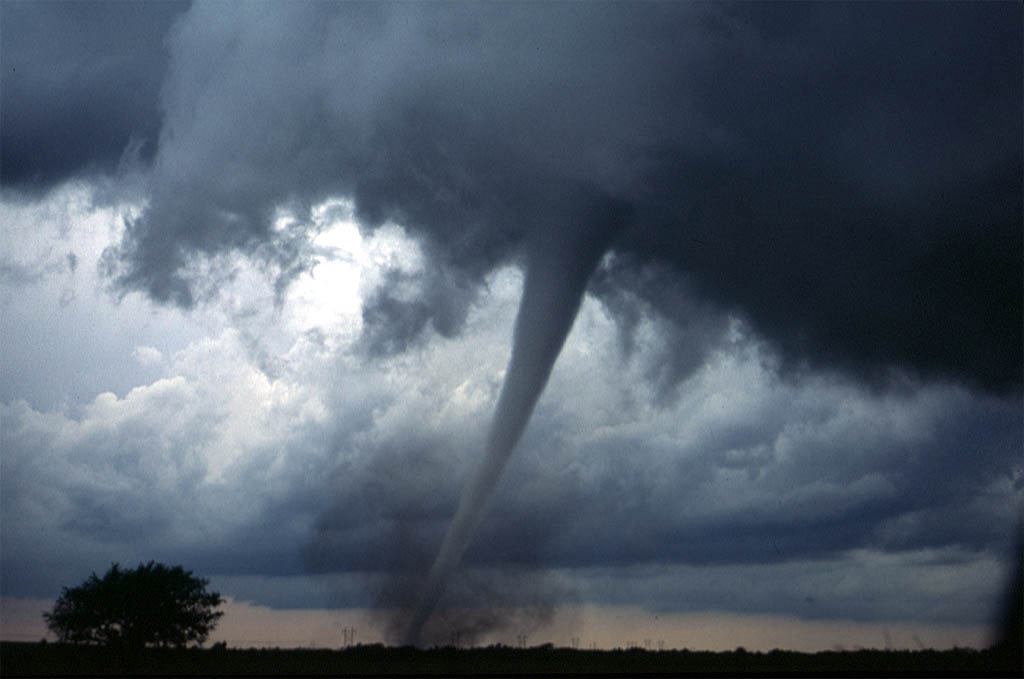
Tornado season marches north across the year
There is no national tornado season, there is a wave with a twist at the end. The Gulf coast windows open in February. The southern Plains peak in May. The northern Plains and upper Midwest peak in June and July. Then, as the popular image of tornado season packs up for the year, the Southeast opens a second act: November and December tornadoes riding cold season squall lines, which is where some of the deadliest recent outbreaks have lived.
NOAA Storm Prediction Center, The Online Tornado FAQ“There is a general northward shift in "tornado season" in the U. S. from late winter through mid summer. The peak period for tornadoes in the southern Plains, for example, is during May into early June. On the Gulf Coast, it is earlier during the spring; in the northern Plains and upper Midwest, it is June or July.”
| Busiest month | States (frequent and seasonal shapes) | How many |
|---|---|---|
| February | California | 1 |
| April | Alabama, Arkansas, Georgia, Mississippi | 4 |
| May | Illinois, Indiana, Kansas, Kentucky, Louisiana, Missouri, New Mexico, North Carolina, Ohio, Oklahoma, South Carolina, Tennessee, Texas, Virginia | 14 |
| June | Colorado, Florida, Iowa, Michigan, Montana, Nebraska, North Dakota, Pennsylvania, South Dakota, Wisconsin, Wyoming | 11 |
| July | Arizona, Maryland, Minnesota, New York | 4 |
Tornado Alley is a nickname, and the science has moved
Ask where tornadoes happen and most people will draw the same shape: a corridor from Texas up through Kansas. The agency that actually forecasts tornadoes is careful to say that shape is not a place with a boundary. In SPC's own words:
NOAA Storm Prediction Center, The Online Tornado FAQ“Tornado Alley is a nickname in the popular media for a broad swath of relatively high tornado occurrence in the central U. S. Various Tornado Alley maps which you may see can look different because tornado occurrence can be measured many ways--by all tornadoes, tornado county-segments, strong and violent tornadoes only, and databases with different time periods.”
NOAA Storm Prediction Center, The Online Tornado FAQ“Remember, this is only a map of greatest incidence. Violent or killer tornadoes do happen outside this Tornado Alley every year. Tornadoes can occur almost anywhere in the U. S., including west of the Rockies and east of the Appalachians, and even in Canada and overseas.”
Peer reviewed research co-authored at the NOAA National Severe Storms Laboratory (Gensini and Brooks, 2018, in npj Climate and Atmospheric Science) found that while national tornado numbers have stayed roughly level, tornado frequency has trended downward across parts of the central and southern Great Plains and upward across parts of the Midwest and Southeast since 1979. The classic map people carry in their heads points at the Plains; the trend lines point east of it.
Our summary of information published by NOAA National Severe Storms Laboratory research record
That is why no page on this site sorts a state into or out of an alley. The counts are the counts. What the counts do show is that the states with the most violent tornadoes and the most tornado deaths in this 30 year window are not all where the drawn corridor says: Alabama recorded 400 deaths, Missouri 268 and Tennessee 221, against Kansas's 39, and the night tornado share runs three times higher in the Gulf South than on the Plains.
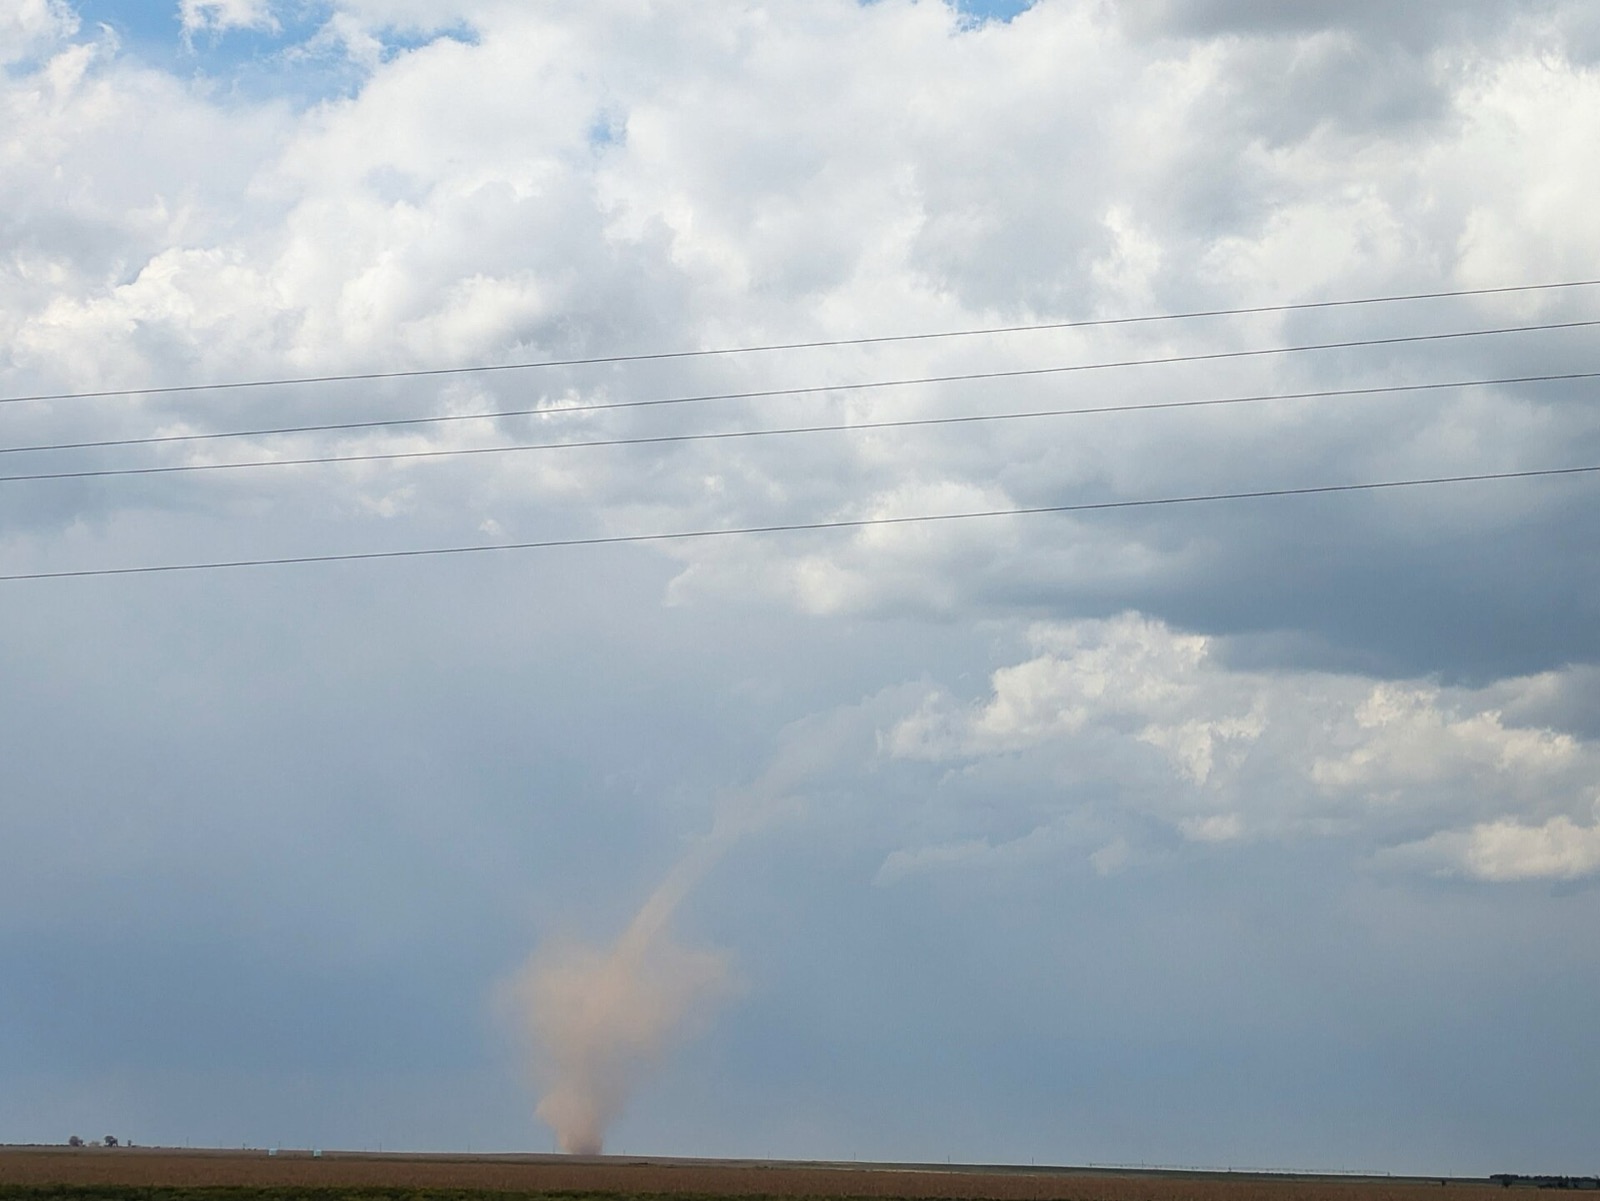
Counting tornadoes is harder than it looks
Segments. The SPC database stores each tornado track as segments: a tornado that crosses a county or state line appears as several rows. Counting rows double counts precisely the long track tornadoes people remember. The 2021 Western Kentucky tornado is one tornado and four rows. This site counts each tornado once nationally and once per state it touched, and the rule is verified against SPC's own de-segmented tornado file every time the snapshot rebuilds: 73,458 tornadoes since 1950, matching to the row, every year.
The Doppler break. Everything here runs on 1996 to 2025 because the record before the NEXRAD radar network is not comparable with the record after it:
NOAA Storm Prediction Center, The Online Tornado FAQ“Tornado reports have increased, especially around the installation of the NEXRAD Doppler radar system in the mid 1990s. This doesn't mean that actual tornado occurrence has gone up, however.”
NOAA Storm Prediction Center, The Online Tornado FAQ“The increase in tornado numbers is almost entirely in weak (EF0-EF1) events that are being reported far more often today due to a combination of better detection, greater media coverage, aggressive warning verification efforts, storm spotting, storm chasing, more developmental sprawl (damage targets), more people, and better documentation with cameras (including cell phones) than ever.”
The record itself is also older than the hail and wind records, and thinner at its start, which SPC flags in its own words:
NOAA Storm Prediction Center, Severe Weather Maps, Graphics, and Data Page“Tornado reports exist back to 1950 while hail and damaging wind events date from 1955.”
NOAA Storm Prediction Center, Severe Weather Maps, Graphics, and Data Page“Please note! Tornadoes were likely underreported prior to 1953. Many tornado statistics are derived from 1953 (or later) to the present.”
Outbreaks, not more stormy days. Inside the modern window the year to year swings are large, from 916 tornadoes in 2013 to 1,817 in 2004, while the number of DAYS with a tornado barely moves. Big years are years of bigger outbreaks. That is why the state pages lead with tornado days.
Two more notes from the same file. Ratings are damage survey verdicts, and a growing share of modern tornadoes, roughly 250 a year, get no rating at all because they touched nothing surveyable; they are counted in every total here and excluded from every intensity figure. And the database is a record of VERIFIED tornadoes: SPC itself says the data may not reflect all storm events, and empty country verifies fewer tornadoes than settled country with the same weather. Nothing on this site corrects for any of that, because a correction would be a model dressed as data.
Our summary of information published by NOAA SPC Severe Weather Database
The EF scale, in the agency's words
National Weather Service Norman OK, The Enhanced Fujita Scale“The Enhanced Fujita Scale or EF Scale, which became operational on February 1, 2007, is used to assign a tornado a 'rating' based on estimated wind speeds and related damage.”
| Rating | Estimated 3 second gust | SPC term |
|---|---|---|
| EF0 | 65-85 mph | Weak |
| EF1 | 86-110 mph | Weak |
| EF2 | 111-135 mph | Significant |
| EF3 | 136-165 mph | Significant |
| EF4 | 166-200 mph | Violent |
| EF5 | Over 200 mph | Violent |
NOAA Storm Prediction Center, The Online Tornado FAQ“Tornadoes can last from several seconds to more than an hour. The longest-lived tornado in history is really unknown, because so many of the long-lived tornadoes reported from the early-mid 1900s and before are believed to be tornado series instead. Most tornadoes last less than 10 minutes.”
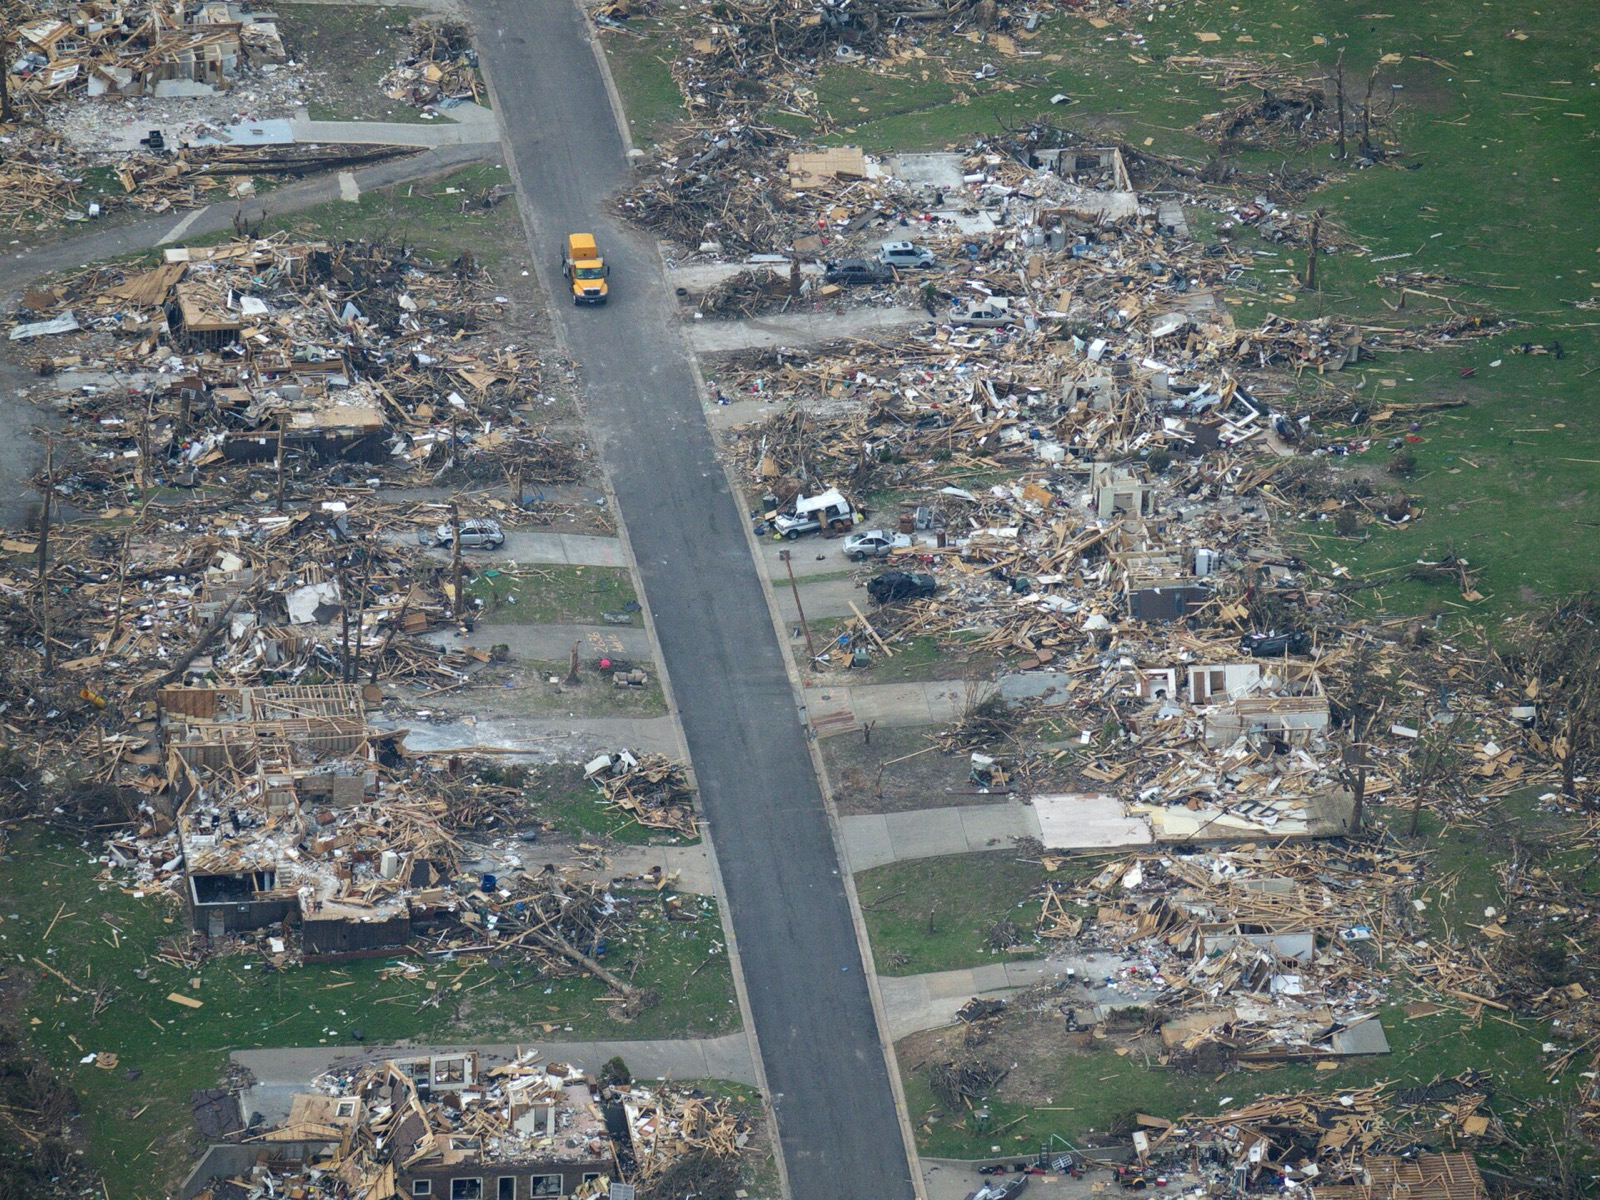
NOAA Storm Prediction Center, The Online Tornado FAQ“The deadliest of the modern era (since 1950) was on 22 May 2011, when a large EF5 tornado crossed Joplin, MO, causing 158 direct fatalities.”
Tornado season FAQ
Tornado season, state by state
The same storm year, other hazards
Counts are ours, from the NOAA Storm Prediction Center Severe Weather Database, 1996 to 2025, tornadoes counted once per state and once per county they touched. Definitions, ratings and safety text are quoted verbatim from the National Weather Service and the Storm Prediction Center. Live products come from api.weather.gov and are shown as issued. For what is going to happen, see the SPC Convective Outlooks and NWS Tornado Safety.