
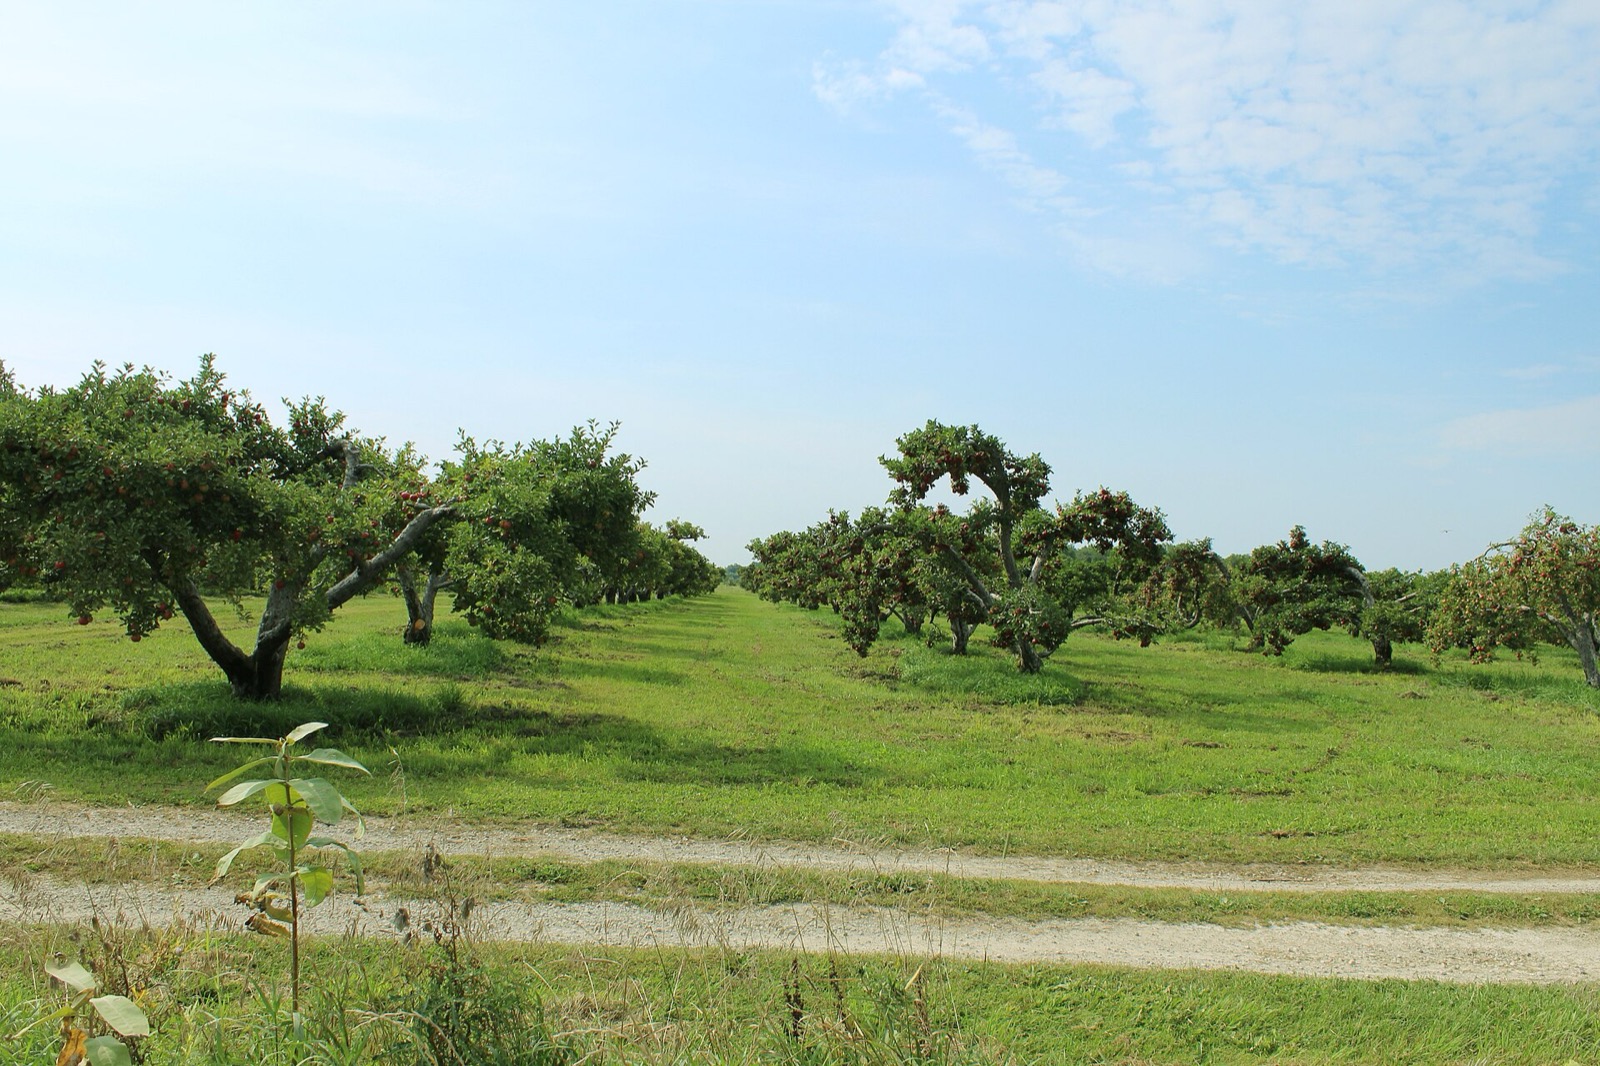
Pick Your Own: When Each Crop Is Typically Ready
Six crops, fifty states. Strawberries, blueberries, peaches, apples, pumpkins and Christmas trees, with the typical picking window in every state placed against that state's frost date and the USDA census acreage that says the crop is grown there. Whether a farm is picking on a given day is the farm's own to publish.
A harvest window is a typical range that moves by weeks with the spring. Whether a farm is picking today is on the farm’s own page or phone line.The picking year sweeps north, then stops caring
Four of these six crops move with the spring. A strawberry field in Florida is picked in December and one in Maine at the end of June, and the six months between them are the same wave of warmth moving up the country. Blueberries follow the strawberries, peaches follow the blueberries, apples carry the autumn.
The other two do not move at all. A pumpkin patch is a Halloween business and it closes on October 31 in Georgia and in Maine alike. Cut your own Christmas trees open the Friday after Thanksgiving everywhere in the country, because a tree that took nine years to grow does not care what this particular spring did. Those two are the only dates on this site that are the same everywhere, and they are the two most people actually plan around.
What is grown, where, and how much of it
Which crops a state page carries is not a judgement call. It comes from the USDA 2022 Census of Agriculture: a crop earns a row when the census counted at least 10 farms growing it and either at least 10 acres or a withheld acreage cell. Both halves matter. Acres alone would let one large commercial block stand in for an industry a visitor could reach; farms alone would let a few dozen households with a raised bed each stand in for a season.
Strawberries
42 states
70,603 acres over 7,596 farms nationally in the 2022 census.
Moves with springBlueberries
39 states
98,146 acres over 14,490 farms nationally in the 2022 census.
Moves with springPeaches
43 states
95,518 acres over 9,868 farms nationally in the 2022 census.
Moves with springApples
50 states
361,466 acres over 20,530 farms nationally in the 2022 census.
Moves with springPumpkins
49 states
72,638 acres over 15,636 farms nationally in the 2022 census.
Calendar setChristmas trees
45 states
291,455 acres over 10,121 farms nationally in the 2022 census.
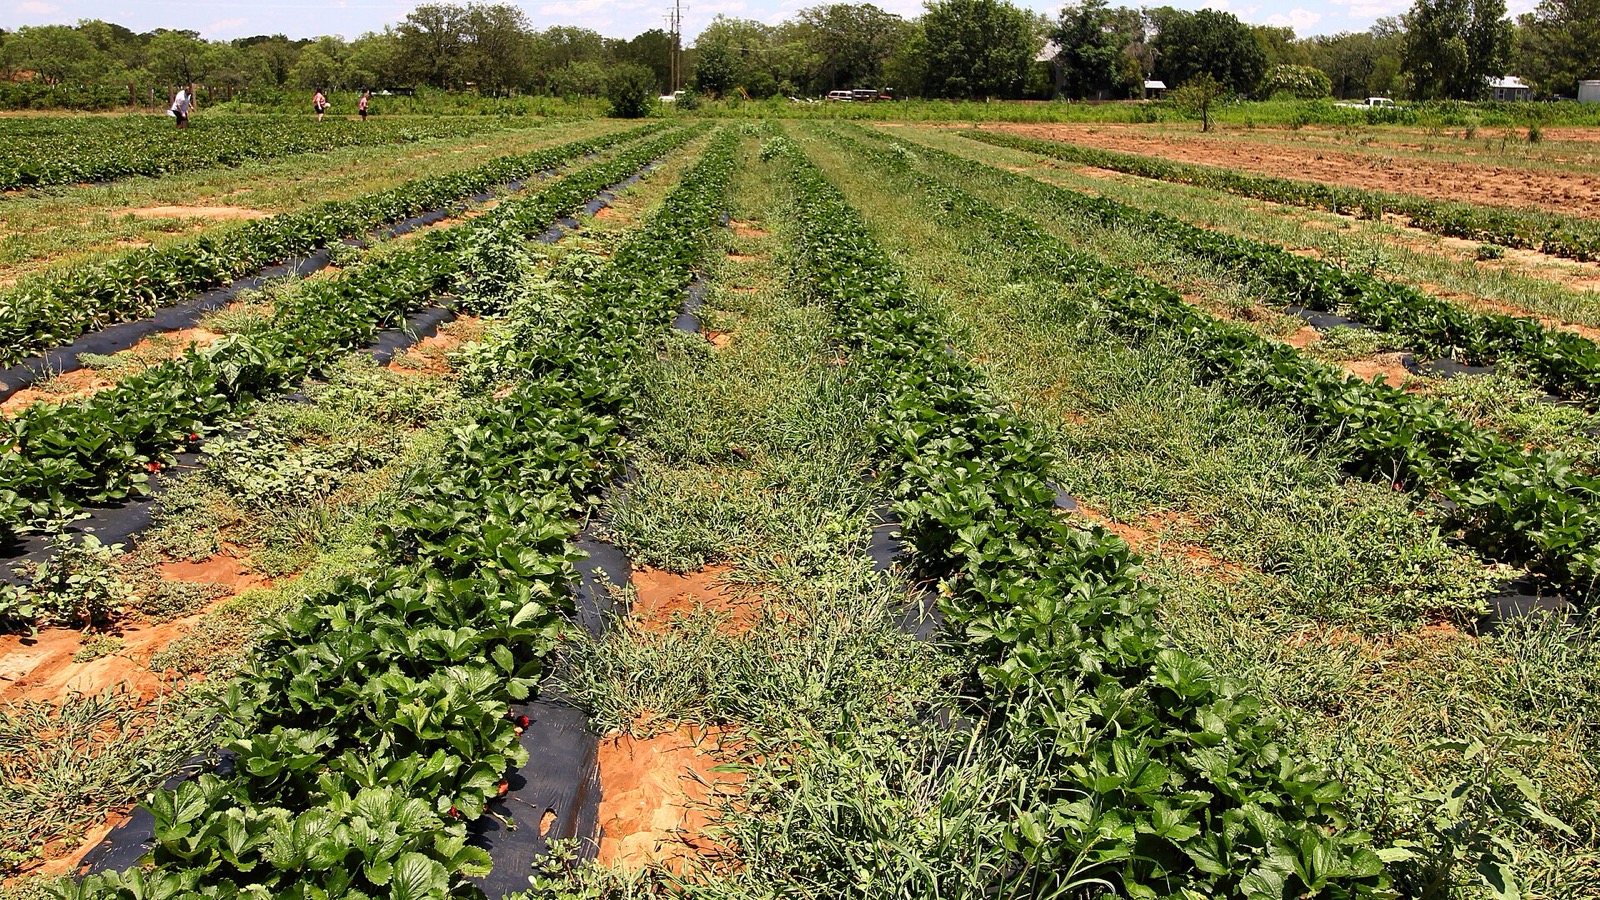
Calendar setStrawberries. The first pick of the year almost everywhere, and the shortest. A strawberry field gives three to five weeks and then it is done, which is why a strawberry weekend gets planned and an apple weekend gets improvised. Strawberries fruit on the spring that just happened, so the window tracks how fast the ground warmed. A cold April pushes it back a fortnight and a warm one pulls it forward.
Blueberries. The longest picking window of the six. A planting of early, mid and late highbush varieties can hold a farm open for two months, so blueberries forgive a missed weekend in a way strawberries never do. Cultivated highbush blueberries ripen over weeks rather than days, and growers plant varieties that deliberately stagger. The window is wide because the crop is wide.
Peaches. The crop most likely to simply not happen. Peaches bloom early, and a hard freeze on an open blossom takes the whole year rather than delaying it. In a bad spring a state can lose most of its crop in one night. Peach bloom comes weeks before the last frost risk passes, so the window below describes a normal year. It cannot describe a year with a February warm spell followed by a March freeze, and those years happen.
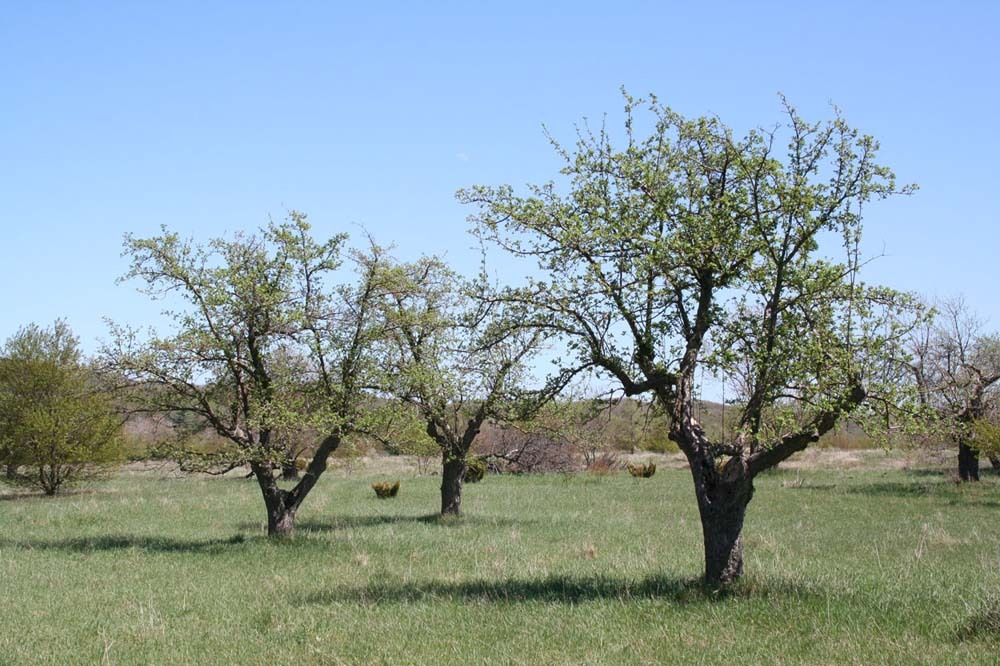
Apples. The one crop with bearing acres in all fifty states, and the longest u-pick season of the tree fruits. Early varieties start in high summer and late ones hang until the first real freeze. Apple harvest runs by variety rather than by date. The window below spans the early varieties through the late ones, so a farm inside it may still be picking only two or three of the dozen kinds it grows.
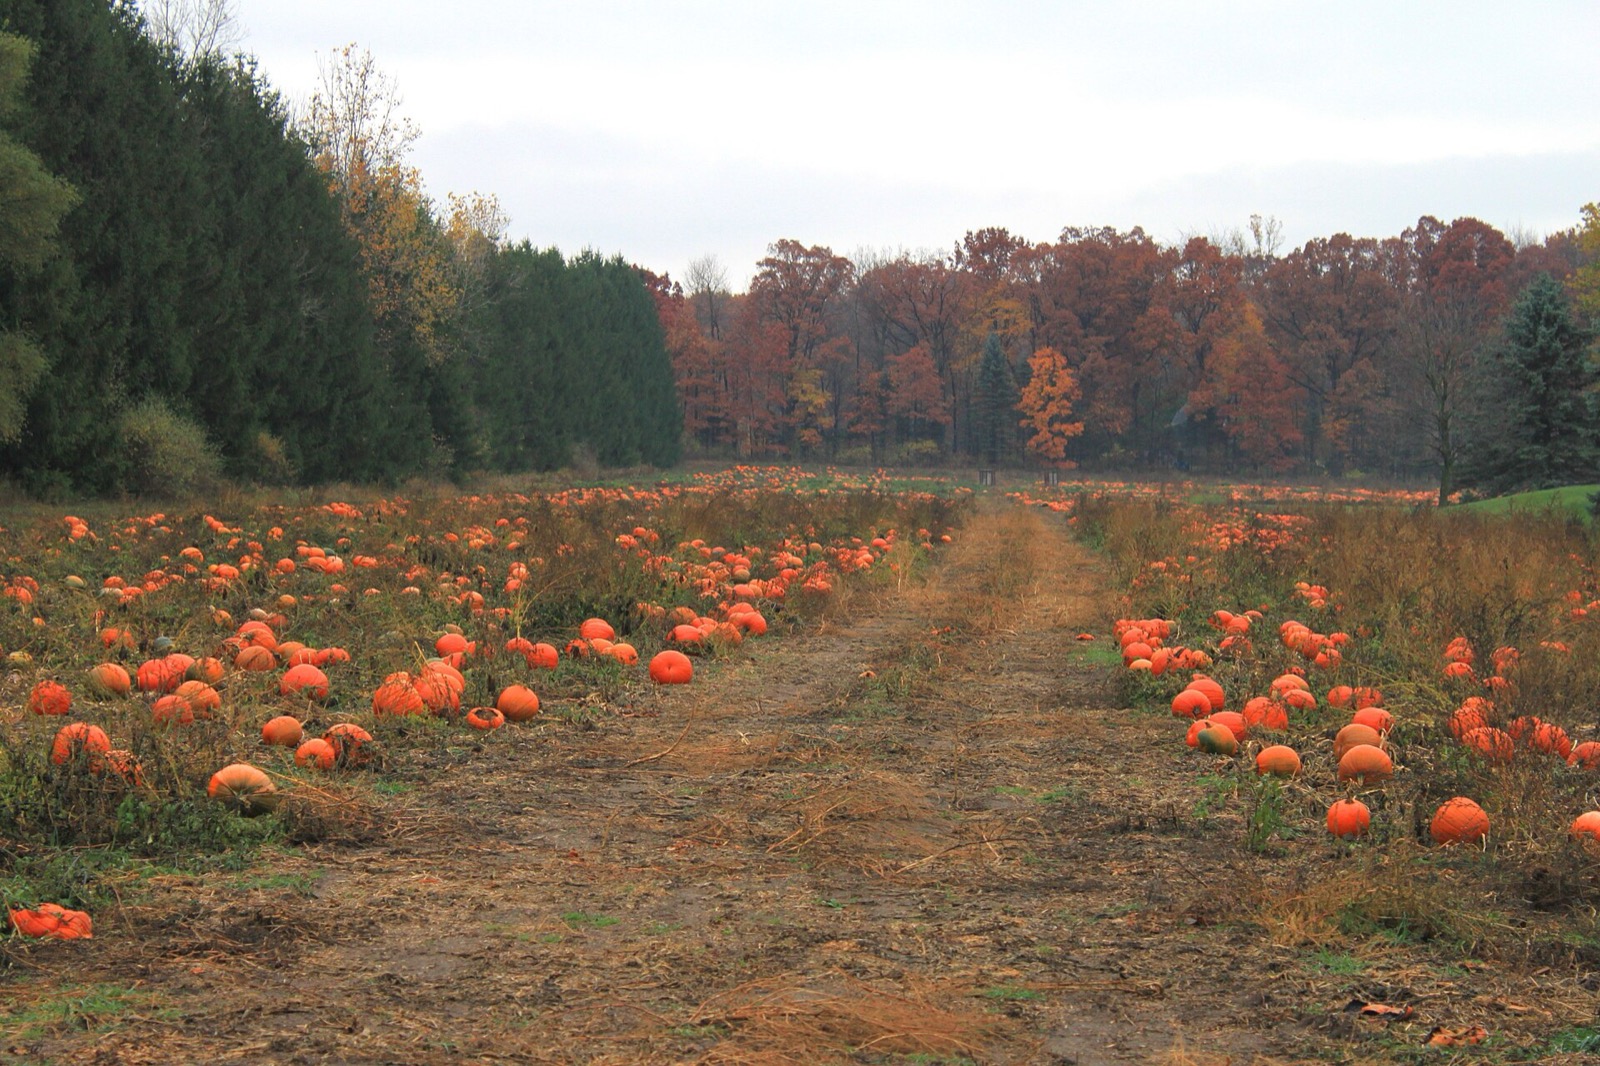
Pumpkins. Not really a harvest window at all. A pumpkin patch is a Halloween business, and it closes on October 31 in Georgia and in Maine alike whatever the weather did. Pumpkins are cut and left on the vine or on pallets, so the patch date is set by the holiday rather than by ripeness. The only thing weather moves is the opening: the north opens earlier because the vines finish earlier.
Christmas trees. The only window on this page that is identical in every state that has one. Cut your own opens the Friday after Thanksgiving and the good trees are gone by the second weekend of December. A Christmas tree took eight to ten years to reach cutting height, so nothing about the current season moves the date. Thanksgiving moves, which is why the opening below is computed from the fourth Thursday of November rather than typed in.
Seven harvest bands
There is no federal table of harvest windows for these crops: USDA crop progress does not carry fruit for most states, and Florida’s department of agriculture is the one of fifty that publishes a quotable harvest calendar. So every window here except Florida’s is ours, and the country is split into seven wide bands, each state placed in one by hand with its NOAA frost date printed beside it.
The tempting alternative was a formula: offset every window from the state’s median last spring frost. It falls apart on contact with the country. Washington clears frost earlier than Pennsylvania and picks later than Maine, because Puget Sound keeps the spring mild and the summer cool at the same time. A formula that is confidently wrong in a third of the country is worse than a band that is wide everywhere.
Subtropical
Florida and Hawaii, where the fruit calendar is inverted. Strawberries are a winter crop set out in October and picked from December, and the summer is the off season rather than the season.
- strawberries December 1 to April 30
- blueberries April 1 to May 31
- peaches April 1 to May 31
- apples June 15 to September 15
- pumpkins October 1 to October 31
- Christmas trees November 27 to December 23
Florida and Hawaii
Deep South and Desert Southwest
Frost risk ends in March. Strawberries start in April, peaches carry most of the summer, and by the time the northern states are picking their first berries the Georgia peach crop is already halfway through.
- strawberries April 1 to May 25
- blueberries May 5 to July 15
- peaches May 15 to August 20
- apples July 15 to October 15
- pumpkins September 25 to October 31
- Christmas trees November 27 to December 23
South Carolina, Georgia, Alabama, Mississippi, Louisiana, Texas and Arizona
Upper South and Mid Atlantic
The longest fruit calendar in the country. Frost clears in early April, strawberries follow within a fortnight, and apples hang into early November. Six crops fit comfortably.
- strawberries April 20 to June 10
- blueberries June 1 to July 31
- peaches June 15 to September 10
- apples August 10 to November 5
- pumpkins September 20 to October 31
- Christmas trees November 27 to December 23
Delaware, Maryland, Virginia, West Virginia, North Carolina, Tennessee, Kentucky, Arkansas and Oklahoma
Lower Midwest, Mid Atlantic and Interior West
Frost clears at the end of April. Strawberries land in the back half of May, peaches in July, and the apple season is the long one that carries the autumn.
- strawberries May 20 to June 30
- blueberries June 20 to August 15
- peaches July 5 to September 20
- apples August 20 to November 5
- pumpkins September 15 to October 31
- Christmas trees November 27 to December 23
New Jersey, Pennsylvania, Ohio, Indiana, Illinois, Missouri, Kansas, New Mexico and Utah
Great Lakes, Northeast and Upper Plains
The classic June strawberry, July blueberry, September apple calendar. Frost clears in the first fortnight of May and everything follows in order from there.
- strawberries June 5 to July 10
- blueberries July 1 to August 31
- peaches July 20 to September 20
- apples September 1 to October 31
- pumpkins September 12 to October 31
- Christmas trees November 27 to December 23
Massachusetts, Connecticut, Rhode Island, New York, Michigan, Wisconsin, Minnesota, Iowa, Nebraska and South Dakota
Northern New England, Northern Rockies and Alaska
The shortest and latest calendar. Frost can hold into the third week of May, strawberries wait for late June, and the apple season is over before Halloween in most years.
- strawberries June 15 to July 25
- blueberries July 10 to September 5
- peaches August 1 to September 15
- apples September 5 to October 25
- pumpkins September 10 to October 31
- Christmas trees November 27 to December 23
Maine, New Hampshire, Vermont, North Dakota, Montana, Wyoming, Colorado, Idaho, Nevada and Alaska
Pacific Coast
The frost date lies here. Maritime springs clear early but summers stay cool, so ripening runs weeks behind what the frost calendar suggests, and the windows are correspondingly wide and late.
- strawberries May 15 to August 31
- blueberries June 20 to September 15
- peaches June 1 to September 30
- apples August 15 to November 10
- pumpkins September 20 to October 31
- Christmas trees November 27 to December 23
Washington, Oregon and California
Which state grows what
Every state has a page, because every state grows something on this list. What differs is how many of the six it fills. 37 states carry all six. The thinnest are North Dakota with 2, Wyoming with 2 and Alaska with 2, and those pages are more interesting than the full ones: they say which crops the census could not find and what the real numbers were.
| State | Strawberries | Blueberries | Peaches | Apples | Pumpkins | Christmas trees | Band |
|---|---|---|---|---|---|---|---|
| Maine | 🍓 | 🫐 | 🍑 | 🍎 | 🎃 | 🎄 | Northern New England, Northern Rockies and Alaska |
| New Hampshire | 🍓 | 🫐 | 🍑 | 🍎 | 🎃 | 🎄 | Northern New England, Northern Rockies and Alaska |
| Vermont | 🍓 | 🫐 | 🍑 | 🍎 | 🎃 | 🎄 | Northern New England, Northern Rockies and Alaska |
| Massachusetts | 🍓 | 🫐 | 🍑 | 🍎 | 🎃 | 🎄 | Great Lakes, Northeast and Upper Plains |
| Connecticut | 🍓 | 🫐 | 🍑 | 🍎 | 🎃 | 🎄 | Great Lakes, Northeast and Upper Plains |
| Rhode Island | 🍓 | 🫐 | · | 🍎 | 🎃 | 🎄 | Great Lakes, Northeast and Upper Plains |
| New York | 🍓 | 🫐 | 🍑 | 🍎 | 🎃 | 🎄 | Great Lakes, Northeast and Upper Plains |
| New Jersey | 🍓 | 🫐 | 🍑 | 🍎 | 🎃 | 🎄 | Lower Midwest, Mid Atlantic and Interior West |
| Pennsylvania | 🍓 | 🫐 | 🍑 | 🍎 | 🎃 | 🎄 | Lower Midwest, Mid Atlantic and Interior West |
| Delaware | 🍓 | 🫐 | 🍑 | 🍎 | 🎃 | 🎄 | Upper South and Mid Atlantic |
| Maryland | 🍓 | 🫐 | 🍑 | 🍎 | 🎃 | 🎄 | Upper South and Mid Atlantic |
| Virginia | 🍓 | 🫐 | 🍑 | 🍎 | 🎃 | 🎄 | Upper South and Mid Atlantic |
| West Virginia | 🍓 | 🫐 | 🍑 | 🍎 | 🎃 | 🎄 | Upper South and Mid Atlantic |
| North Carolina | 🍓 | 🫐 | 🍑 | 🍎 | 🎃 | 🎄 | Upper South and Mid Atlantic |
| South Carolina | 🍓 | 🫐 | 🍑 | 🍎 | 🎃 | 🎄 | Deep South and Desert Southwest |
| Georgia | 🍓 | 🫐 | 🍑 | 🍎 | 🎃 | 🎄 | Deep South and Desert Southwest |
| Florida | 🍓 | 🫐 | 🍑 | 🍎 | 🎃 | 🎄 | Subtropical |
| Alabama | 🍓 | 🫐 | 🍑 | 🍎 | 🎃 | 🎄 | Deep South and Desert Southwest |
| Tennessee | 🍓 | 🫐 | 🍑 | 🍎 | 🎃 | 🎄 | Upper South and Mid Atlantic |
| Kentucky | 🍓 | 🫐 | 🍑 | 🍎 | 🎃 | 🎄 | Upper South and Mid Atlantic |
| Ohio | 🍓 | 🫐 | 🍑 | 🍎 | 🎃 | 🎄 | Lower Midwest, Mid Atlantic and Interior West |
| Indiana | 🍓 | 🫐 | 🍑 | 🍎 | 🎃 | 🎄 | Lower Midwest, Mid Atlantic and Interior West |
| Illinois | 🍓 | 🫐 | 🍑 | 🍎 | 🎃 | 🎄 | Lower Midwest, Mid Atlantic and Interior West |
| Michigan | 🍓 | 🫐 | 🍑 | 🍎 | 🎃 | 🎄 | Great Lakes, Northeast and Upper Plains |
| Wisconsin | 🍓 | 🫐 | 🍑 | 🍎 | 🎃 | 🎄 | Great Lakes, Northeast and Upper Plains |
| Minnesota | 🍓 | 🫐 | · | 🍎 | 🎃 | 🎄 | Great Lakes, Northeast and Upper Plains |
| Mississippi | 🍓 | 🫐 | 🍑 | 🍎 | 🎃 | 🎄 | Deep South and Desert Southwest |
| Louisiana | 🍓 | 🫐 | 🍑 | 🍎 | 🎃 | 🎄 | Deep South and Desert Southwest |
| Arkansas | 🍓 | 🫐 | 🍑 | 🍎 | 🎃 | 🎄 | Upper South and Mid Atlantic |
| Texas | 🍓 | 🫐 | 🍑 | 🍎 | 🎃 | 🎄 | Deep South and Desert Southwest |
| Oklahoma | 🍓 | 🫐 | 🍑 | 🍎 | 🎃 | 🎄 | Upper South and Mid Atlantic |
| Missouri | 🍓 | 🫐 | 🍑 | 🍎 | 🎃 | 🎄 | Lower Midwest, Mid Atlantic and Interior West |
| Iowa | 🍓 | 🫐 | 🍑 | 🍎 | 🎃 | 🎄 | Great Lakes, Northeast and Upper Plains |
| Kansas | 🍓 | 🫐 | 🍑 | 🍎 | 🎃 | 🎄 | Lower Midwest, Mid Atlantic and Interior West |
| Nebraska | 🍓 | 🫐 | 🍑 | 🍎 | 🎃 | 🎄 | Great Lakes, Northeast and Upper Plains |
| South Dakota | 🍓 | · | · | 🍎 | 🎃 | 🎄 | Great Lakes, Northeast and Upper Plains |
| North Dakota | · | · | · | 🍎 | 🎃 | · | Northern New England, Northern Rockies and Alaska |
| Montana | · | · | 🍑 | 🍎 | 🎃 | 🎄 | Northern New England, Northern Rockies and Alaska |
| Wyoming | · | · | · | 🍎 | 🎃 | · | Northern New England, Northern Rockies and Alaska |
| Colorado | 🍓 | · | 🍑 | 🍎 | 🎃 | 🎄 | Northern New England, Northern Rockies and Alaska |
| New Mexico | · | · | 🍑 | 🍎 | 🎃 | 🎄 | Lower Midwest, Mid Atlantic and Interior West |
| Washington | 🍓 | 🫐 | 🍑 | 🍎 | 🎃 | 🎄 | Pacific Coast |
| Oregon | 🍓 | 🫐 | 🍑 | 🍎 | 🎃 | 🎄 | Pacific Coast |
| California | 🍓 | 🫐 | 🍑 | 🍎 | 🎃 | 🎄 | Pacific Coast |
| Idaho | 🍓 | 🫐 | 🍑 | 🍎 | 🎃 | 🎄 | Northern New England, Northern Rockies and Alaska |
| Utah | · | · | 🍑 | 🍎 | 🎃 | 🎄 | Lower Midwest, Mid Atlantic and Interior West |
| Nevada | · | · | 🍑 | 🍎 | 🎃 | · | Northern New England, Northern Rockies and Alaska |
| Arizona | · | · | 🍑 | 🍎 | 🎃 | · | Deep South and Desert Southwest |
| Alaska | 🍓 | · | · | 🍎 | · | · | Northern New England, Northern Rockies and Alaska |
| Hawaii | · | · | · | 🍎 | 🎃 | 🎄 | Subtropical |
A dot in that table is not a claim that nobody grows the crop. It means the census counted fewer than 10 farms, or under 10 acres with no withheld cell, which is the line this site draws for a crop somebody could plausibly drive to on a Saturday. Wyoming has three farms reporting strawberries. That is a real fact about Wyoming and it is on Wyoming’s page, next to the two crops that do clear the line.
Summarised from USDA NASS 2022 Census of Agriculture, Quick Stats bulk census file in our own words.
What is federal, what is a state’s, and what is ours
The numbers are federal and quotable. Every acre and every farm count on this site is USDA’s, from a census whose whole purpose is, in its own words, to account for:
USDA NASS, 2022 Census of Agriculture, Appendix A, Census of Agriculture Methodology“any place from which $1,000 or more of agricultural products were produced and sold, or normally would have been sold, during the census year.”
That census also names u-pick in its own definitions, which is the closest thing to a federal definition of this vertical that exists:
USDA NASS, 2022 Census of Agriculture, Appendix B, Value of food sold directly to consumers“Data represent the value of edible products, including value added products, produced and sold for human consumption directly to consumers at farmers markets, on-farm stores or farm stands, roadside stands or stores, u-pick, CSA (Community Supported Agriculture), online marketplaces, etc.”
A blank cell in that census is a fact rather than a gap. NASS withholds a number when publishing it would identify the farm behind it:
USDA NASS, 2022 Census of Agriculture, Appendix A, Disclosure Review“NASS is obligated to withhold, under Title 7, U.S. Code, any total that would reveal an individual’s information or allow it to be closely estimated by the public.”
And the sentence that lets a state page show a farm count next to a withheld acreage on the same row:
USDA NASS, 2022 Census of Agriculture, Appendix A, Disclosure Review“Farm counts are not considered sensitive and are not subject to disclosure controls.”
The dates are a different matter. Florida’s department of agriculture publishes its own harvest calendar, on its own domain, under its own consumer programme, with no third party byline. It is quotable as a public record:
Florida Department of Agriculture and Consumer Services, Crops in Season“Florida Crops Seasonal Availability/Typical Harvest Times”
Florida Department of Agriculture and Consumer Services, Florida Crops Seasonal Availability/Typical Harvest Times“Note: Weather conditions can affect the harvest schedule.”
That second sentence is the whole point in nine words, and it comes from a state agency. The authorship note beside it exists because a state branded page is not proof a state agency wrote it; a harvest calendar run by a grower association on a state look alike domain would carry no such authority.
Here is what a set of windows looks like on a state page, using the one state whose fruit windows are an agency’s. Every state page carries one of these, with the windows, the weather caveat, the census evidence and the way of finding a farm together:
Farm directories are a third register again. A federal directory of on-farm markets. Farms list themselves, so an entry is a claim by the farm and not a check by USDA, and a farm with no entry is not a farm that is closed. Every state page links its own department of agriculture and this federal directory. For a farm’s hours, its prices, whether it takes cards and whether it has anything left in the field this weekend, the farm’s own page is the source, and it is the operator’s to keep current.
Summarised from USDA Local Food Directories, on-farm markets in our own words.
Pick your own FAQ
The rest of the local food calendar
Picking windows by state
Acreage and farm counts are USDA NASS’s, from the 2022 Census of Agriculture, a US Government work in the public domain, pulled from the Quick Stats bulk census file on 2026-09-04. Frost medians are NOAA 1991 to 2020 normals for representative stations. Florida’s harvest windows are the Florida Department of Agriculture and Consumer Services’ own; every other window on this site is ours, placed by hand into a harvest band and printed next to the state’s frost date so it can be checked. Picking windows in every state