
Lake Effect Snow: The Belts, the Machine, the Season
Why the lee shores of the Great Lakes hold the snowiest cities in America, in the National Weather Service's own words, with NOAA normals for 21 belt cities and live NWS alerts.
Eight snowbelt states, 21 belt cities, one mechanismThe belts at a glance
NOAA NCEI normals, 1991-2020Snowfall figures are NOAA NCEI 1991-2020 normals attributed to named stations; the ice figures are our arithmetic on NOAA GLERL’s daily ice record, explained below.
How lake effect snow works, in NWS words
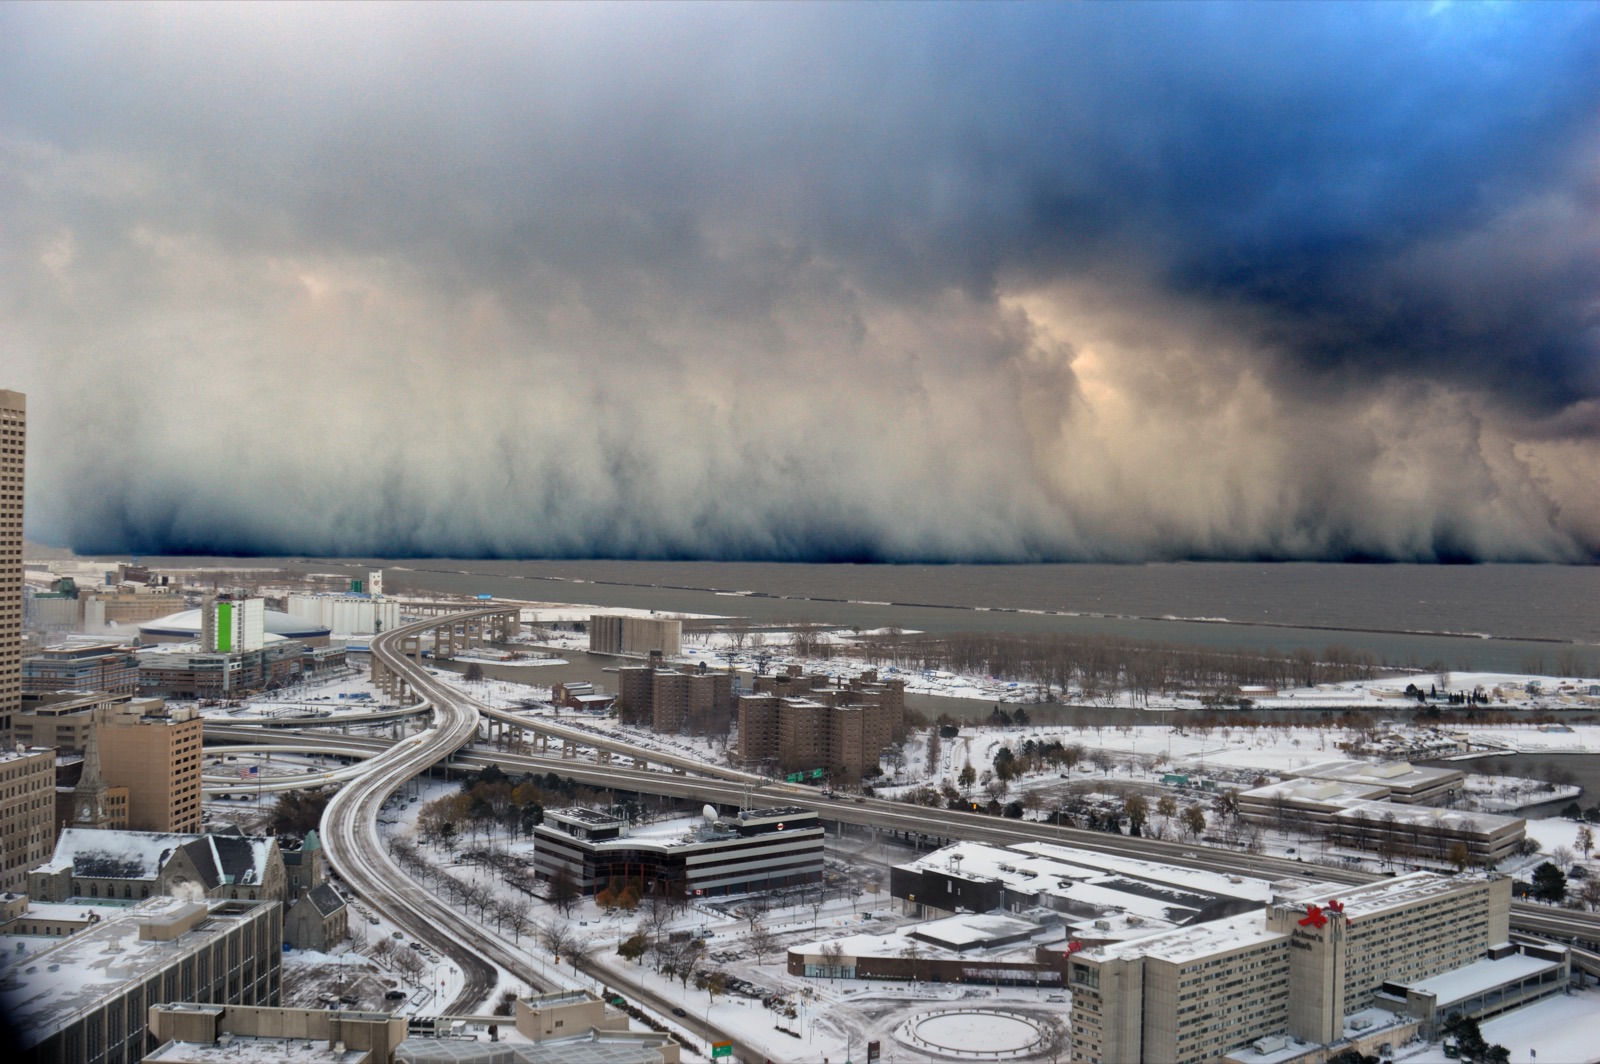
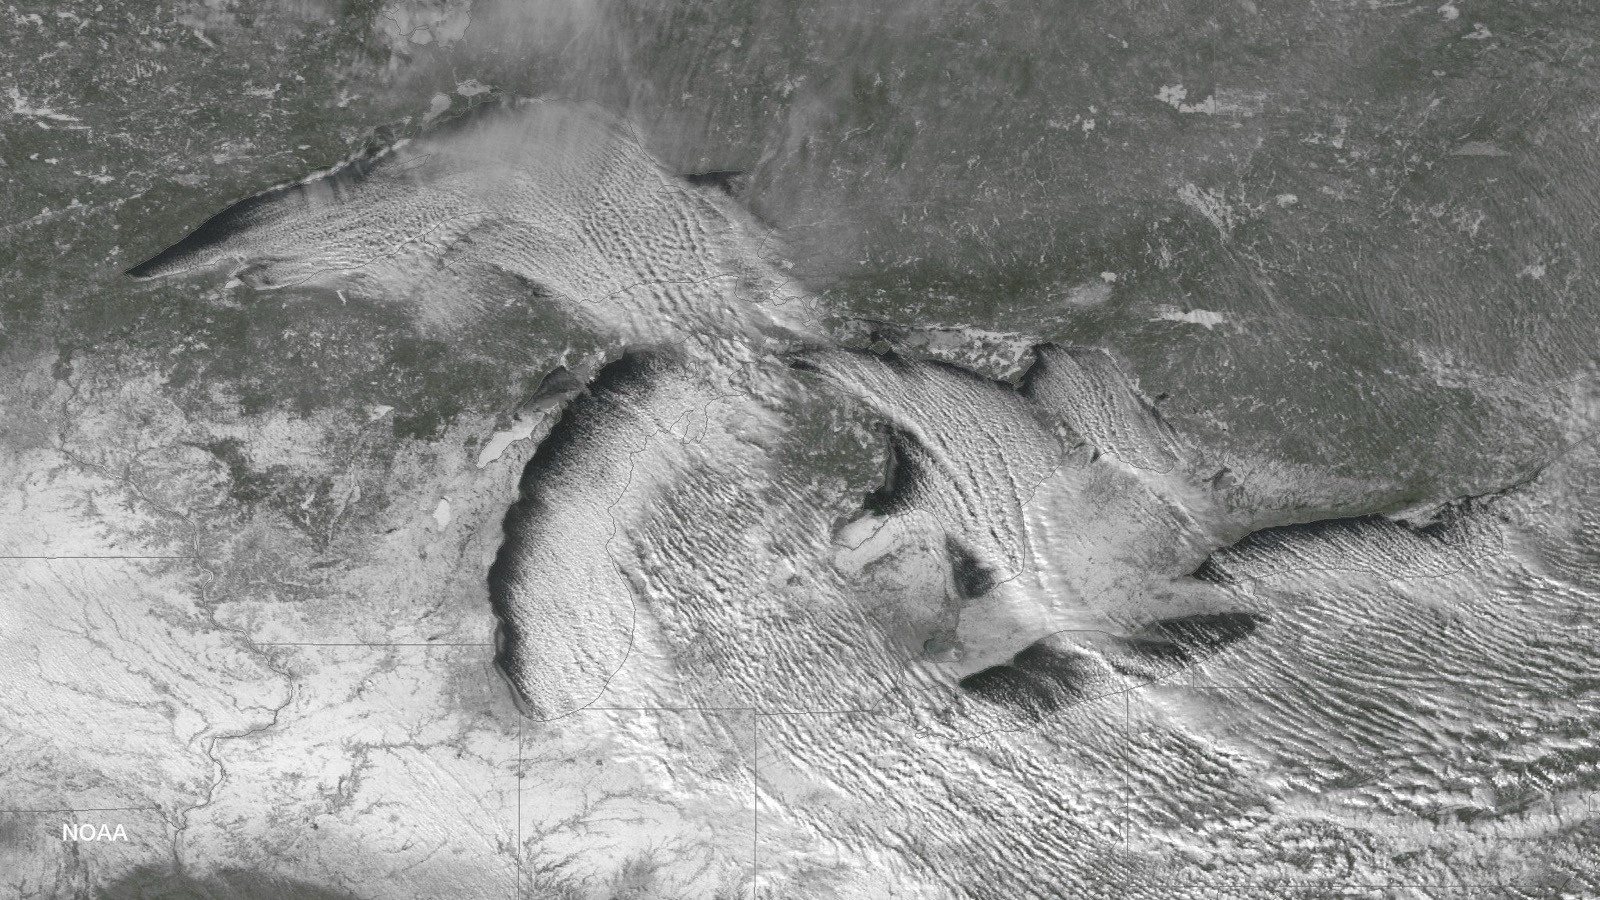
The National Weather Service’s public explainer puts the whole machine in four sentences: “Lake Effect snow occurs when cold air, often originating from Canada, moves across the open waters of the Great Lakes. As the cold air passes over the unfrozen and relatively warm waters of the Great Lakes, warmth and moisture are transferred into the lowest portion of the atmosphere. The air rises, clouds form and grow into narrow band that produces 2 to 3 inches of snow per hour or more.” And the part that decides who gets buried: “Wind direction is a key component in determining which areas will receive lake effect snow. Heavy snow may be falling in one location, while the sun may be shining just a mile or two away in either direction.” (weather.gov)
Three ingredients recur in every NWS office’s local science pages. Cold aloft: the working rule is a lake-to-850mb temperature difference of about 13 degrees Celsius, and NWS Gaylord’s research finds 850 mb temperatures of roughly minus 12 to minus 19 Celsius make the biggest dendrites and the heaviest snow (NWS Gaylord, Lake Snow Parameter). Fetch: NWS Grand Rapids calls fetch “essentially the distance that air must travel from the upwind side of the lake to the downwind side”, and the longer that run, the stronger the band (NWS Grand Rapids). And wind direction, which aims the result: for where the heaviest snow falls, it “is probably the most important factor”.
The snowbelts, state by state
New York
Two belts, two personalities: the Lake Erie belt from Buffalo south through Chautauqua County, and the Lake Ontario belt from Rochester through Oswego County up onto the Tug Hill Plateau, the snowiest terrain east of the Rockies.
Pennsylvania
One compact belt in the far northwest corner: the city of Erie and the higher ground behind it, on Pennsylvania's roughly 50 miles of Lake Erie shoreline.
Ohio
The northeast Ohio snowbelt: from the eastern Cleveland suburbs across Geauga, Lake and Ashtabula Counties, where the land rises several hundred feet above Lake Erie.
Michigan
Four distinct belts: the southwest lower peninsula (Grand Rapids to the Indiana line), the northwest lower (Traverse City, Petoskey, the Gaylord plateau), the eastern UP (Sault Ste. Marie), and the Superior shore of the western UP (Marquette, the Keweenaw).
Indiana
A small, genuine belt tucked against Lake Michigan's southern end: LaPorte, Porter and St. Joseph Counties, including South Bend.
Wisconsin
The Lake Superior south shore belt across Bayfield, Ashland and Iron Counties, the region NWS Duluth flatly calls "the Snowbelt". Door County and the Lake Michigan shore see a much weaker secondary version.
Minnesota
The backwards belt: Minnesota's North Shore sits UPWIND of Lake Superior on the northerly flow that drives the Wisconsin and Michigan snowbelts, so its lake effect arrives only on less-common east and southeast winds.
Utah
The Great Salt Lake effect: bands on northwest flow that favor the Salt Lake Valley, the Tooele Valley, and the Cottonwood Canyons of the Wasatch southeast of the lake.
Named exclusions, with the reason
Illinois: Illinois sits on the UPWIND shore of Lake Michigan for the prevailing west and northwest winter winds, so it has no persistent belt. NWS Chicago documents real but occasional events on northerly flow, like January 30-31, 2026, when a band clipped northeast Illinois before settling on Porter County, Indiana. (NWS event page)
Smaller lakes elsewhere (Champlain, the Finger Lakes, the Salt Lake’s Utah Lake neighbor) produce occasional NWS-documented bands but no sustained belt, so they are covered inside the relevant state pages rather than with pages of their own.
Erie freezes and stops. Ontario does not.
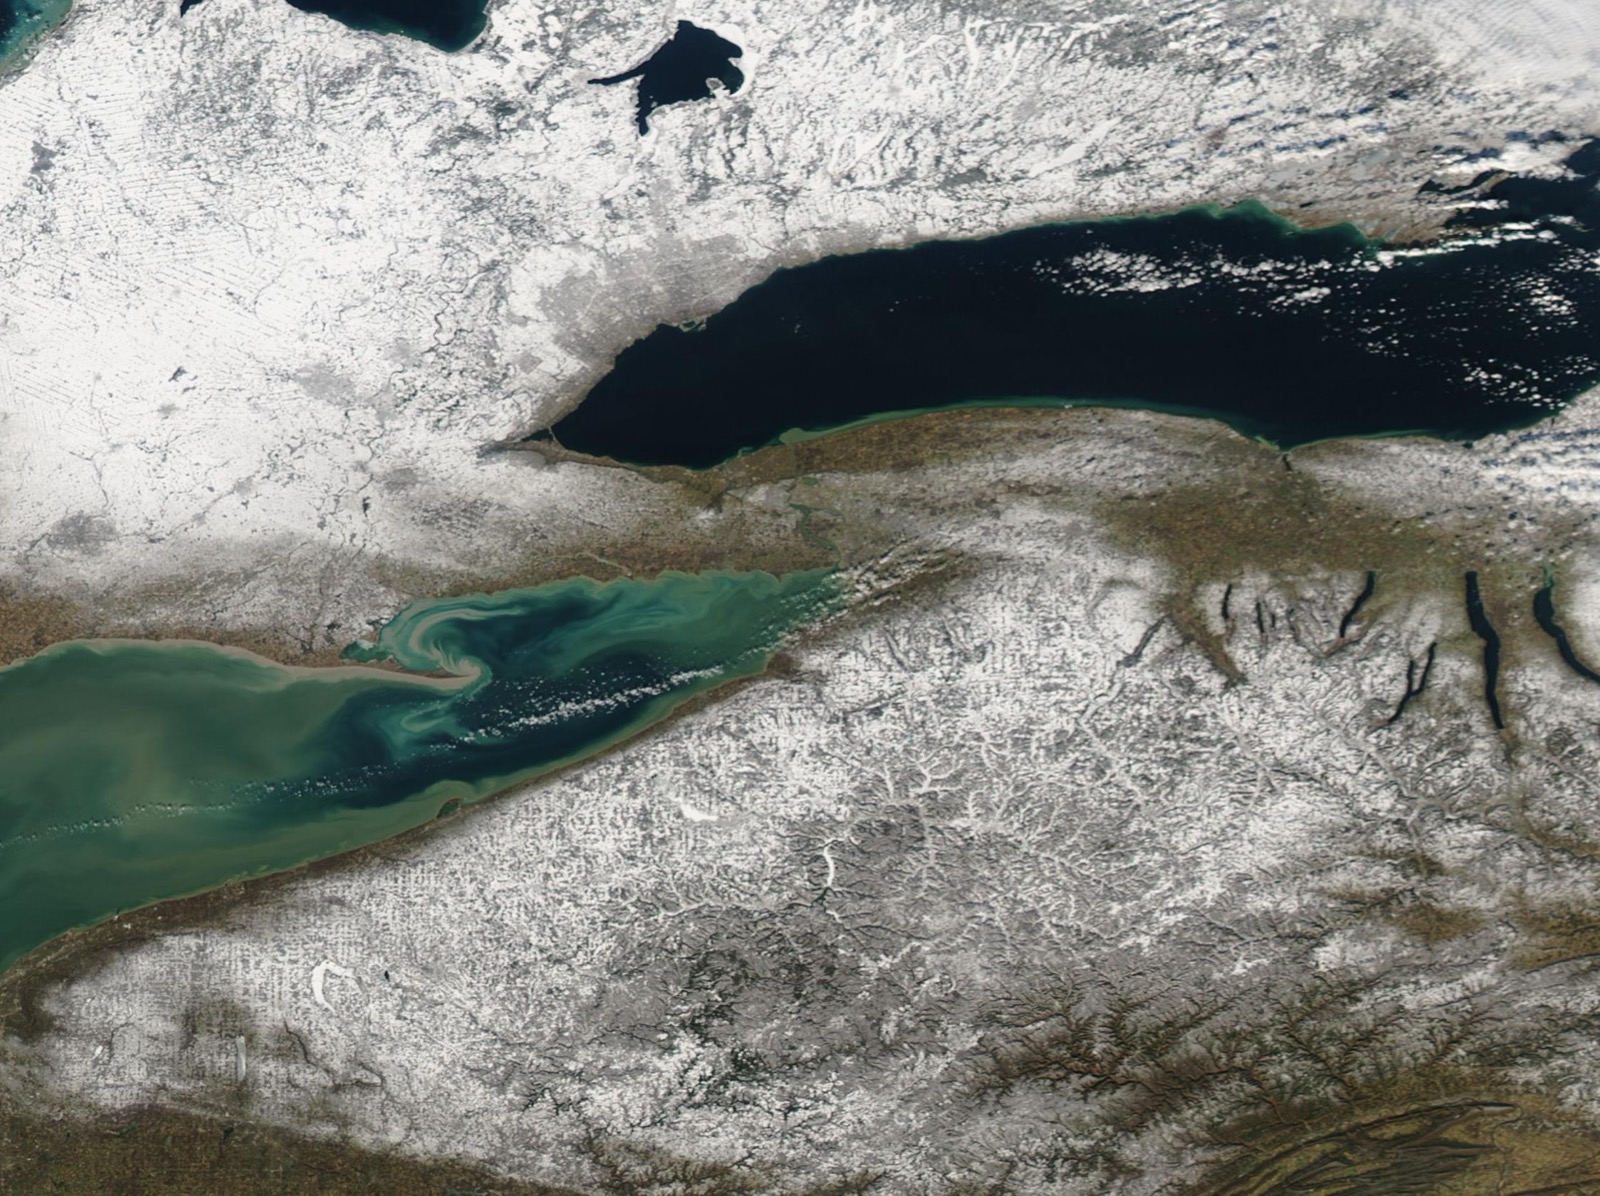
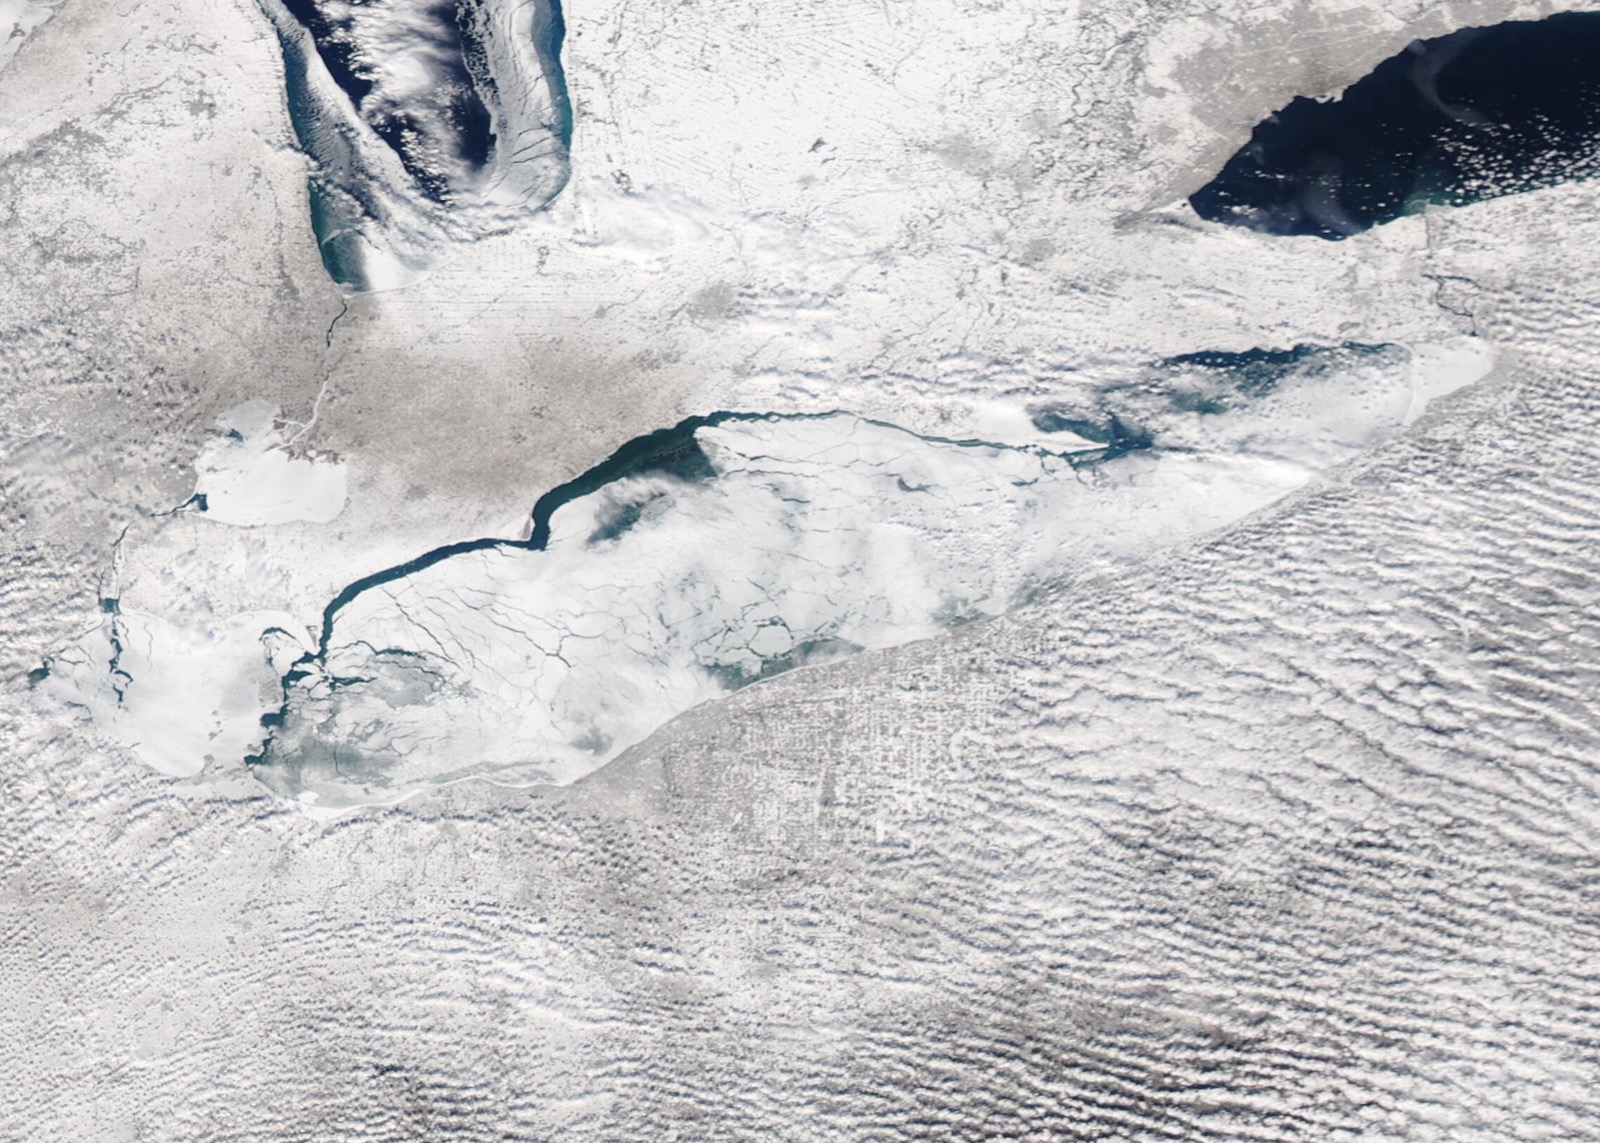
Lake effect snow needs open water, so ice cover is the season’s off switch, and the two eastern lakes throw that switch completely differently. Lake Erie is the shallowest Great Lake and freezes in most winters; when it does, Buffalo’s and Erie’s snow machines go quiet. Lake Ontario is far deeper, almost never builds major ice, and keeps feeding the Tug Hill and Syracuse all winter. That single contrast explains why the Erie belt’s worst storms come early (November 2014, November 2022, Thanksgiving 2024) while the Ontario belt grinds out the biggest season totals in the East.
Lake Erie
average annual maximum ice cover; 34 of 53 winters peaked at 90% or more. The shallowest Great Lake freezes, and its snow machine stops.
Lake Ontario
average annual maximum ice cover; only 7 of 53 winters even reached 50%. The deep lake stays open, and its belt keeps running.
Our averages, computed from NOAA GLERL’s daily Great Lakes ice cover record (GLICD), ice years 1973 to 2025: for each winter we take the season’s peak daily lake-averaged ice cover, then average those peaks.
Winter products across the snowbelt right now
Every active NWS winter product in the eight covered states, read live from api.weather.gov and reproduced as issued. In summer an empty panel is the expected answer.
Checking api.weather.gov for active winter weather products…
Why the mixed product names: for the 2017-2018 winter the NWS consolidated its lake effect products into the general winter suite. The Lake Effect Snow Warning came back on October 1, 2019, but per Service Change Notice 19-63 its use is “optional at Regional discretion” and offices may still issue Winter Storm Warnings “with the lake effect component specified in the ‘What’ section”. The old Lake Effect Snow Watch and Advisory were never reinstated. So this page passes through every winter product for the area and tags the ones whose own NWS text names lake effect.
Whiteout and travel decisions belong with the National Weather Service (weather.gov winter safety) and your state 511 system. NWS products above are reproduced as issued.
The snowiest cities, by NOAA normals
Our comparison of NOAA NCEI 1991-2020 station normals across the 21 belt cities in this catalog, snowiest first. This is arithmetic on official numbers, not an official ranking; the fan-run Golden Snow Globe tracks the season-by-season contest among big cities using NWS totals.
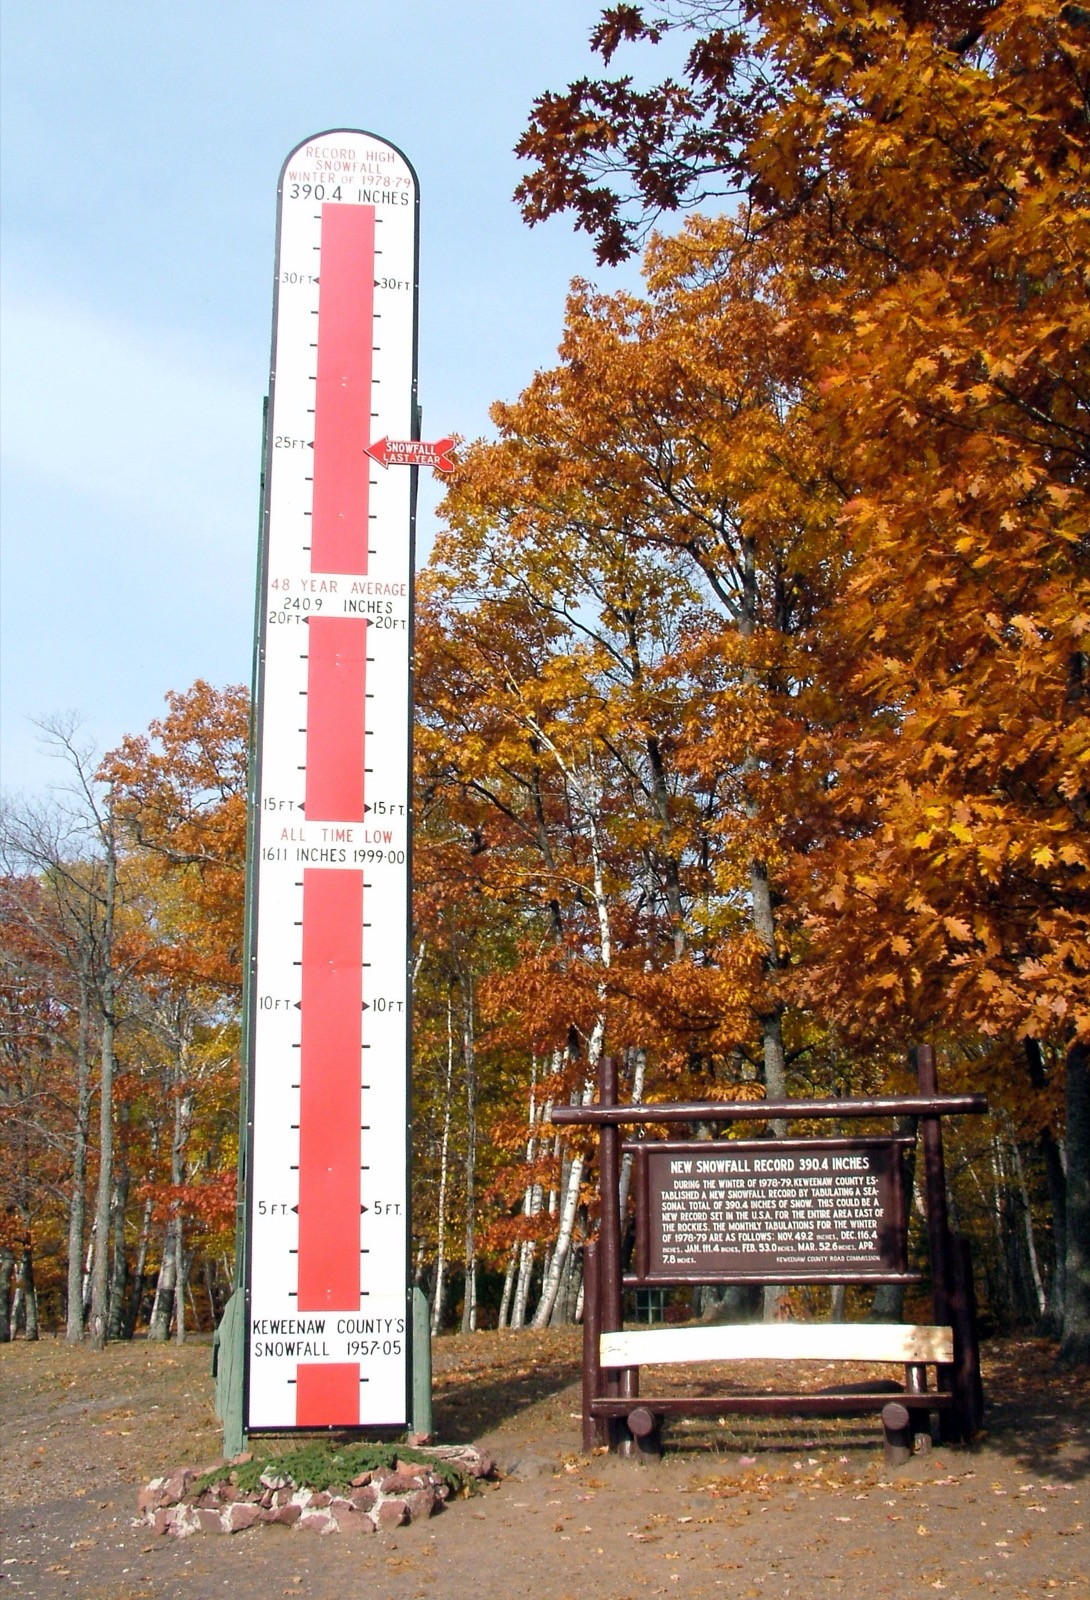
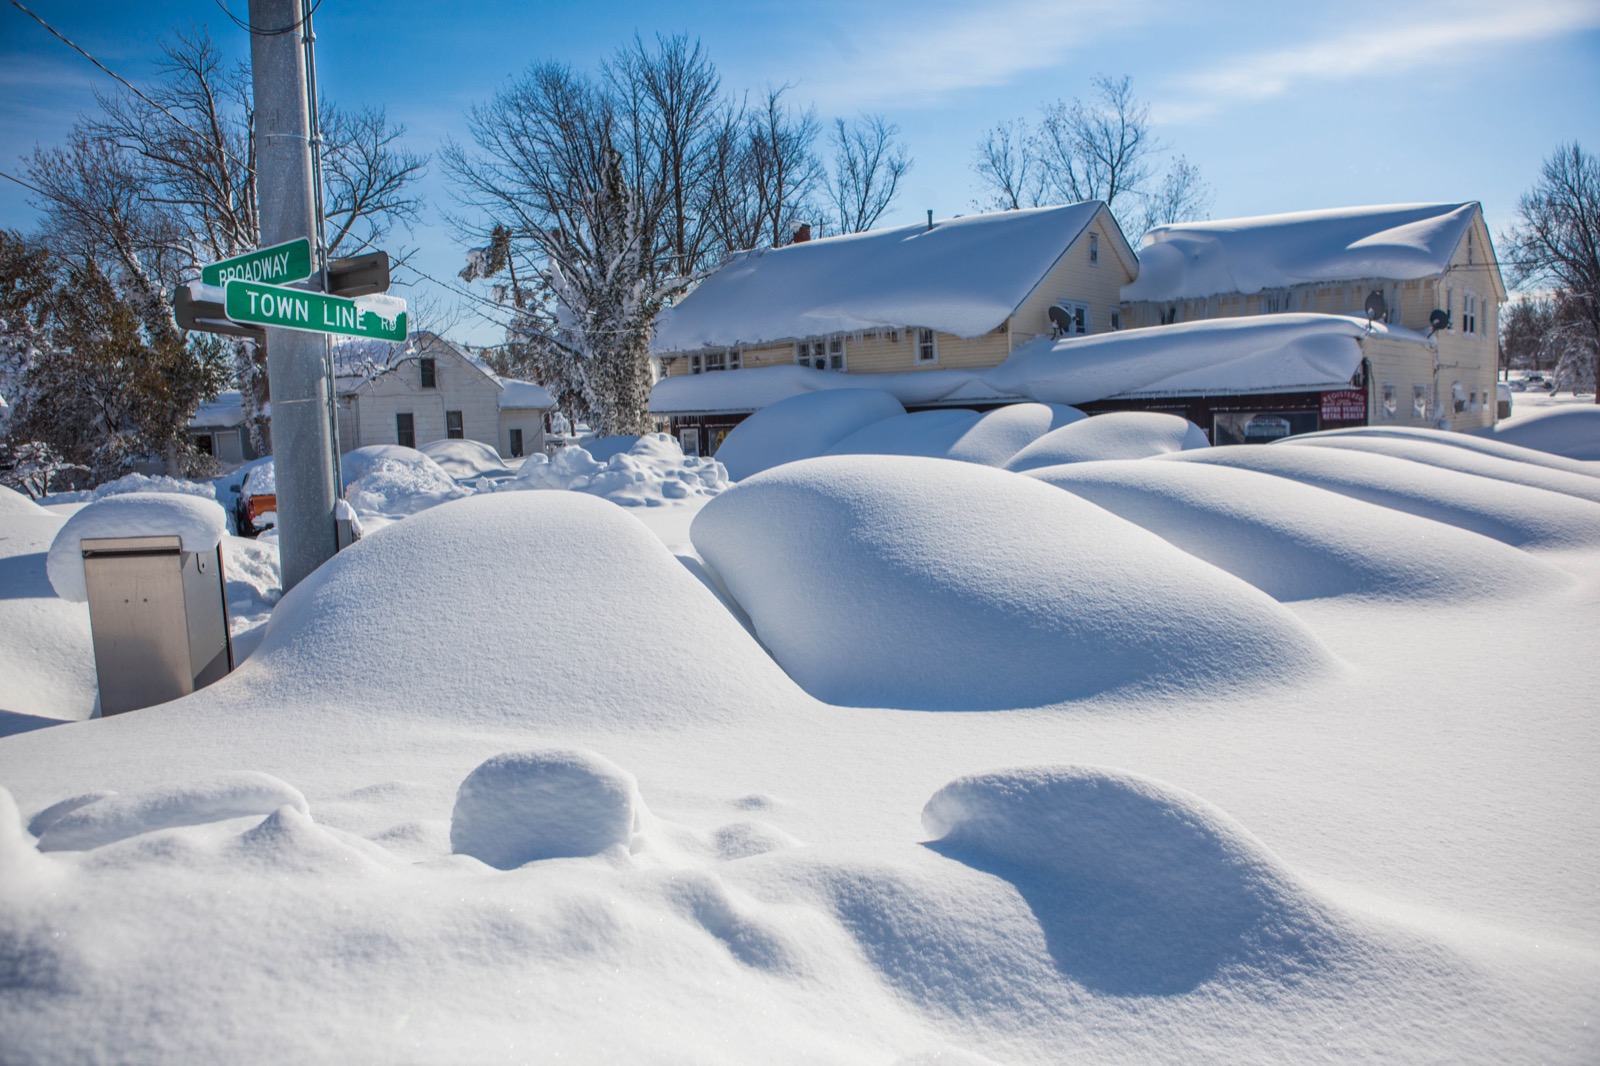
What a belt season looks like
Lake effect snow FAQ
State and planning pages
Sources on this page: NWS explainers and event summaries (quoted verbatim with links), NOAA NCEI 1991-2020 U.S. Climate Normals by named station, and NOAA GLERL daily ice cover records (our arithmetic, labeled). All federal data is public domain. Live products from api.weather.gov, reproduced as issued. Road and travel decisions are routed to NWS winter safety and each state’s 511 system.
Hero image: “Snowfall descending on the Buffalo Southtowns” — NOAA Photo Library, NWS Collection — Public domain