
Red Tide and Algal Bloom Status 2026
What the agencies responsible are reporting right now, reproduced exactly as they issued it, and when blooms normally happen on your coast.
Reading the latest agency sampling…Harmful algal blooms in the United States right now
Live · agency status, as issuedEvery category on this page is the agency’s own, in the agency’s own words, with the agency named and the time attached.
What the agencies are reporting today
Three agencies publish harmful algal bloom status that a browser can read directly. The Florida Fish and Wildlife Conservation Commission publishes categorical cell counts from its statewide sampling, and NOAA’s National Centers for Coastal Ocean Science publishes a separate beach level forecast of respiratory irritation; both are reproduced below. The Oregon Department of Agriculture publishes live shellfish closure status, which appears on the Oregon page. The FWC and NOAA scales measure different things.
FWC Karenia brevis sampling, Florida, last eight days
This sampling export carries no readable timestamp. Check it directly with FWC before relying on it.
Reading the latest FWC sampling…
NOAA respiratory irritation forecast
NOAA runs this forecast at named beaches, combining the most recent cell counts with forecast wind to say what someone standing on that specific sand is likely to feel over roughly the next day. NCCOS describes the product as covering the Florida and Texas coasts, and says that in rare cases, when blooms reach other areas such as the northern Gulf coast states or Florida’s Atlantic coast, the forecast can be expanded to include affected regions. So the list of beaches below is not fixed: it is whichever stations NOAA is running today.
This model run carries no readable timestamp. Check it directly with NOAA NCCOS before relying on it.
Reading the NOAA respiratory irritation forecast…
States with a monitored bloom and an agency that publishes it
Each state page covers a bloom an agency documents as a recurring event with a season, published by an agency whose status the public can check on the day. Coastal states without a page, and where their status is published, are listed below.
Florida
Karenia brevis red tide. Usual season Aug 1 to Apr 30.
Published by FWC Fish and Wildlife Research Institute.
Texas
Gulf coast Karenia brevis red tide. Usual season Aug 1 to Feb 28.
Published by Texas Parks and Wildlife Department.
California
PSP and domoic acid biotoxins. Usual season May 1 to Oct 31.
Published by CDPH Marine Biotoxin Monitoring Program.
Oregon
Shellfish biotoxin closures. The responsible agency publishes no season, and closures happen year round.
Published by Oregon Department of Agriculture, Food Safety Program.
Washington
PSP, domoic acid and DSP biotoxins. The responsible agency publishes no season, and closures happen year round.
Published by Washington State Department of Health, Biotoxin Program.
Maine
Gulf of Maine red tide and PSP. Usual season Apr 1 to Oct 31.
Published by Maine Department of Marine Resources, Public Health Bureau.
Ohio
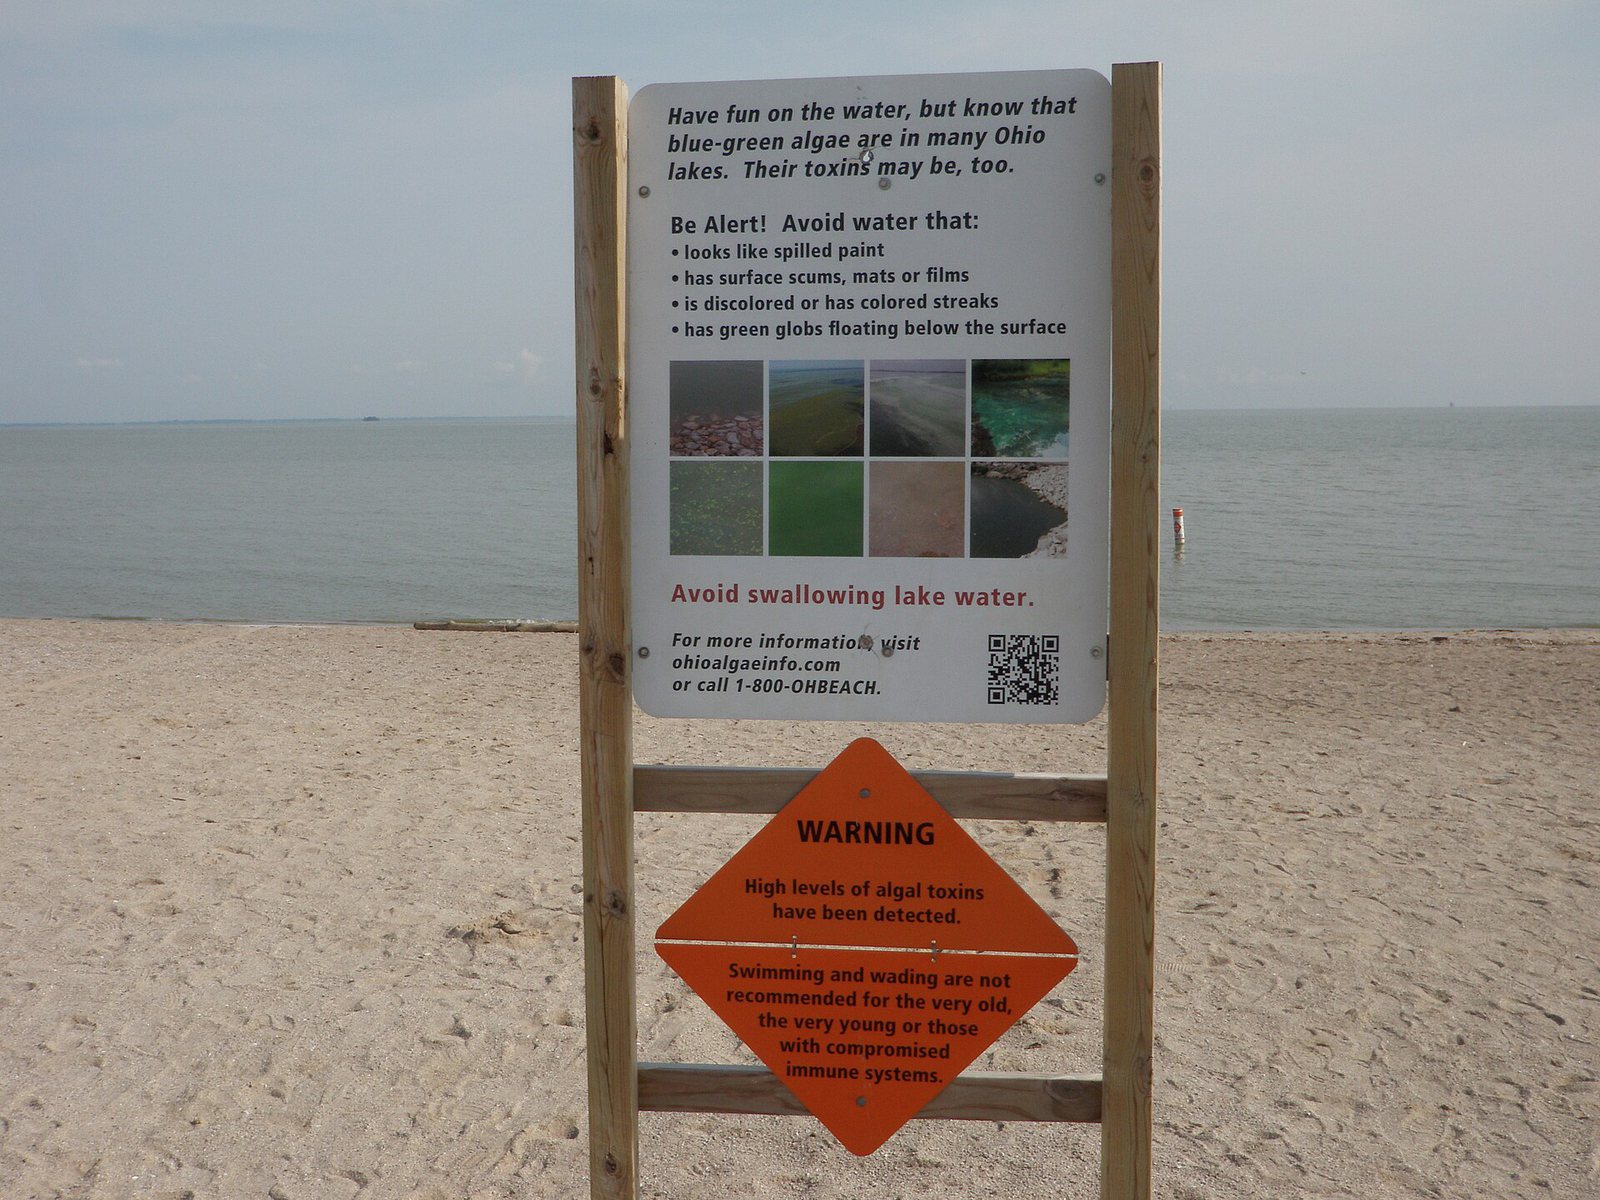
Western Lake Erie cyanobacteria. Usual season Jun 1 to Oct 31.
Published by Ohio Department of Health, BeachGuard.
Michigan
Inland lake and Lake Erie cyanobacteria. Usual season Jun 1 to Oct 15.
Published by Michigan Department of Environment, Great Lakes, and Energy.
Coastal states without a page
- Alabama. The Alabama Department of Public Health publishes Karenia brevis sampling for the Alabama coast. As of 2026-08-24 its most recent sample dated from 2026-04-07, with 549 of its 992 rows reading "Testing Not Performed", so the ADPH sampling page itself is the place to check current Alabama status.
- Massachusetts. The Massachusetts Division of Marine Fisheries runs the paralytic shellfish poisoning programme for the state and publishes Biotoxin Notices for its shellfish areas. Current Massachusetts closures are published on the Division's notices page at mass.gov.
- New Hampshire. The New Hampshire Department of Environmental Services runs a Gulf of Maine paralytic shellfish poisoning programme and a freshwater cyanobacteria advisory map. Current New Hampshire closures and advisories are published on des.nh.gov.
Inland lake cyanobacteria programmes
Freshwater cyanobacteria bloom in every state in the country, and several inland states run strong programmes. Kansas publishes an explicit April to October harmful algal bloom season with numeric Watch, Warning and Hazard thresholds. Utah runs a monitoring programme where the local health department, not the state, issues the advisory. Wisconsin, Vermont, Minnesota, New York and Indiana all publish real programmes too. These pages cover the coastal blooms people plan trips around, so inland lake advisories are published by each state’s own environment or health department. Ohio and Michigan are included because western Lake Erie is a coastal scale bloom with a NOAA seasonal forecast behind it.
Red tide in a year with no bloom
Red tide is event driven. Most coasts are quiet most of the time, and three things on this page hold in a quiet year as well as a bad one.
First, “nothing is happening” is the answer to the question. People search this because they do not know, and they are usually about to drive somewhere. A page that reproduces FWC’s most recent sampling and NOAA’s most recent beach run, with the times attached, answers that just as well on a clean day as on a bad one. The agencies do not stop publishing when the water is clear. FWC sampled hundreds of points in the last eight days regardless of what they found.
Second, the season is the durable part. FWC states that blooms of Karenia brevis occur in the Gulf almost every year, generally in late summer or early fall, and that most blooms last three to five months. NWS Cleveland states that the Lake Erie bloom season is typically July to October. Those sentences are true in January and true in a year with no bloom at all, and they are what someone planning an October trip to Sanibel or a July weekend on Lake Erie actually needs.
Third, a quiet year is not the end of the pattern. The FWC HAB Monitoring Database holds records from 1953 to the present, and NOAA describes the 2017 to 2019 Florida event as unusually persistent precisely because most are not. Reading a clean summer as “red tide is over” is the mistake this page exists to prevent.
What the numbers mean, and why clear water proves nothing
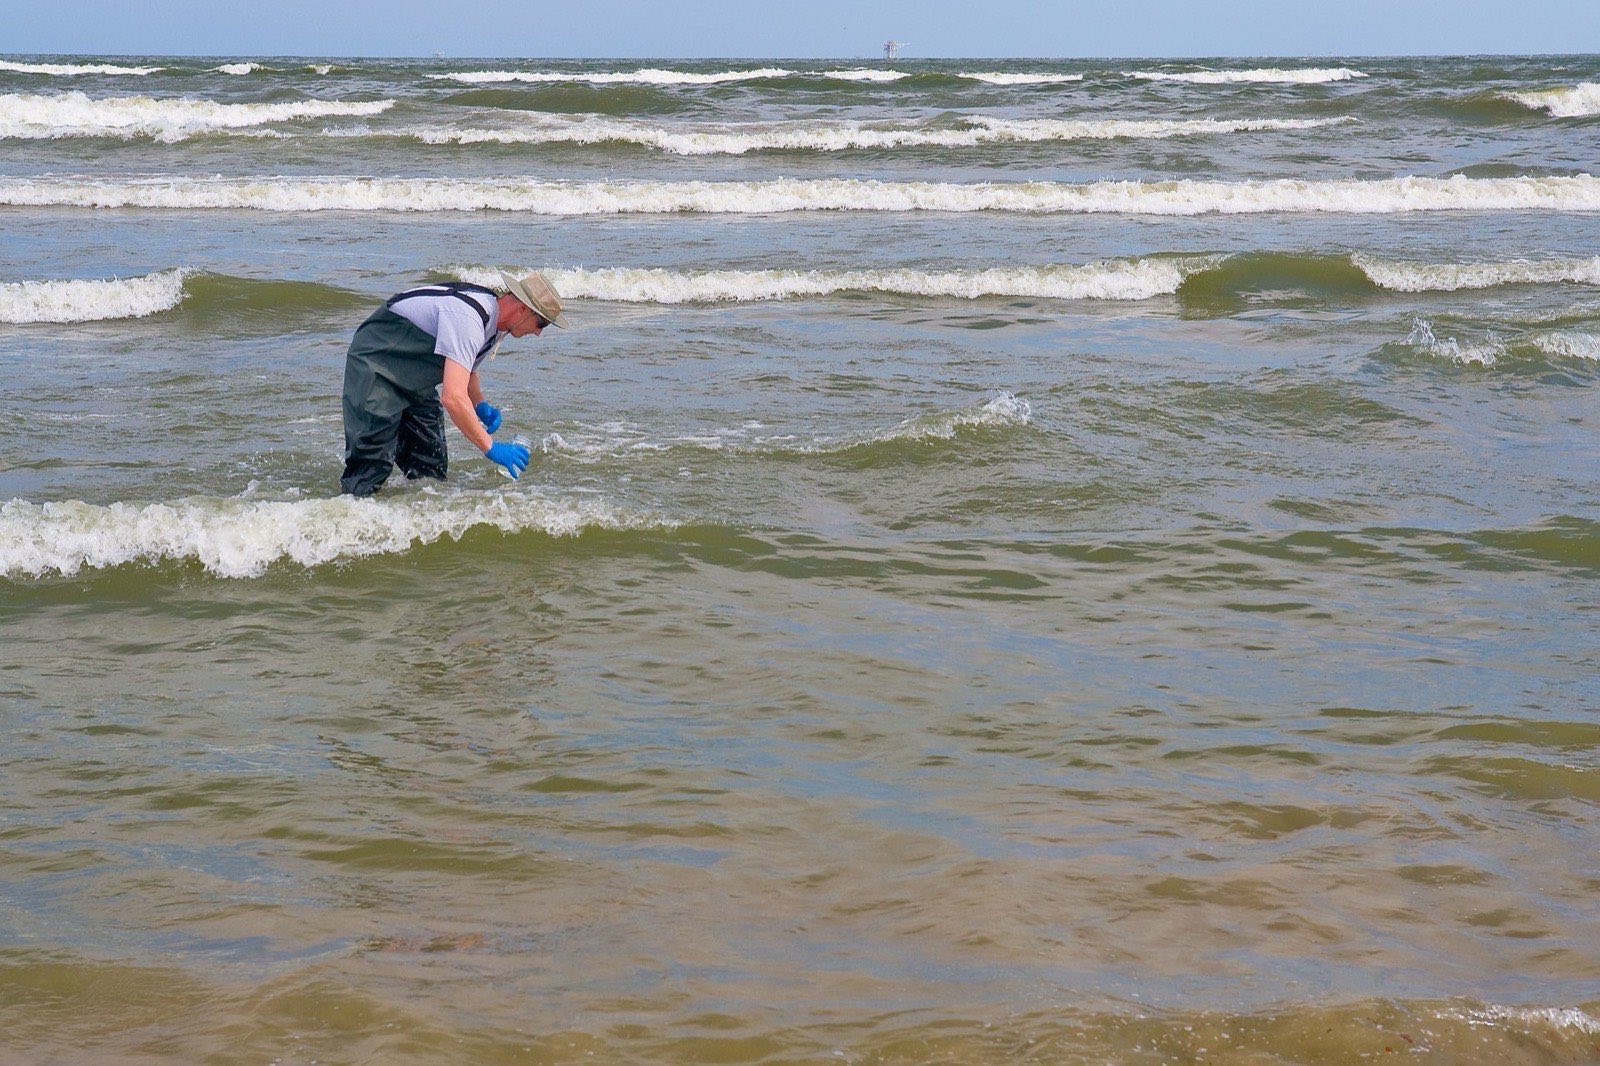
The counts are not linear and the effects are not proportional. FWC associates shellfish harvesting closures with counts from 5,000 cells per litre, inside its very low band, while visible water discoloration, the thing most people picture when they hear red tide, only appears in the top band at over a million. Water that looks completely ordinary can carry enough cells to close beds and make people cough.
| FWC category | Cells per litre | Effects, in FWC’s words |
|---|---|---|
| Not present or background | up to 1,000 cells per litre | no effects anticipated |
| Very low | more than 1,000 up to 10,000 cells per litre | possible respiratory irritation; shellfish harvesting closures when cell abundance equals or exceeds 5,000 cells per litre |
| Low | more than 10,000 up to 100,000 cells per litre | respiratory irritation; shellfish harvesting closures; possible fish kills; probable detection of chlorophyll by satellites at upper range |
| Medium | more than 100,000 up to 1,000,000 cells per litre | respiratory irritation; shellfish harvesting closures; probable fish kills; detection of surface chlorophyll by satellites |
| High | more than 1,000,000 cells per litre | respiratory irritation; shellfish harvesting closures; probable fish kills; detection of surface chlorophyll by satellites; water discoloration |
Quoted verbatim from the Florida Fish and Wildlife Conservation Commission red tide current status page, myfwc.com/research/redtide/statewide. Other states use their own scales; each state page names the one that applies there.
Lake Erie and the cyanobacteria season
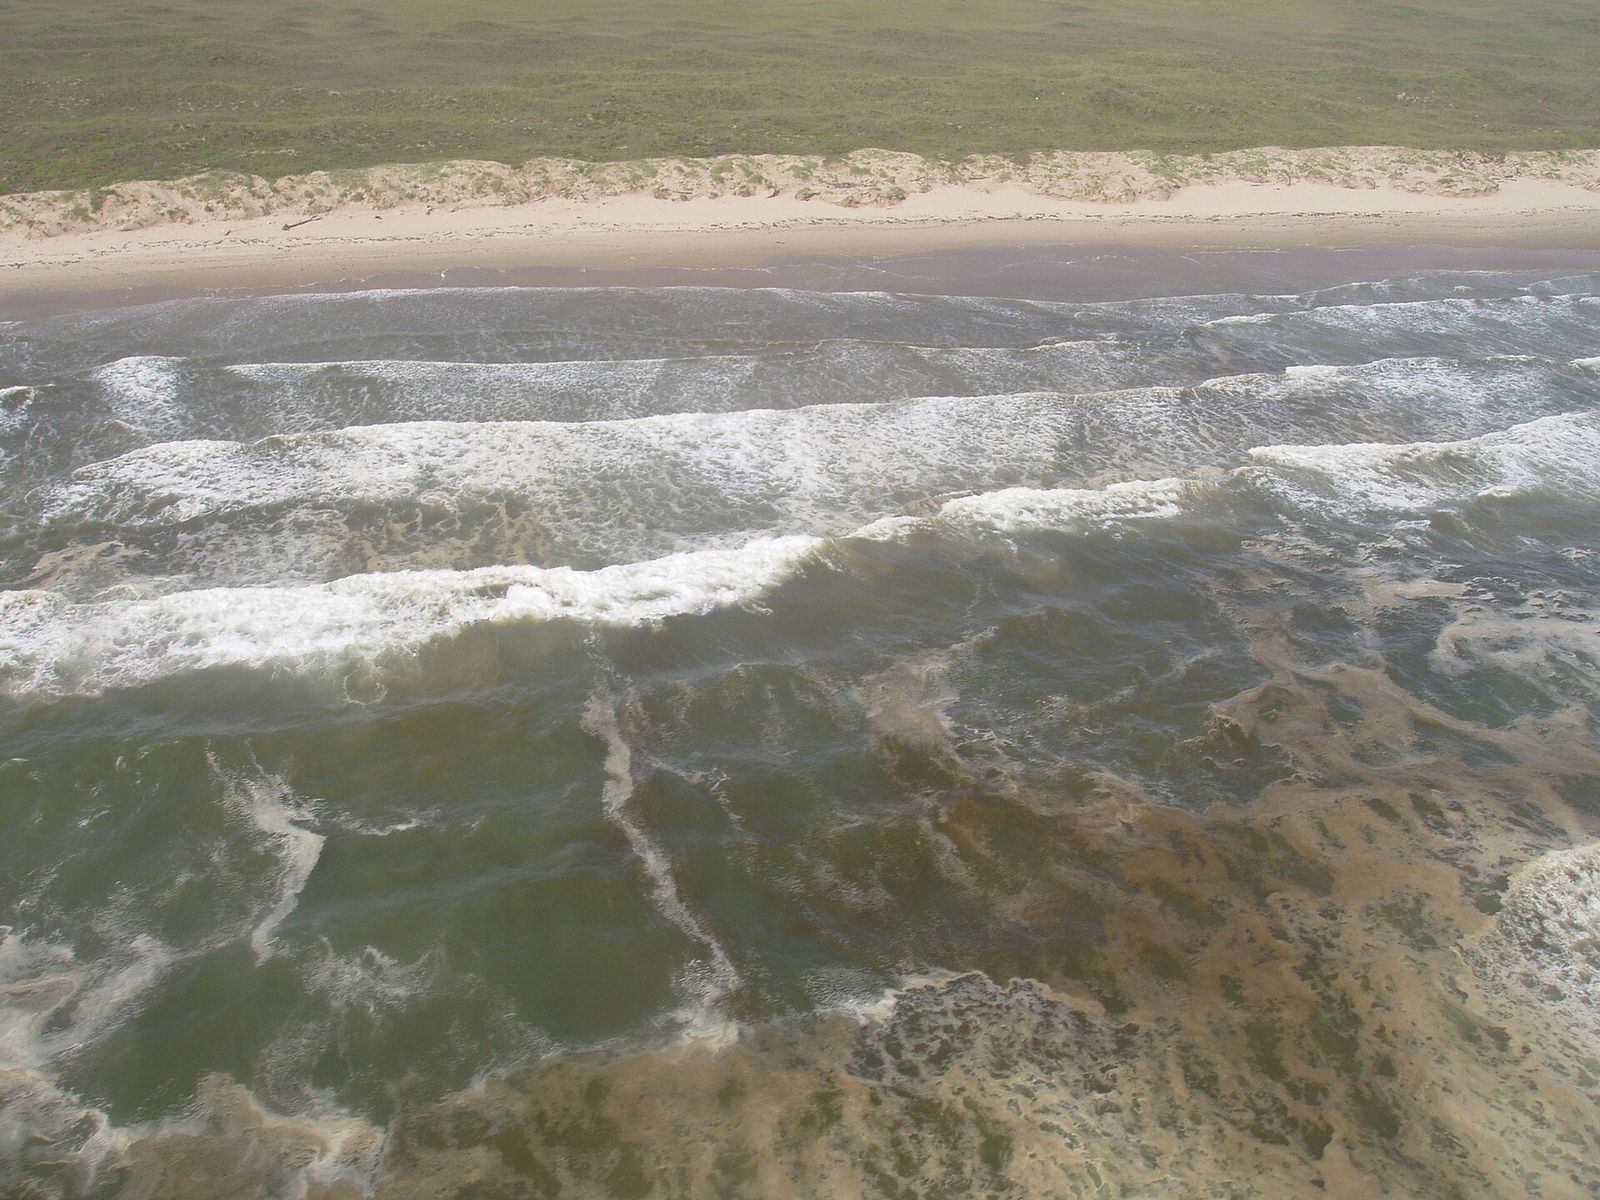
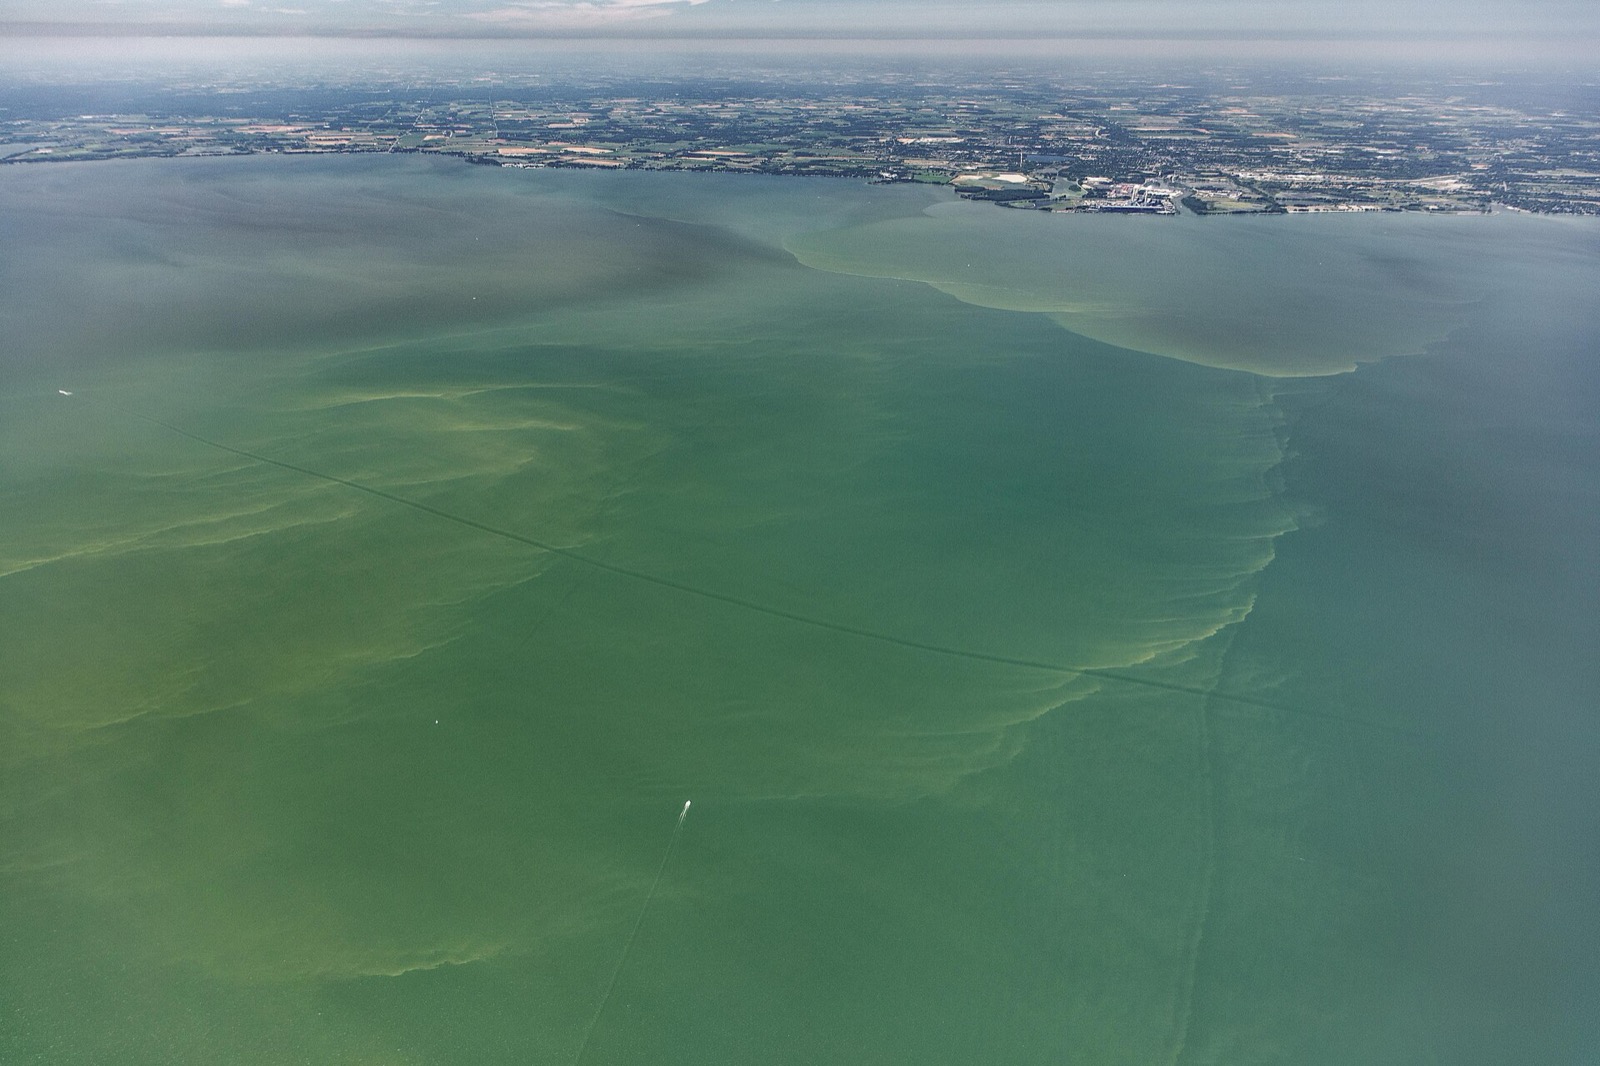
The other bloom Americans plan around is not a red tide at all. In the western basin of Lake Erie the organism is Microcystis, a cyanobacterium, and the toxin family is different from the brevetoxins that cause Florida’s respiratory irritation. NWS Cleveland states that NCCOS issues forecasts for Lake Erie after sampling confirms presence of the HAB species Microcystis, during bloom season, typically July to October.
NOAA runs four separate Lake Erie products: an early season projection from May through early July, a seasonal forecast in early July that estimates how severe the whole season is likely to be, a bloom forecast updated twice weekly from June through October giving current extent and a five day outlook, and a seasonal retrospective in November. NOAA describes the severity index behind the seasonal forecast as based on the quantity, or biomass, of the bloom over a sustained thirty day period, scaled to the minimum observed bloom biomass in 2005 and the maximum observed bloom biomass in 2011.
That seasonal forecast is the single most useful thing on these pages for anyone planning ahead, because it is issued before the season rather than during it. It is published as a bulletin rather than as a live feed, and NOAA posts each issue on its own page. NOAA Lake Erie harmful algal bloom forecast
Who to contact
Health questions, beach closures and anything to do with harvesting shellfish are answered by these agencies. Each state page lists the specific office for that state and its hotline.
NOAA National Centers for Coastal Ocean Science
Runs the operational harmful algal bloom forecasts for the Gulf of Mexico, Lake Erie, the Gulf of Maine and the Pacific Northwest, including the beach level respiratory irritation forecast reproduced on this page.
Gulf forecast run daily. Lake Erie bloom forecast twice weekly through the season, with a seasonal forecast in early July and a retrospective in November.
FWC Fish and Wildlife Research Institute
Runs the statewide Karenia brevis sampling programme in Florida and maintains the HAB Monitoring Database, which holds records from 1953 to the present.
Status report issued Fridays, sample map updated daily at 5 p.m. Eastern.
NOAA Great Lakes Environmental Research Laboratory
Publishes the Lake Erie harmful algal bloom bulletin and the early season projections that feed the seasonal severity forecast.
Your state health or agriculture department
Owns shellfish harvest closures and beach advisories. These are legal orders and they are the only answer that counts on whether harvesting is allowed. Each state page on this site lists the specific office and its hotline.
Red tide and algal bloom FAQ
Red tide status by state
More seasonal forecasts
Karenia brevis sample categories on this page are reproduced from the FWC-FWRI HAB Monitoring Database, read live in your browser and shown exactly as FWC published them. The beach respiratory irritation forecast is reproduced from the NOAA National Centers for Coastal Ocean Science station product, released by NOAA under CC0 1.0. Season windows are climatological typicals drawn from the agency quotations above, not forecasts. Whether a beach is open and whether shellfish can be harvested are answered by the state agencies named above. Rip currents and swim risk for the same beaches: live NWS beach conditions →
Hero image: “2018 Fort De Soto - South Beach” by Beyond My Ken, CC BY-SA 4.0