
Ice Dams: Where and When Roofs Are at Risk
An ice dam needs two things at once: snow sitting on the roof, and an eave cold enough that meltwater freezes when it gets there. No agency publishes how often that combination occurs, so these pages count it, day by day, from 30 winters of NOAA station records. Here is where it is routine, where it is not, and what the extension services say to do about it.
What an ice dam is, in the agency's words
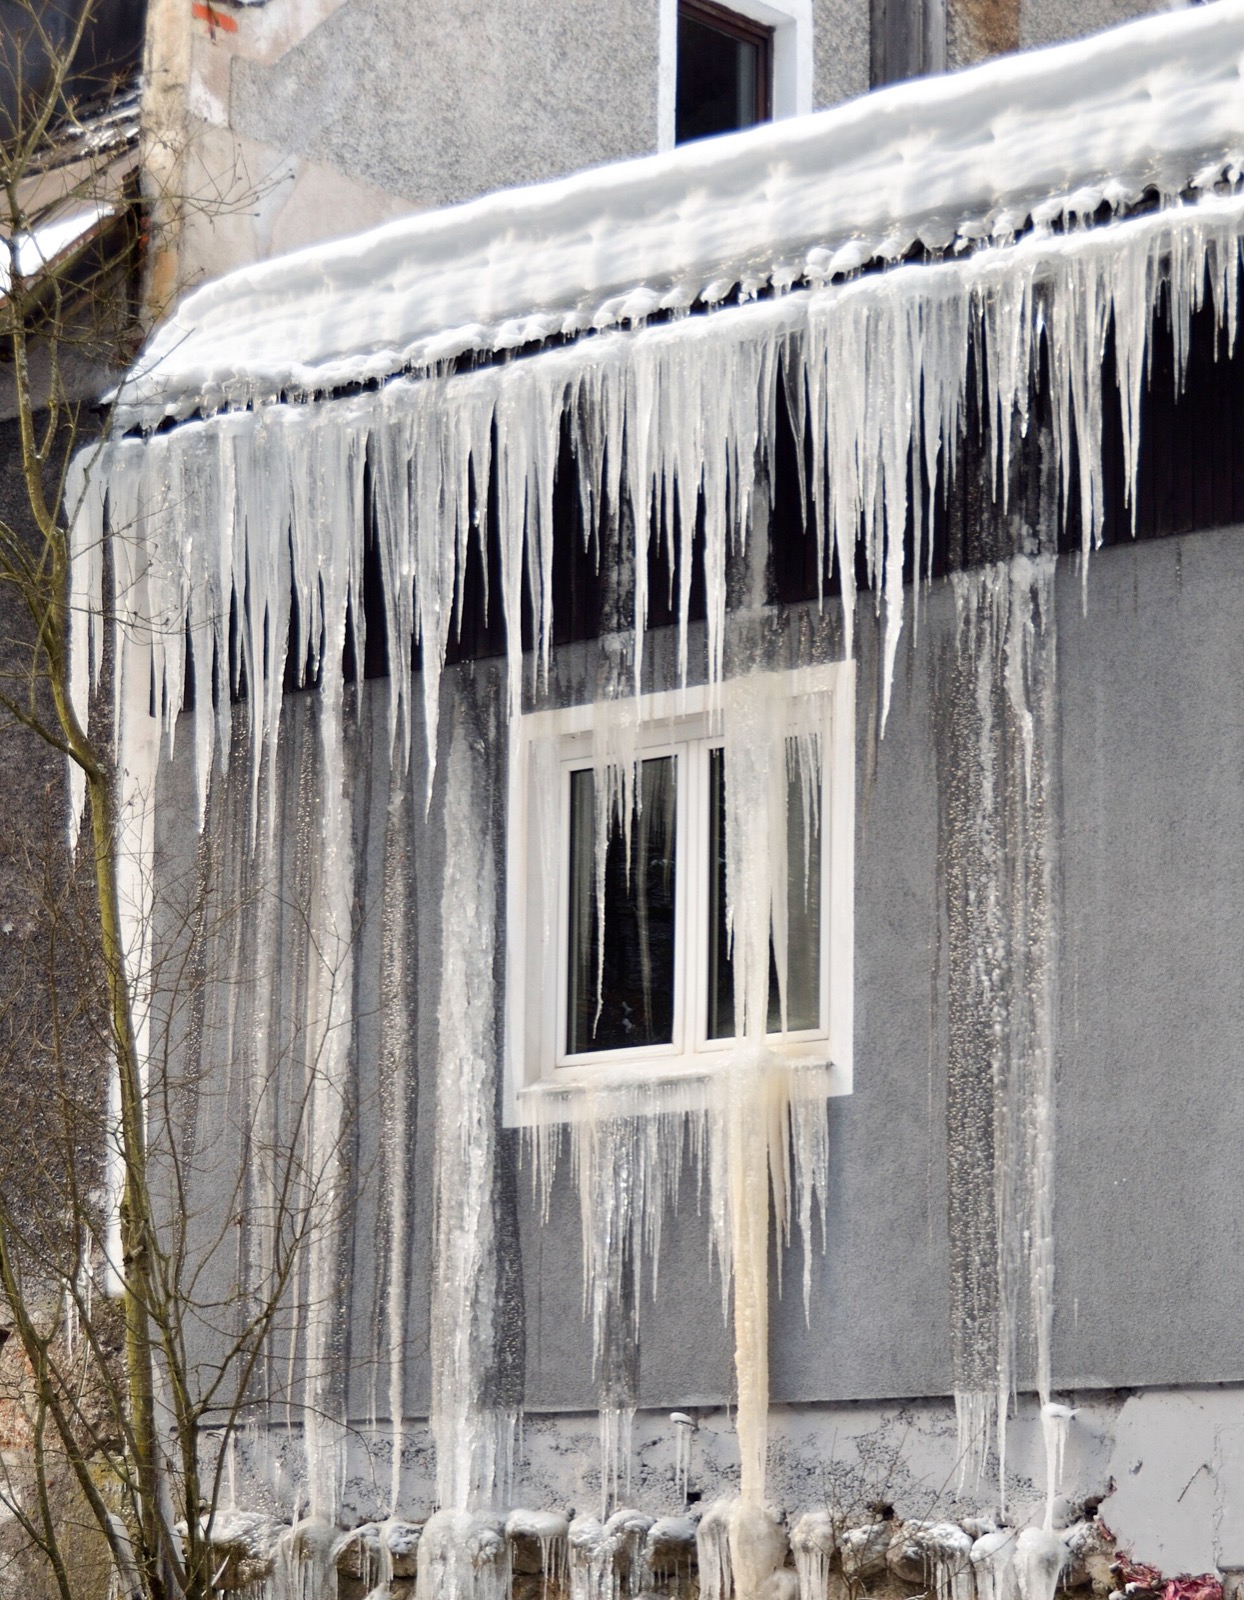
NDSU Extension, Check Your Roof for Ice Dams“Ice dams look like an ice ridge along the edge of the roof.”
The chain is short and it runs in one direction. Snow lands on the roof. Heat escaping through the ceiling warms the deck underneath and melts the snow from below. The meltwater runs downhill to the eave, which hangs outside the heated part of the building and stays at outdoor temperature, and it freezes there. The ridge grows, the next meltwater pools behind it, and roofing that was designed to shed water travelling downhill fails at standing water instead.
University of Minnesota Extension sets the condition out in three parts that have to hold at once. Snow has to be lying on the roof. The upper part of the roof surface has to be running above freezing while the lower part runs below it. And because an overhanging eave is only ever as cold as the air around it, the outdoor air has to be below freezing as well. It stresses that these are sustained averages rather than a passing hour, which is exactly why a single cold night does not build a dam and a cold fortnight does.
Its account of what follows is a simple sequence. Snow lying on the warm section melts. The meltwater runs down the slope until it reaches the part of the roof that is below freezing, and stops there as ice. The ridge grows from above as more snow melts, but it can only extend as far up the roof as the freezing line, so the water pooling behind it stays liquid, finds gaps in the roof covering, and enters the attic. From there the extension service traces it into exterior walls and through ceiling insulation to the finish below.
Our summary, not a quotation. Source: University of Minnesota Extension, Dealing with and preventing ice dams
Two of the three ingredients are weather: snow lying on the roof, and outside air cold enough to keep the eave frozen. The third, the warm upper roof, is supplied by the building. These pages count the weather half; the attic is the part only a look at the building can settle.
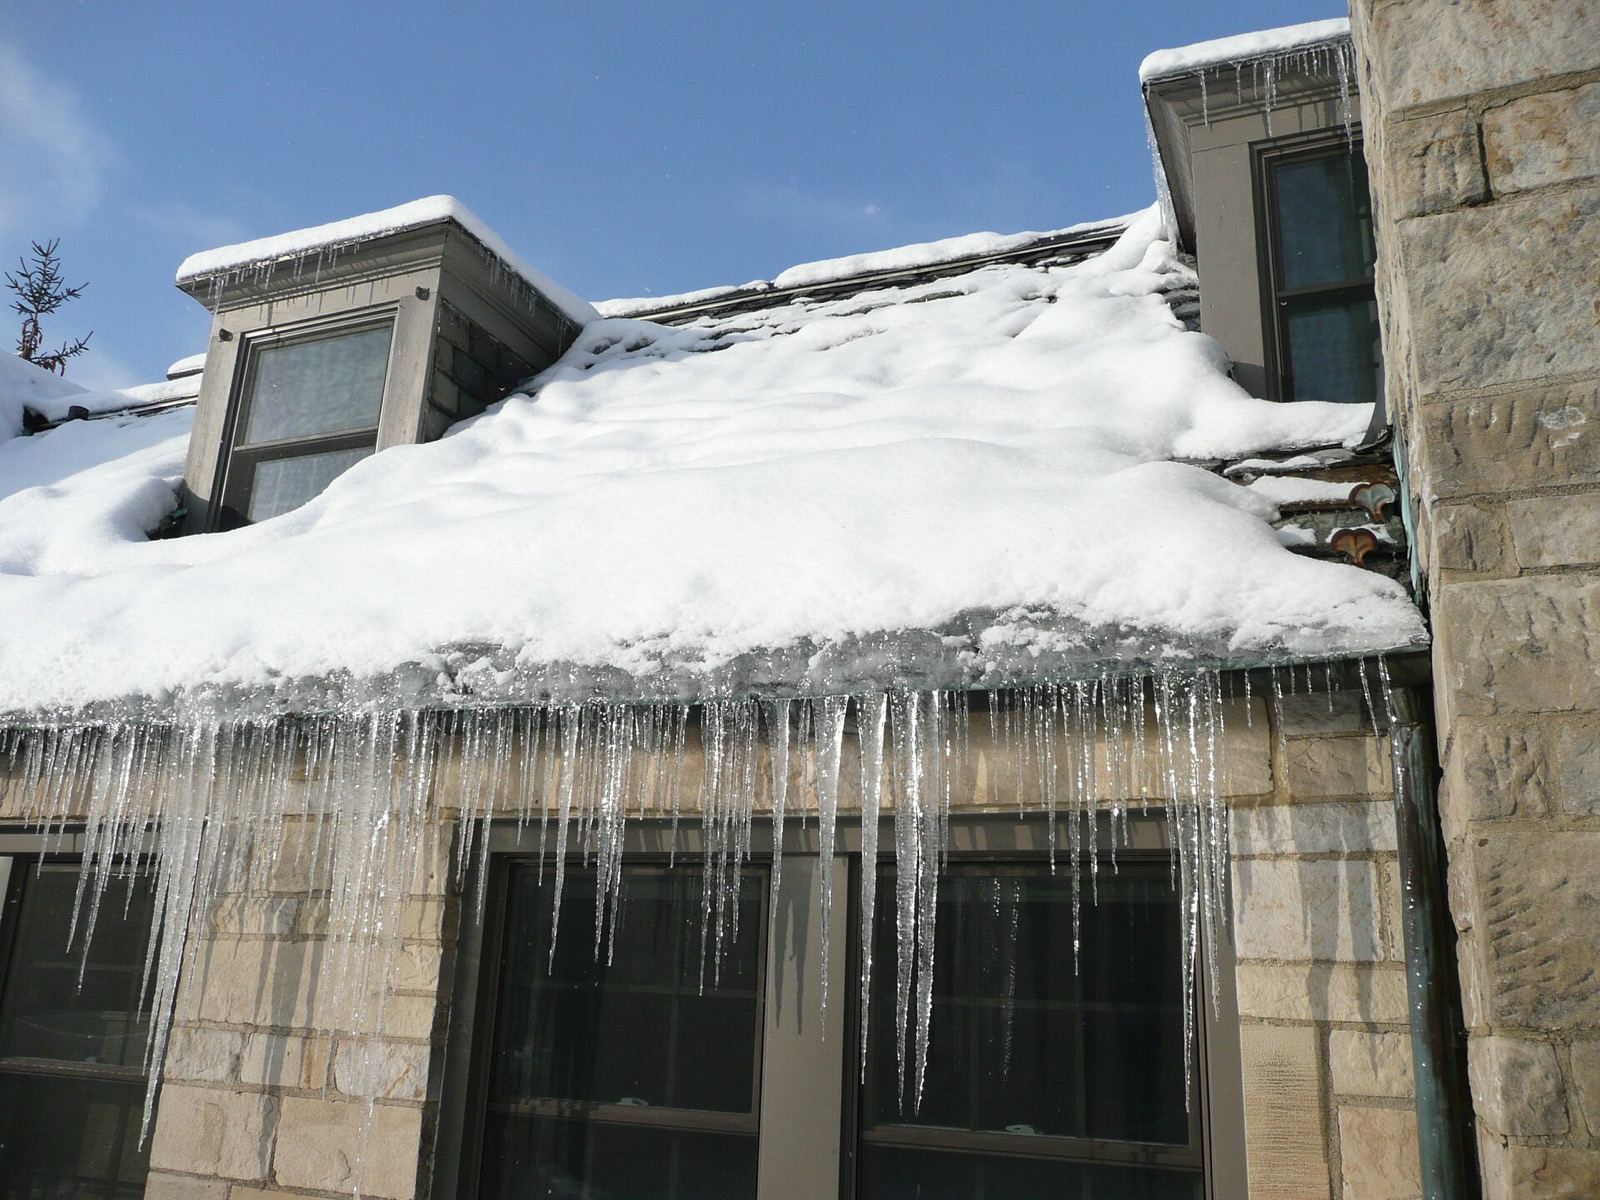
How often the setup shows up, state by state
A setup day is one day at one station with an inch or more of snow on the ground and a high temperature at or below 32 F. A spell is three or more of them in a row, which is what actually builds a dam. Each state is listed by its hardest rated station, with its mildest one beside it, because the spread inside a state is usually larger than the spread between states.
| State | Hardest station | Setup days | Typical longest spell | Peak | Mildest rated station |
|---|---|---|---|---|---|
| Alaska | Fairbanks | 151.2 | 69 d | December | Juneau (27.2) |
| Minnesota | International Falls | 97.9 | 36 d | January | Minneapolis (57.7) |
| Maine | Caribou | 83.7 | 23 d | January | Portland (30.9) |
| Michigan | Sault Ste. Marie | 80.4 | 23 d | January | Detroit (27.6) |
| North Dakota | Fargo | 79.9 | 28 d | January | Bismarck (62.1) |
| Wisconsin | Wausau | 70.5 | 20 d | January | Milwaukee (34.5) |
| New York | Lake Placid | 65.3 | 16 d | January | New York City (7.7) |
| Colorado | Steamboat Springs | 59.3 | 12 d | January | Grand Junction (11.9) |
| New Hampshire | Berlin | 58.9 | 15 d | January | Concord (35.2) |
| South Dakota | Aberdeen | 58.4 | 17 d | January | Sioux Falls (48.8) |
| Vermont | St. Johnsbury | 51.9 | 14 d | January | Burlington (48.3) |
| Connecticut | Norfolk | 48.5 | 11 d | January | Bridgeport (11.1) |
| Idaho | McCall | 47.3 | 11 d | December | Boise (7.6) |
| Iowa | Decorah | 45.5 | 15 d | January | Des Moines (31.6) |
| Montana | Bozeman | 37.2 | 9 d | December | Missoula (30.2) |
| Utah | Logan | 36.8 | 10 d | January | St. George (0) |
| Pennsylvania | Erie | 35.1 | 8 d | January | Philadelphia (5.5) |
| Ohio | Youngstown | 34 | 8 d | January | Columbus (15.7) |
| Illinois | Chicago | 27.1 | 9 d | January | Springfield (16.1) |
| Massachusetts | Blue Hill | 24.6 | 6 d | January | Amherst (21.2) |
| Nebraska | Omaha | 24.3 | 7 d | January | North Platte (17.5) |
| Rhode Island | Foster | 24 | 6 d | January | Kingston (7.7) |
| Indiana | Fort Wayne | 23.5 | 9 d | January | Evansville (4.6) |
| Washington | Spokane | 22.3 | 8 d | January | Yakima (11.6) |
| Wyoming | Cheyenne | 20.3 | 5 d | December | Only one station rated |
| Nevada | Elko | 20.1 | 7 d | January | Las Vegas (0) |
| West Virginia | Elkins | 19.5 | 4 d | January | Charleston (9) |
| California | Tahoe City | 12.3 | 4 d | February | Fresno (0) |
| Arizona | Flagstaff | 10.1 | 3 d | December | Tucson (0) |
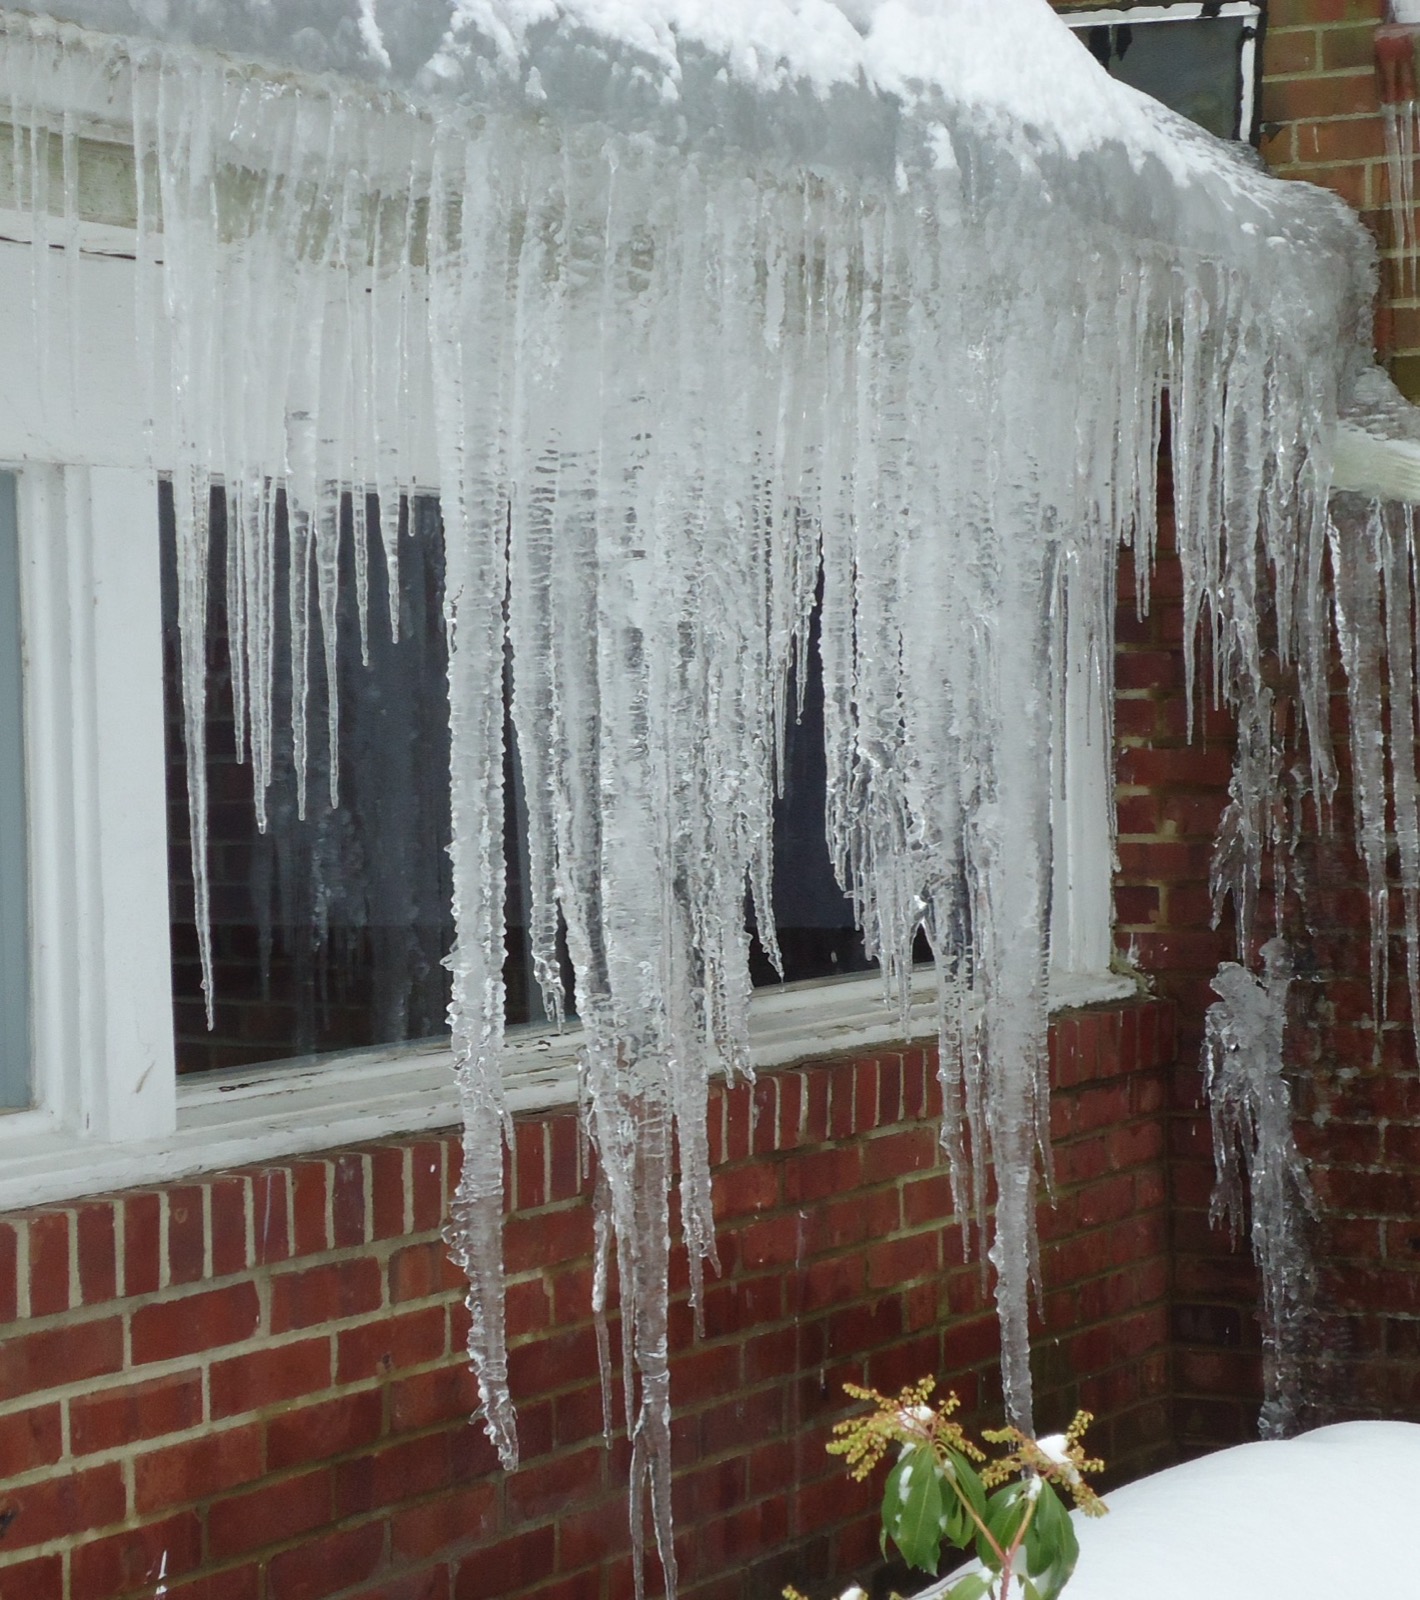
Where the setup is rare, or the record is thin
A state has a page when its best completely reporting station clears a uniform rule: at least 30 days a winter with an inch or more of snow on the ground, plus either 15 setup days or 30 melt and refreeze days a winter, plus a spell of three or more setup days in at least 70 percent of winters. Below is every other state, with its number.
Two different situations appear in this table. Most states here do not get the weather. A few get it in their snow country, but the stations there stopped reporting snow depth, so the rating rests on the stations that do report; the notes say which.
| State | Best rated station | What the record shows |
|---|---|---|
| Alabama | Huntsville (0.2 setup d) | Snow rarely stays on the ground: Huntsville averages 1.4 days a winter with an inch or more, below the 30 day floor. |
| Arkansas | Little Rock (0.9 setup d) | Snow rarely stays on the ground: Little Rock averages 2.9 days a winter with an inch or more, below the 30 day floor. |
| Delaware | Wilmington (5.4 setup d) | Snow rarely stays on the ground: Wilmington averages 15.2 days a winter with an inch or more, below the 30 day floor. |
| Florida | None | No station reports snow depth and temperature completely enough to rate: Tallahassee (5), Orlando (10), Miami (10) of 30 winters. No Florida station reports snow depth and winter temperature completely enough to rate, and snow on the ground is itself a rarity there. |
| Georgia | Atlanta (0.2 setup d) | Snow rarely stays on the ground: Atlanta averages 1.1 days a winter with an inch or more, below the 30 day floor. |
| Hawaii | None | No NOAA reference station in the snapshot. Hawaii has no station in the NOAA daily snow network at all. Summit snow above 13,000 feet is real; roofs under it are not. |
| Kansas | Goodland (12.4 setup d) | Snow rarely stays on the ground: Goodland averages 27.4 days a winter with an inch or more, below the 30 day floor. |
| Kentucky | Jackson (8.6 setup d) | Snow rarely stays on the ground: Jackson averages 17.1 days a winter with an inch or more, below the 30 day floor. |
| Louisiana | Shreveport (0.2 setup d) | Snow rarely stays on the ground: Shreveport averages 0.6 days a winter with an inch or more, below the 30 day floor. |
| Maryland | Hagerstown (10.1 setup d) | Snow rarely stays on the ground: Hagerstown averages 29.6 days a winter with an inch or more, below the 30 day floor. Garrett County in the far west is genuine snow country, but the Oakland station reports completely in only 10 of 30 winters, so the state is rated on Hagerstown and Baltimore. |
| Mississippi | Tupelo (0.5 setup d) | Snow rarely stays on the ground: Tupelo averages 1.3 days a winter with an inch or more, below the 30 day floor. |
| Missouri | Kansas City (11.8 setup d) | Snow rarely stays on the ground: Kansas City averages 20.5 days a winter with an inch or more, below the 30 day floor. |
| New Jersey | Trenton (8.3 setup d) | Snow rarely stays on the ground: Trenton averages 25.6 days a winter with an inch or more, below the 30 day floor. The northwest Highlands would likely qualify. The Sussex station falls two winters short of the reporting gate, so New Jersey is rated on Trenton and Newark. |
| New Mexico | Albuquerque (0.8 setup d) | Snow rarely stays on the ground: Albuquerque averages 3.3 days a winter with an inch or more, below the 30 day floor. |
| North Carolina | Asheville (2.2 setup d) | Snow rarely stays on the ground: Asheville averages 7.1 days a winter with an inch or more, below the 30 day floor. |
| Oklahoma | Tulsa (2.3 setup d) | Snow rarely stays on the ground: Tulsa averages 5.7 days a winter with an inch or more, below the 30 day floor. |
| Oregon | Portland (0.9 setup d) | Snow rarely stays on the ground: Portland averages 2.9 days a winter with an inch or more, below the 30 day floor. Oregon almost certainly has ice dam country east of the Cascades, but Bend, Baker City, Klamath Falls and La Grande all fall short of the snow depth reporting gate, so the state is rated on Portland and Medford, the two stations that pass. |
| South Carolina | Greenville (0.3 setup d) | Snow rarely stays on the ground: Greenville averages 2.4 days a winter with an inch or more, below the 30 day floor. |
| Tennessee | Gatlinburg (2.6 setup d) | Snow rarely stays on the ground: Gatlinburg averages 7.7 days a winter with an inch or more, below the 30 day floor. |
| Texas | Amarillo (3.8 setup d) | Snow rarely stays on the ground: Amarillo averages 10.1 days a winter with an inch or more, below the 30 day floor. |
| Virginia | Roanoke (2.3 setup d) | Snow rarely stays on the ground: Roanoke averages 10.7 days a winter with an inch or more, below the 30 day floor. |
Cold that never lets go, and sun that melts by day
The classic case is the northern one: snow on the roof and a high that never reaches freezing for days on end, so nothing the house melts ever drains away. Alaska is the extreme of it, with Fairbanks averaging 151.2 such days a winter and a typical longest unbroken run of 69 days.
The mountain West runs the other version. Deep snow sits on the roof, the afternoon climbs above freezing under bright sun, and the night takes it straight back down. The melting is solar rather than attic-driven, and the refreezing happens after dark, but the dam at the eave is the same object. 12 of the states we rate lean that way, including Colorado, Vermont, Idaho.
Both routes need snow that stays put, which is why the rule above starts with days of snow on the ground rather than with snowfall totals. A place can get four feet of snow a winter and never build a dam if it all melts between storms.
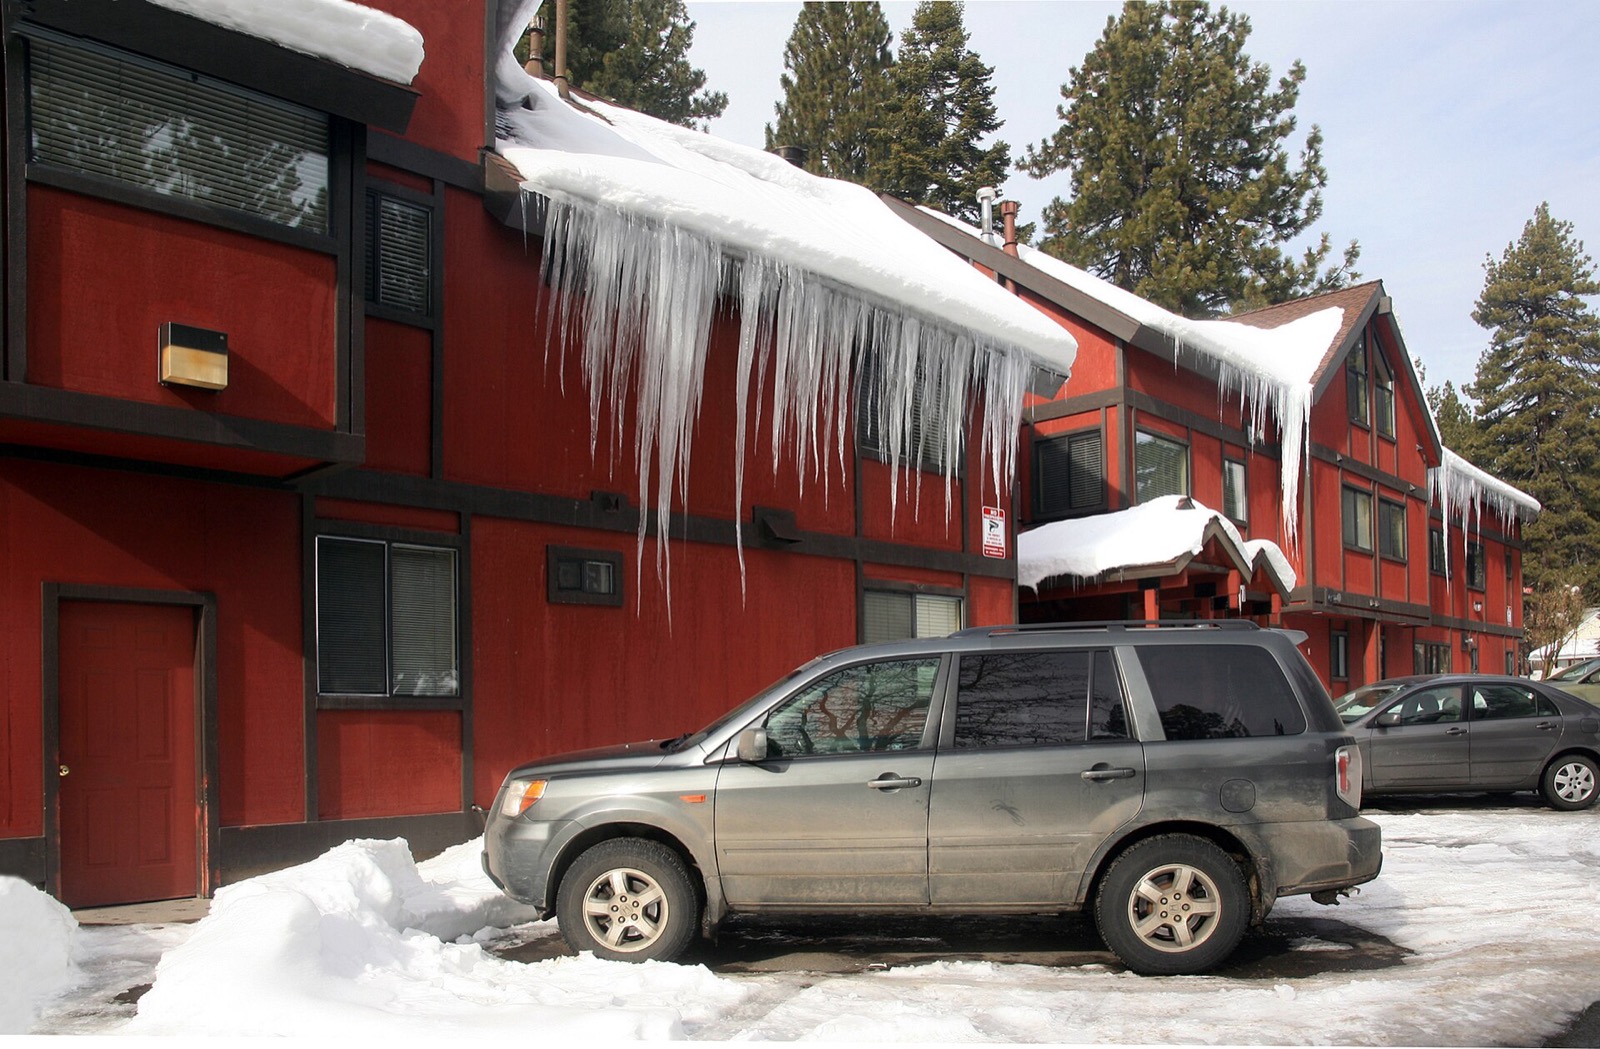
A building problem, revealed by weather
Everything above is climatology, and climatology is only half of it. The half that decides which roof on the street ices over is not in any weather dataset. The agencies say so directly, and they are quoted here.
NDSU Extension, Check Your Roof for Ice Dams“Ice dams occur when escaping heat melts the snow on the roof and the water freezes when it reaches the cooler surface near the eaves.”
“They indicate that your house is leaking heat and does not have adequate attic ventilation.”
On where the warmth comes from, the extension service is unambiguous: it is heat leaving the house that makes the roof surface uneven in temperature, with sunshine an occasional rather than a usual cause. It breaks the path into conduction through the ceiling, convection and radiation off the top of the insulation, and air leaking through ceiling penetrations, and identifies that last one as the biggest contributor in many houses.
Our summary, not a quotation. Source: University of Minnesota Extension, Dealing with and preventing ice dams
The published order of operations is the same everywhere it appears: stop the air leaks first, then add insulation, and hire the trade that measures it rather than guessing.
NDSU Extension, Check Your Roof for Ice Dams“The best way to reduce the potential for ice dams is by providing adequate attic insulation and ventilation that keep the roof cold and to minimize any air leaks from the living space into the attic.”
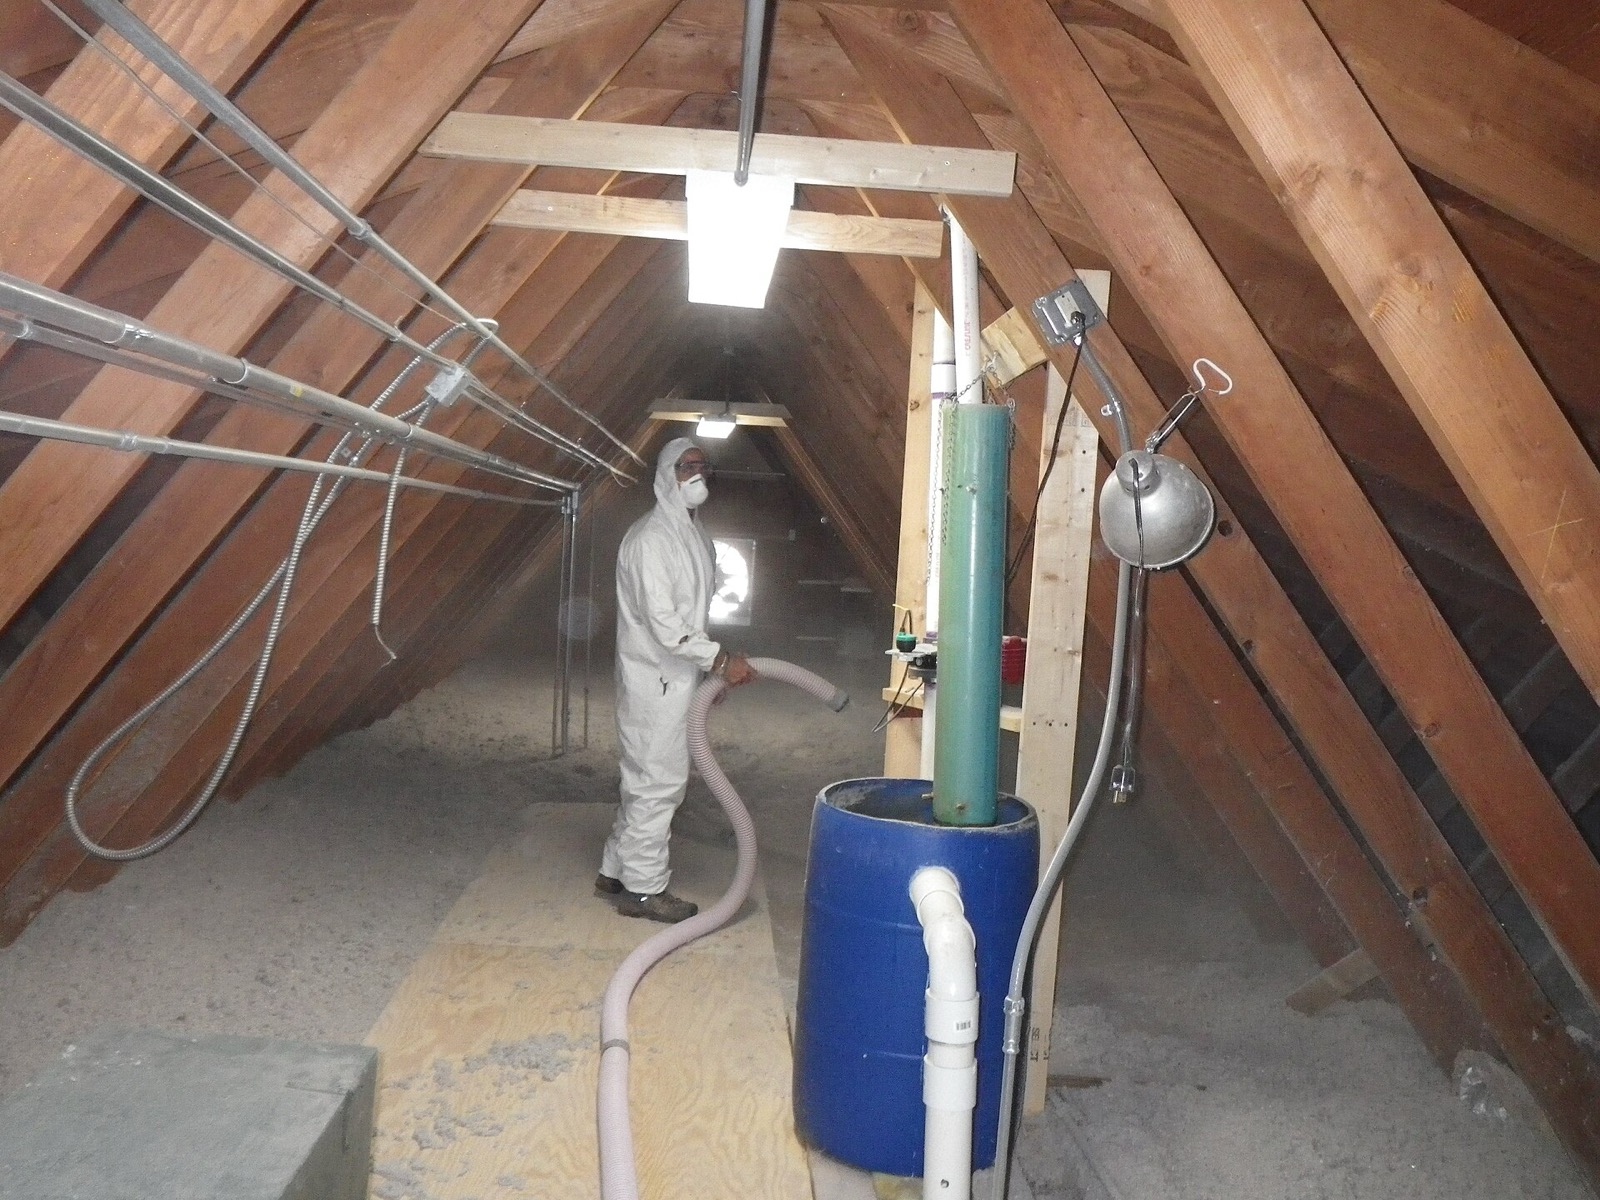
Its long-term remedy is an order of operations, and the order is the point. Seal the ceiling first so warm, moist indoor air cannot get into the attic at all. Only then add insulation depth to cut the heat that still conducts through. Doing the second without the first leaves the leaks running underneath the new insulation.
It also names the trade and the test. The work belongs to weatherization contractors, whose job is precisely the heat-transfer problem underneath an ice dam, and the extension service says the contractor you hire should be running a blower door test to measure how airtight the ceiling really is, often alongside an infrared camera to find where the heat is escaping.
Our summary, not a quotation. Source: University of Minnesota Extension, Dealing with and preventing ice dams
And the free diagnostic, which needs nothing but a look from the driveway the morning after a snow:
NDSU Extension, Check Your Roof for Ice Dams“The snow on your house should look like it does on an unheated, detached garage -with only a little melt around the edges. You do not want bare spots. That means there is warm air leaking from the living area that warms the roof, triggering an ice-dam.”
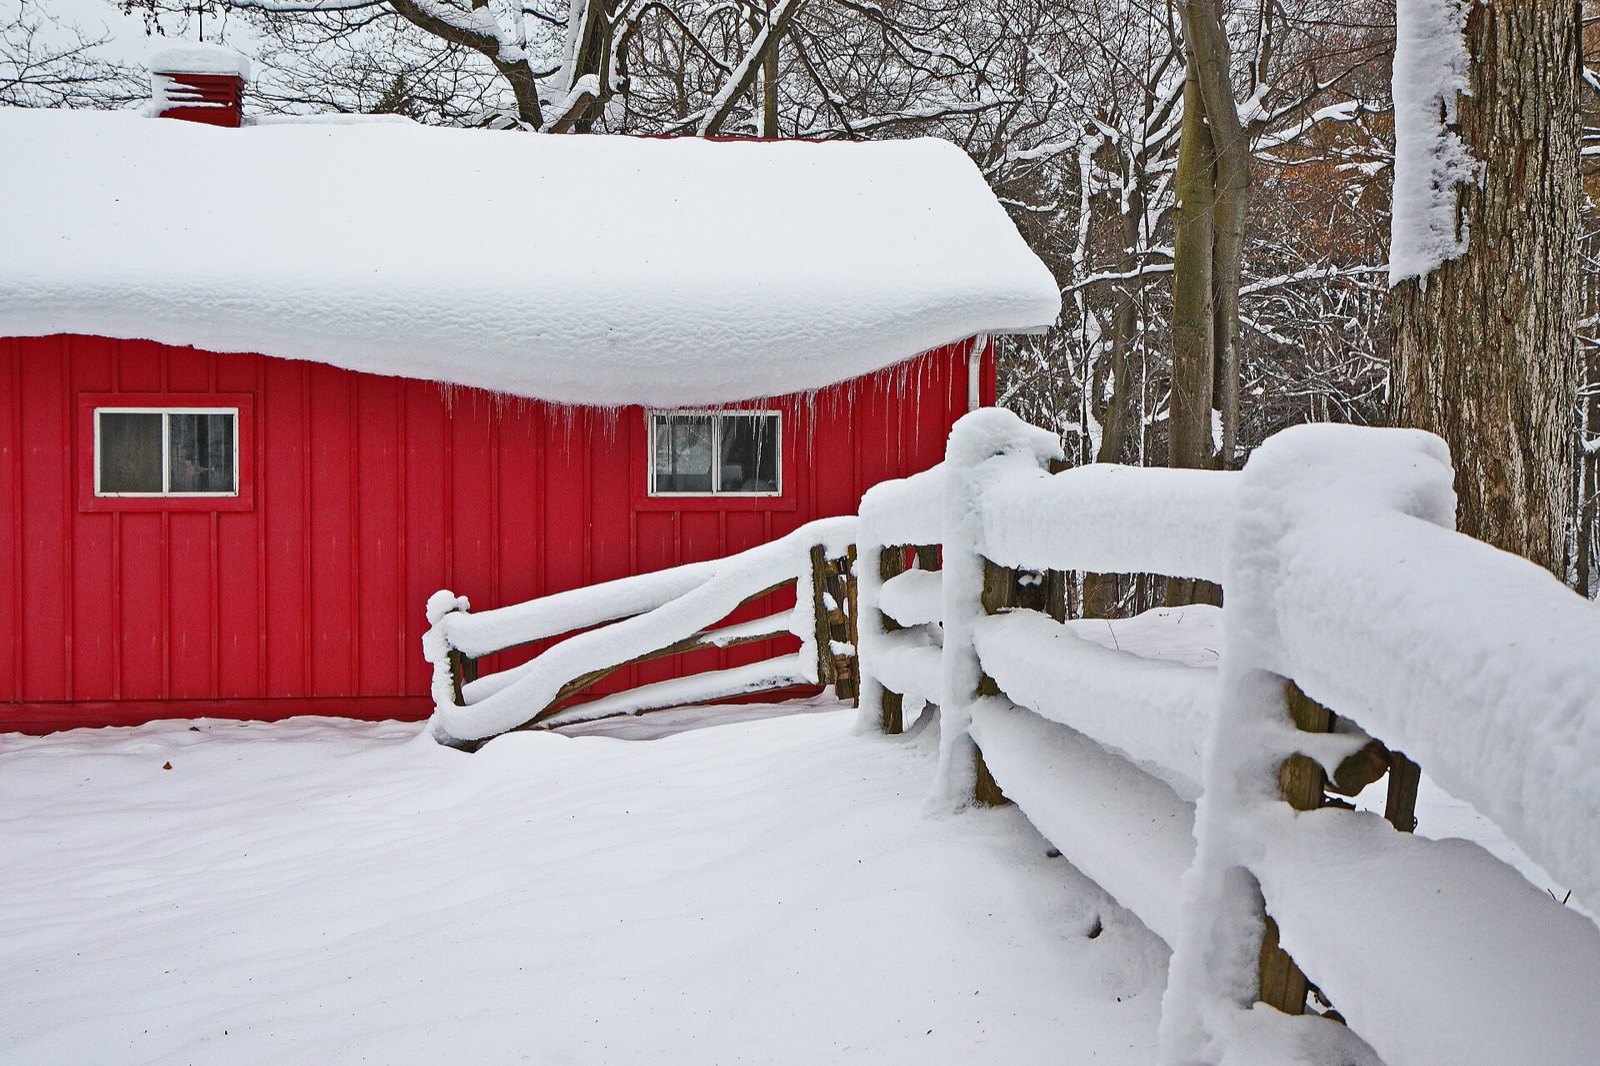
Removal is the part that hurts people
Occupational Safety and Health Administration, Winter Weather: Hazards and Precautions“Employers can protect workers from these hazardous work conditions, for example, by using snow removal methods that do not involve workers going on roofs, when and where possible.”
“Snow covered rooftops can hide hazards such as skylights that workers can fall through.”
“Electrical hazards may also exist from overhead power lines or snow removal equipment.”
“A surface that is weighed down by snow must be inspected by a competent person to determine if it is structurally safe for workers to access it, because it may be at risk of collapsing.”
“Employers should determine the right type of equipment (ladders, aerial lifts, etc.) and personal protective equipment (personal fall arrest systems, non-slip safety boots, etc.) for the job and ensure that workers are trained on how to properly use them.”
There is also a counterintuitive consequence worth knowing before anyone succeeds at any of this. A roof that stops melting its own snow keeps that snow:
And it flags a consequence people do not expect. Fixing the heat loss means the snow stops melting, so the roof ends up carrying more weight through the winter, not less. Its own note is that a house built to current code should be designed for the snow load it will see, and that an engineer is the right person to answer the question for an older one.
On clearing snow from the ground, its caution is about the roof rather than about the ice: a roof rake or push broom will take snow off, and can take shingles and roofing with it.
Our summary, not a quotation. Source: University of Minnesota Extension, Dealing with and preventing ice dams
It ends as a moisture problem, not an ice one
NDSU Extension, Check Your Roof for Ice Dams“It's important to look for these spots because water behind the ice may enter the house causing insulation to be ineffective, leading to the rotting of structural wood, staining wall coverings and creating conditions conducive for mold growth.”
It also links the water directly to indoor air quality, noting that moisture arriving this way can lead to mold and mildew growth, that those can bring on respiratory problems, and that the response is to dry the wet parts of the house immediately rather than waiting for spring.
Our summary, not a quotation. Source: University of Minnesota Extension, Dealing with and preventing ice dams
EPA is the federal authority on indoor mold, and the operative sentence in its homeowner guide is six words long:
US Environmental Protection Agency, A Brief Guide to Mold, Moisture and Your Home“The key to mold control is moisture control.”
“It is important to dry water-damaged areas and items within 24-48 hours to prevent mold growth.”
Ice dam FAQ
The rest of the cold season
The snow that starts all of this has its own calendar: the first snow dates pages give the median arrival for every state. Whether the season ahead leans cold or mild is the winter outlook. The machine that buries the Great Lakes snowbelts in particular is lake effect snow, and what is on the ground right now is on the live snow depth map.
Setup days, spells and melt-refreeze days are our derivation from NOAA NCEI GHCN-Daily station observations over 1991-2020; no agency publishes an ice dam climatology and the National Weather Service issues no ice dam product. All guidance quoted above belongs to the named agency and links to its source.