
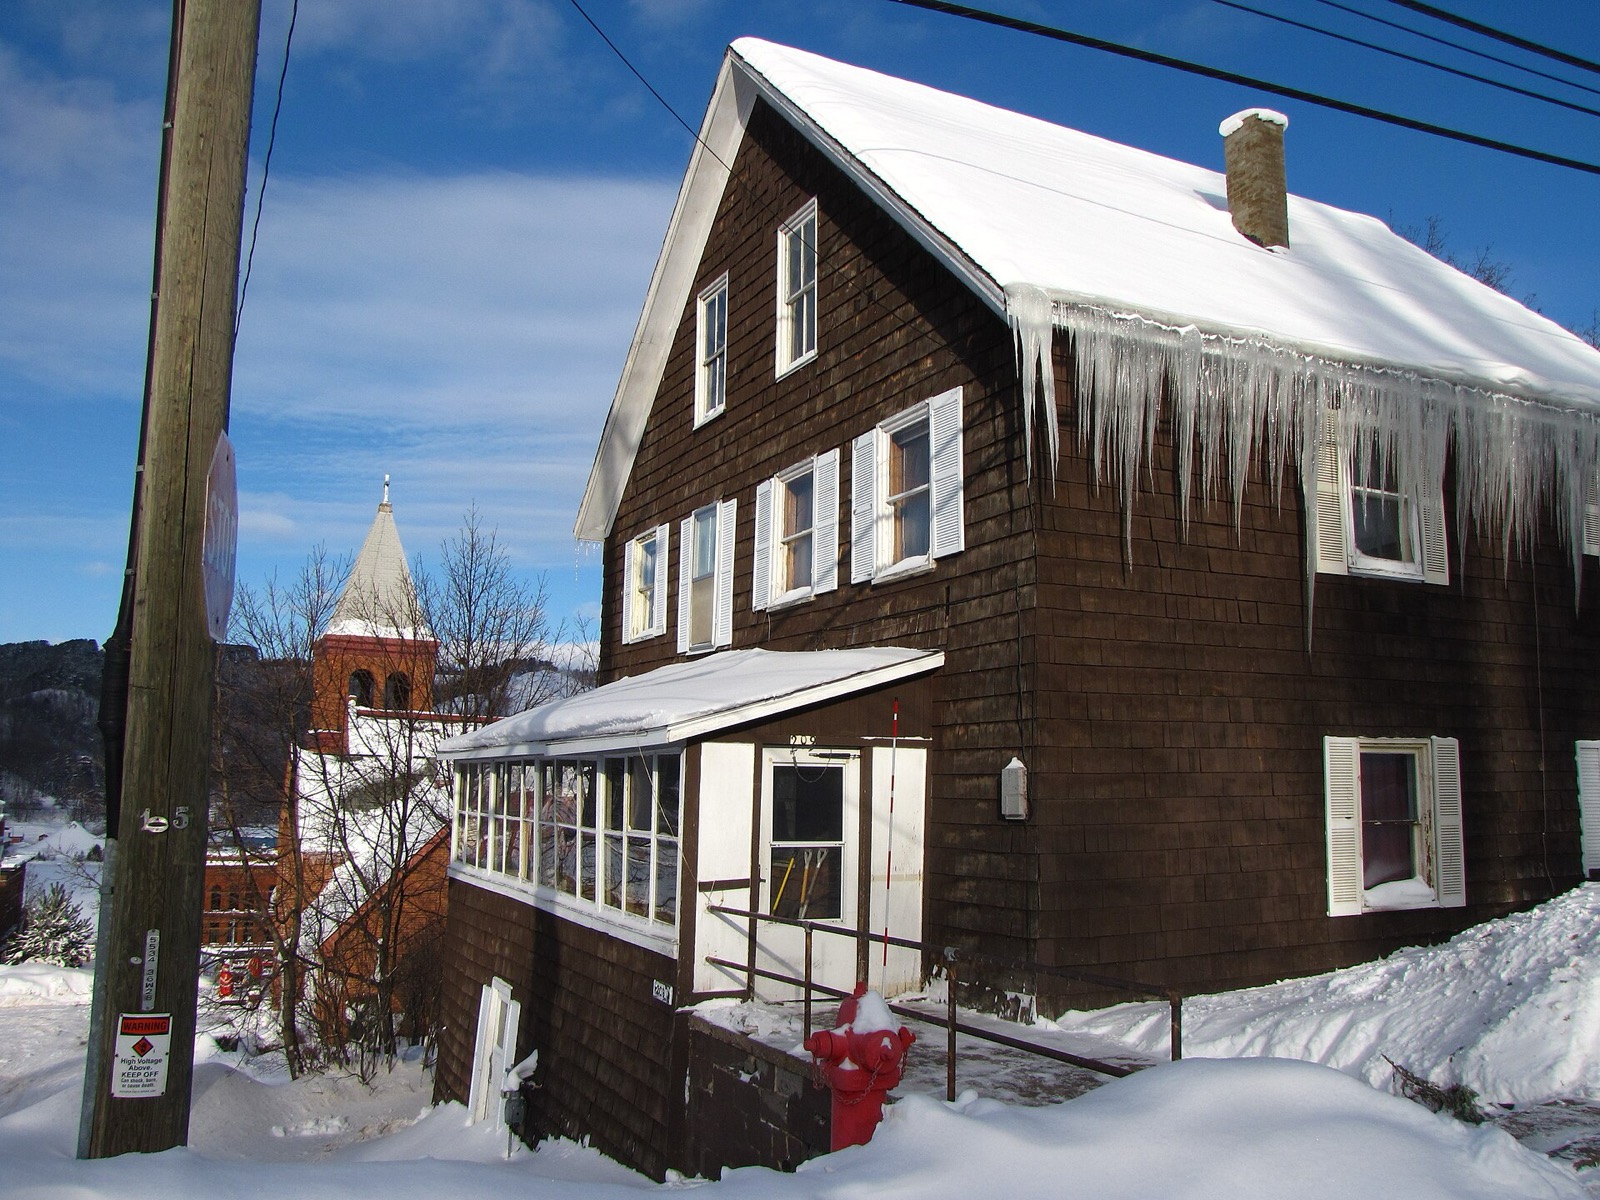
Frozen Pipes: How Cold It Gets, and For How Long
How often the air drops to 20 F where you live, how long those cold stretches run, and how many days never rise above freezing, for 49 states. Thirty winters of NOAA station records, plus live National Weather Service cold products read the moment you open the page.
Hard freeze counts from 30 winters of NOAA records, plus live National Weather Service cold productsActive National Weather Service cold products
Read live from api.weather.gov when this page loads, and shown exactly as the issuing office wrote it. The five current cold products are Extreme Cold Warning, Extreme Cold Watch, Cold Weather Advisory, Freeze Warning and Freeze Watch. The names Wind Chill Warning, Wind Chill Watch, Wind Chill Advisory, Hard Freeze Warning and Hard Freeze Watch were all retired on 1 October 2024, so anything still using them is out of date.
Checking api.weather.gov for active cold products.
Product text, issuing office, area and times are passed through exactly as the National Weather Service issued them. The five products queried here are the current ones: Extreme Cold Warning, Extreme Cold Watch, Cold Weather Advisory, Freeze Warning, Freeze Watch. Read . Source: api.weather.gov
A 20 degree night is a bigger problem in Houston than in Fargo
The evidence for that claim comes in three parts.
What the weather record shows. The exposure gradient is enormous and it is not close. Fargo, North Dakota averages 108 nights a year at or below 20 F. Las Vegas, Nevada averages 0, and gets there at all in 3 percent of winters. A place that gets a hard freeze every single winter builds, insulates and maintains for one as a matter of routine. A place that gets one twice in a lifetime does not, and its plumbing runs through attics, exterior walls and vented crawlspaces because the air outside is normally warm.
What no public record shows. Whether more pipes actually burst: there is no national register of burst pipes at FEMA, NOAA or any federal agency, and insurance carriers hold that data. These pages count the weather, and any ranking of states by burst pipes is a ranking of somebody's estimate.
What the published research shows. Two sources carry the rest of the argument.
The 20 F threshold that every article on this subject repeats traces back to a single 1996 research report from the Building Research Council at the University of Illinois at Urbana-Champaign. Its published abstract states that pipe bursting is more severe in the southern United States than in the northern United States, because protective measures there are less effective and less consistent. The same abstract corrects a misconception that is repeated everywhere: bursting is caused by pressure building in trapped water between an ice blockage and a closed tap, not by ice pushing outward on the pipe wall, which is why a pipe often splits at a point that is not frozen. The report's full text is not publicly posted and its record carries no reuse licence, so it is summarised here rather than quoted.
Our summary of information published by Gordon, J.R. (1996), An Investigation into Freezing and Bursting Water Pipes in Residential Construction, Building Research Council, University of Illinois at Urbana-Champaign
And here is a federal voice saying the same thing about the geography, in a place that would have every reason to say the opposite. This is the National Weather Service office in Duluth, Minnesota:
National Weather Service Duluth MN, Stay Safe in the Extreme Cold“What constitutes extreme cold varies in different parts of the country. In the southern U. S., near freezing temperatures are considered extreme cold. Freezing temperatures can cause severe damage to citrus fruit crops and other vegetation. Pipes may freeze and burst in homes that are poorly insulated or without heat. Here in the north, extreme cold means temperatures well below zero.”
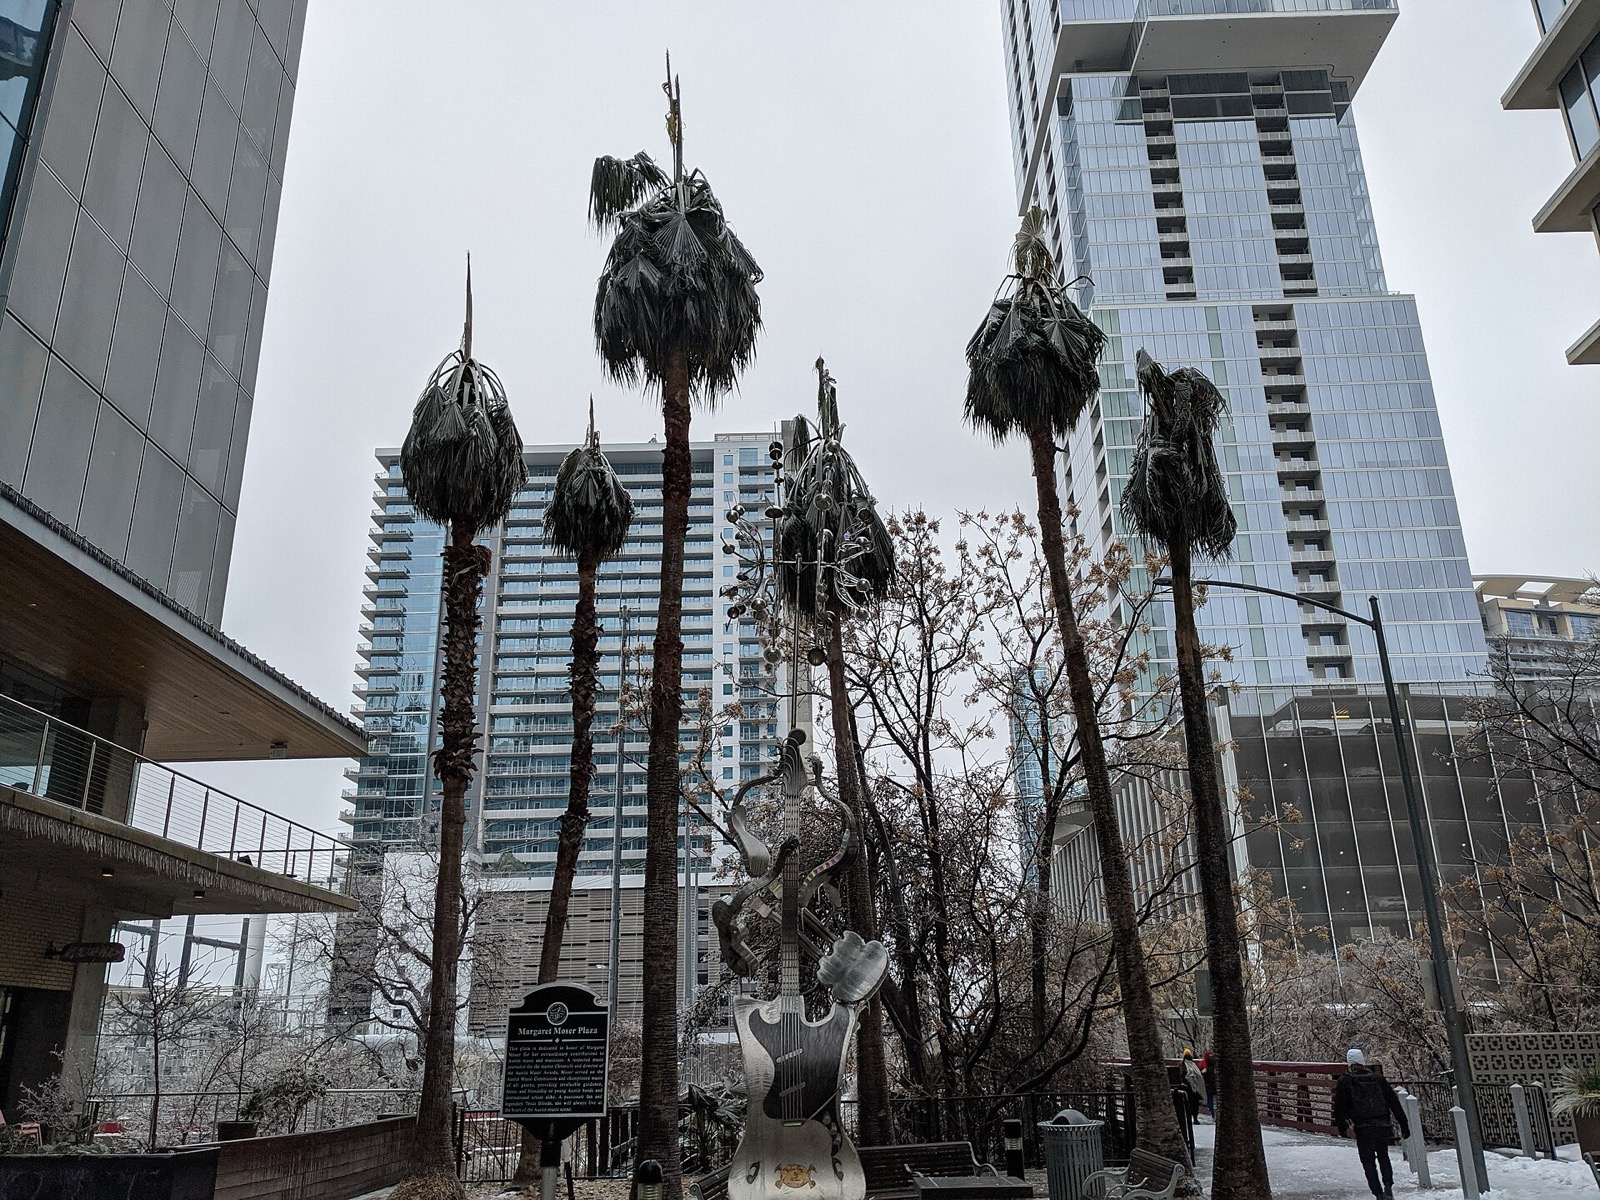
The one American cold event whose cost has been counted properly is the Texas winter storm of February 11, 2021 to February 19, 2021. The Texas Department of Insurance required carriers to report their claims and published the compilation. As of March 31, 2022, insurers reported 510,772 claims and expected to pay about 11.2 billion dollars in insured Texas losses from that one nine day event. About 85 percent of the claims were on residential property policies, at an average incurred loss of about 17,600 dollars each. The report attributes the damage to freezing pipes together with fallen limbs and the weight of ice and snow, so it is not a pure frozen pipe figure, and it is one state in one event. It is still the best documented number of its kind in the country. The Texas Department of Insurance is a state agency rather than a federal one, so these are its figures reported in our words rather than quoted.
Our summary of information published by Texas Department of Insurance, Insured Losses Resulting from the February 2021 Texas Winter Weather Event
Here is the National Weather Service office in Houston, writing about the same week:
National Weather Service Houston/Galveston, Valentine's Week Winter Outbreak 2021“This was one of the most impactful winter events in recent history that brought multiday road closures, power outages, loss of heat, broken pipes, and other societal impacts for the region.”
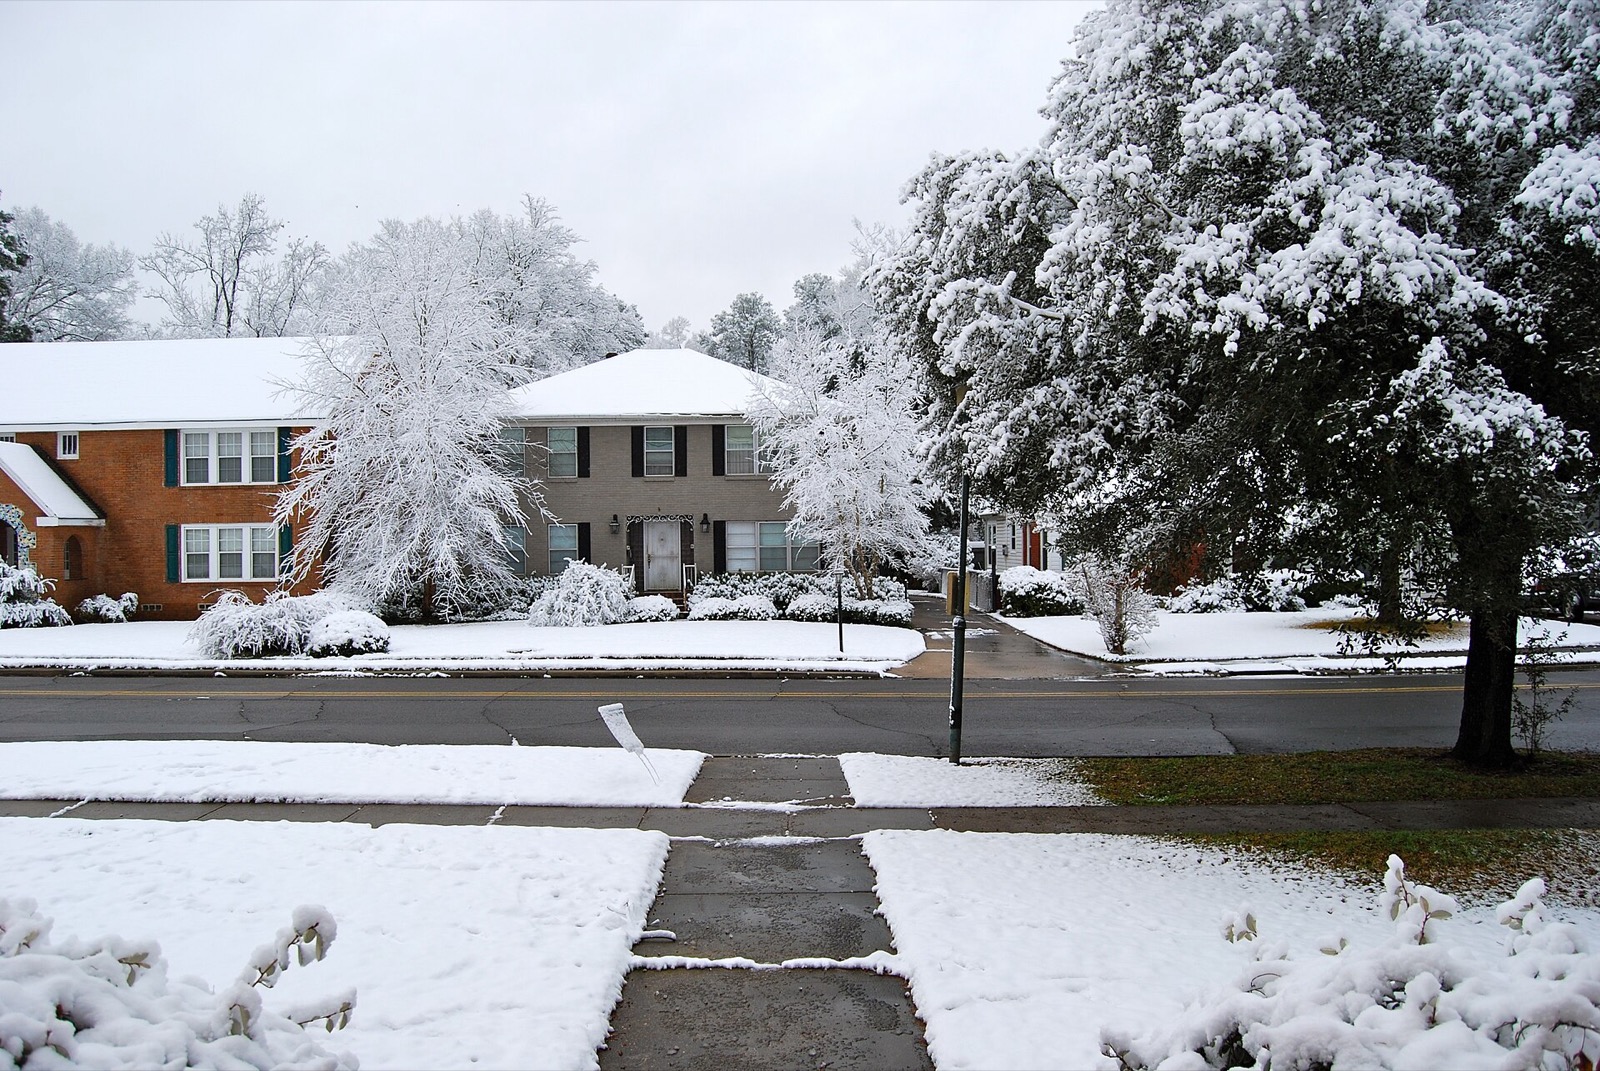
How cold each state gets, and how often
Sorted by the number of nights a year at or below 20 F at each state's primary reference city, which is the fastest way to see that this is not one national story. Every figure is this site's own count from NOAA NCEI GHCN-Daily station observations over the 30 winters from 1991-92 to 2020-21, since NOAA publishes no normal at 20 F, no date shaped cold normal and no spell length normal.
The primary city for each state is a major population center rather than the coldest station in the state, because the question people are asking is about the plumbing where they live. Each state page carries the rest of its stations, and in several states the gap between the first row and the last is the whole point.
| State | Reference city | Nights 20 F or colder | Winters with one | First hard freeze | Days never above 32 F | Page shape |
|---|---|---|---|---|---|---|
| North Dakota | Fargo | 108 | 100% | October 31 | 93 | Hard winter |
| Alaska | Anchorage | 100 | 100% | October 27 | 105 | Hard winter |
| South Dakota | Sioux Falls | 90 | 100% | October 31 | 66 | Hard winter |
| Minnesota | Minneapolis | 82 | 100% | November 12 | 72 | Hard winter |
| New Hampshire | Concord | 77 | 100% | November 6 | 44 | Hard winter |
| Vermont | Burlington | 73 | 100% | November 13 | 58 | Hard winter |
| Wyoming | Cheyenne | 72 | 100% | October 27 | 33 | Hard winter |
| Maine | Portland | 64 | 100% | November 18 | 41 | Hard winter |
| Colorado | Denver | 62 | 100% | November 6 | 21 | Hard winter |
| Nebraska | Omaha | 61 | 100% | November 12 | 40 | Hard winter |
| Iowa | Des Moines | 59 | 100% | November 16 | 46 | Hard winter |
| Montana | Billings | 59 | 100% | November 5 | 40 | Hard winter |
| Wisconsin | Milwaukee | 52 | 100% | November 23 | 50 | Hard winter |
| Illinois | Chicago | 50 | 100% | November 21 | 43 | Hard winter |
| Connecticut | Hartford | 47 | 100% | November 23 | 29 | Hard winter |
| Michigan | Detroit | 45 | 100% | November 27 | 42 | Hard winter |
| Indiana | Indianapolis | 37 | 100% | December 2 | 29 | Hard winter |
| Rhode Island | Providence | 34 | 100% | December 6 | 20 | Hard winter |
| Ohio | Columbus | 34 | 100% | December 5 | 28 | Hard winter |
| Kansas | Wichita | 32 | 100% | November 26 | 16 | Hard winter |
| Utah | Salt Lake City | 31 | 100% | November 24 | 20 | Hard winter |
| Massachusetts | Boston | 29 | 100% | December 10 | 23 | Countable |
| Missouri | St. Louis | 26 | 100% | December 7 | 20 | Countable |
| West Virginia | Charleston | 23 | 100% | December 6 | 15 | Countable |
| Idaho | Boise | 22 | 100% | November 23 | 16 | Countable |
| Delaware | Wilmington | 21 | 100% | December 12 | 14 | Countable |
| Maryland | Baltimore | 21 | 100% | December 15 | 11 | Countable |
| New Jersey | Newark | 20 | 100% | December 18 | 15 | Countable |
| Kentucky | Louisville | 19 | 100% | December 11 | 14 | Countable |
| New York | New York City | 17 | 100% | December 19 | 16 | Countable |
| Pennsylvania | Philadelphia | 16 | 100% | December 23 | 13 | Countable |
| Oklahoma | Oklahoma City | 15 | 100% | December 7 | 7.5 | Countable |
| Tennessee | Nashville | 14 | 100% | December 10 | 6.4 | Countable |
| New Mexico | Albuquerque | 13 | 100% | December 3 | 2.1 | Countable |
| Virginia | Richmond | 12 | 100% | December 16 | 4.8 | Countable |
| North Carolina | Charlotte | 7.2 | 93% | December 26 | 1.1 | Countable |
| Alabama | Birmingham | 6.2 | 97% | December 31 | 1.3 | Countable |
| Arkansas | Little Rock | 6.1 | 97% | December 27 | 3.3 | Countable |
| Georgia | Atlanta | 3.7 | 83% | January 7 | 1.2 | Countable |
| South Carolina | Columbia | 3.6 | 87% | January 3 | 0.2 | Countable |
| Mississippi | Jackson | 2.8 | 73% | January 7 | 0.9 | Countable |
| Texas | Dallas-Fort Worth | 2.7 | 67% | January 18 | 1.9 | Countable |
| Oregon | Portland | 1.2 | 40% | No median date | 1.7 | Rare |
| Washington | Seattle | 1 | 37% | No median date | 1.2 | Rare |
| Florida | Jacksonville | 0.3 | 20% | No median date | 0 | Rare |
| Louisiana | New Orleans | 0.1 | 7% | No median date | 0 | Rare |
| Nevada | Las Vegas | 0 | 3% | No median date | 0 | Rare |
| Arizona | Phoenix | 0 | 0% | No median date | 0 | Rare |
| California | Los Angeles | 0 | 0% | No median date | 0 | Rare |
Why the last column exists. A night at 20 F means something completely different in Fargo than in New Orleans, so the state pages do not all lead with the same number. Which shape a state gets is decided by its data.
Hard winter
states whose primary city averages 30 or more nights a year at or below 20 F. A hard freeze is the shape of January there, not an event, so those pages lead with how long the cold stretches run and how many days never thaw.
Countable
states where a hard freeze happens in most winters but stays countable. The first and last one of the year are real calendar markers, so those pages lead with the window. Four of them have a median window under three weeks, shown as dates rather than a season bar.
Rare
states (Florida, Louisiana, Nevada, Arizona, California, Oregon, Washington) whose primary city reaches 20 F in fewer than 50 percent of winters. Those pages lead with what the record contains: the nights it has happened, the worst of them, and the forecast. Note that this is not simply a southern list.
The one state with no hard freeze on record
Hawaii. Honolulu has not recorded a single night at or below 32 F in the 30 winters this dataset covers, let alone one at or below 20 F. Its coldest reading in the full record is 53 F. Hawaii does have freezing air, near the summits of Mauna Kea and Haleakala, and there is no residential plumbing up there.
Wind chill does not freeze a pipe any colder
Wind strips heat off a cold object faster, so a pipe reaches the air temperature sooner on a windy night than on a calm one. What wind cannot do is take the pipe below the air temperature. The National Weather Service is explicit, and this is the most useful published sentence on the whole subject:
National Weather Service, Cold Weather Frequently Asked Questions“The only effect wind chill has on inanimate objects, such as car radiators and water pipes, is to shorten the amount of time for the object to cool. The inanimate object will not cool below the actual air temperature. For example, if the temperature outside is -5°F and the wind chill temperature is -31°F, then your car's radiator will not drop lower than -5°F.”
So for a building, watch the forecast air temperature. For a person outside, watch the wind chill. They answer different questions, and every seven night strip on this site's state pages shows air temperature for exactly that reason.
The product names changed too. On 1 October 2024 the National Weather Service retired five cold product names in its Hazard Simplification work. This is not cosmetic: any site or app still querying a retired name gets an empty result set from the agency's feed, and an empty result renders as no alerts, which looks exactly like an all clear.
National Weather Service, NWS revises watch, warning and advisory products for cold“These changes seek to clarify that cold can be dangerous with or without wind, addressing a common misconception that extreme cold is only tied to colder temperatures when there is wind.”
What actually hurts people in a hard freeze
Before anything else: how people get hurt in these events
The ways a frozen pipe goes badly wrong for a person have almost nothing to do with plumbing. They are fire and carbon monoxide, and both spike during the power outages that come with severe cold. The federal agencies below say it best.
The U.S. Fire Administration: “Home portable heater fires were only 3% of all home heating fires annually for 2017-2019, but they accounted for 41% of fatal heating fires in homes.” (U.S. Fire Administration, Heating Fire Safety)
The Consumer Product Safety Commission: “Never use portable generators inside homes or garages, even if doors and windows are open.” (U.S. Consumer Product Safety Commission, Carbon Monoxide Information Center)
FEMA: “Avoid carbon monoxide poisoning. Only use generators and grills outdoors and away from windows and never heat your home with a gas stovetop or oven.” (FEMA Ready.gov, Winter Weather)
Full winter guidance is at weather.gov/safety/cold and ready.gov/winter-weather. For a pipe that has already failed, the people to call are a licensed plumber and, if the water reaches wiring or a gas appliance, your utility.
On the plumbing itself, this site gives no instructions of its own. Here is the National Weather Service on where the vulnerable pipes are, why a dripping tap helps, and the one thing worth knowing before an event rather than during one:
National Weather Service, Essential Tasks After it Warms Up“Water pipes on exterior walls and in places that are subject to cold, like in the basement, attic, and under kitchen cabinets, freeze most often. Water expands as it freezes, causing pipes to burst.”
National Weather Service New York NY, Home Preparedness Tips for Prolonged Frigid Cold“Allow faucets to drip slowly to keep unheated pipes from freezing. Keeping them open relieves pressure that builds between the faucet and ice blockage.”
National Weather Service New York NY, Home Preparedness Tips for Prolonged Frigid Cold“Also, know where and how to shut off the main water supply in case of a ruptured pipe.”
National Weather Service New York NY, Home Preparedness Tips for Prolonged Frigid Cold“Open kitchen and bathroom sink cabinets to allow warmer air to circulate around plumbing.”
National Weather Service New York NY, Home Preparedness Tips for Prolonged Frigid Cold“Cracks and holes in outside walls and foundations near water pipes should be sealed with caulk to keep the cold air out.”
National Weather Service Jacksonville FL, Cold Weather Safety“To prevent freezing and possible bursting of outdoor water pipes, pipes should be wrapped, drained, or allowed to drip slowly.”
National Weather Service Jacksonville FL, Cold Weather Safety“Those who have in-ground sprinkler systems should cover any above-ground pipes to protect them from freezing.”
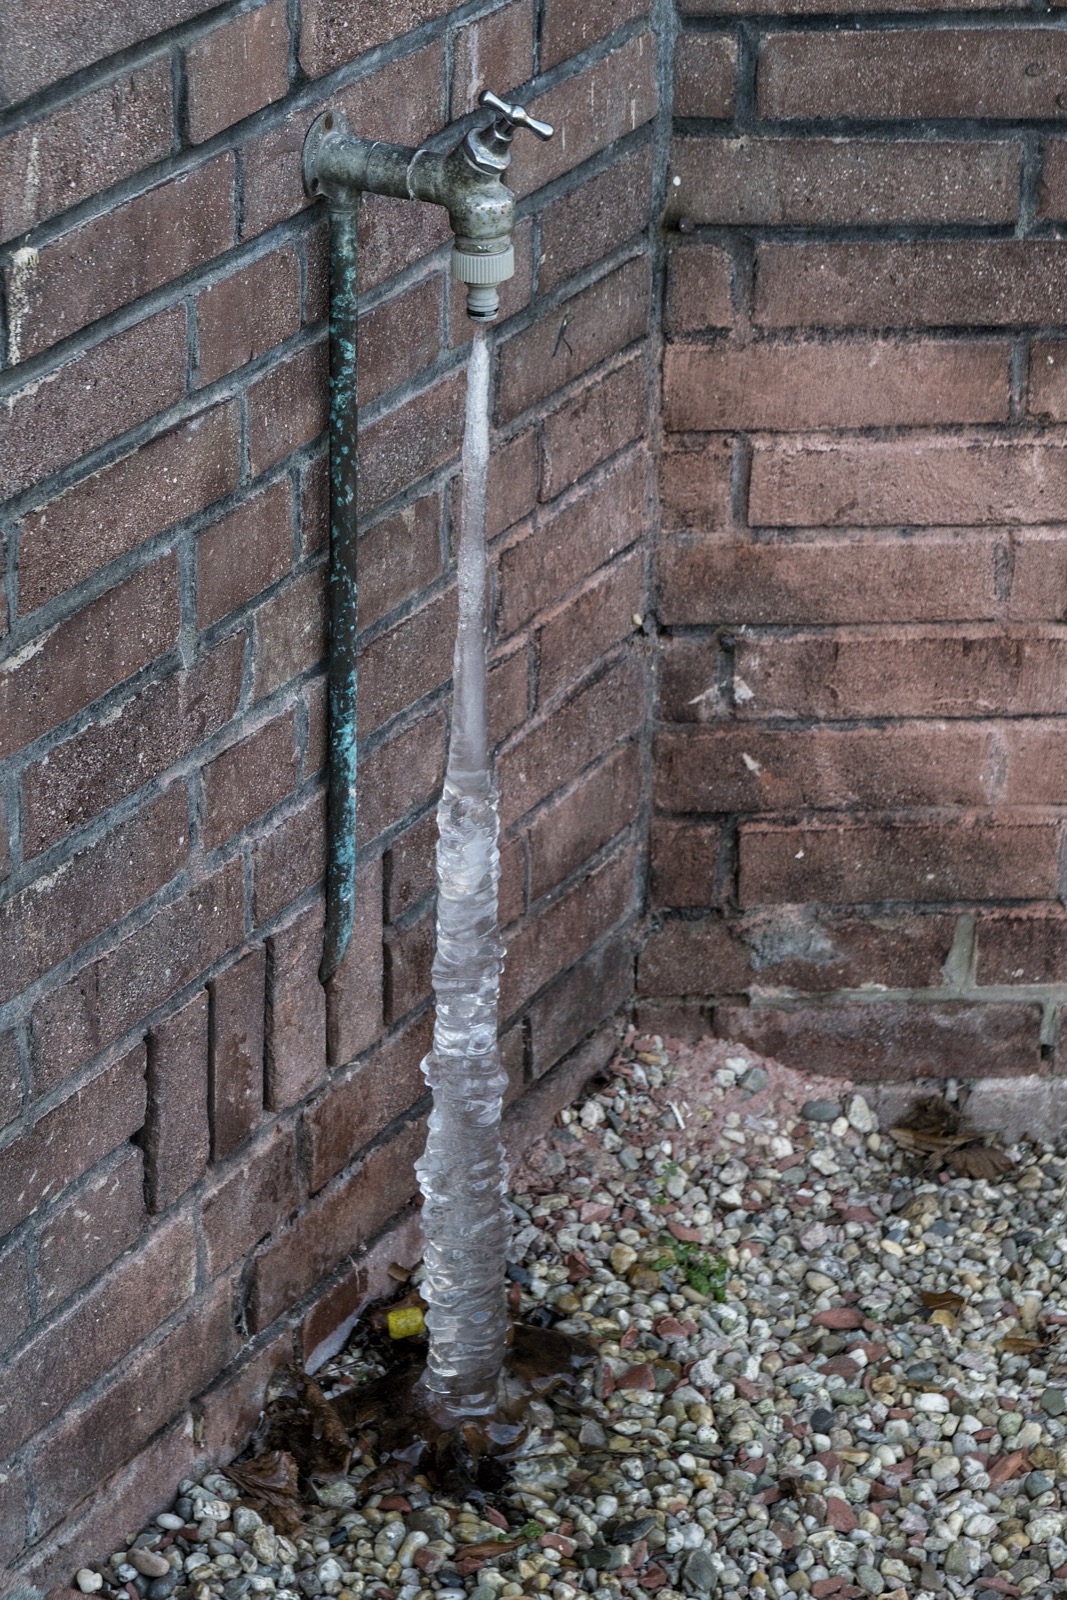
How the counts are made
Derived from NOAA daily records: every count on every page. Nights at or below 20 F, freezing nights, days that never rise above 32 F, run lengths, first and last dates and their percentiles, the coldest week of the year, and the worst cold stretches on record. All of it is computed from NOAA NCEI GHCN-Daily daily minimum and maximum temperatures over the 30 winters from 1991-92 to 2020-21 at 148 stations, and committed as a dated snapshot.
Why the counts are derived rather than quoted: NOAA does publish threshold day normals, but the thresholds are fixed at 32 F and 0 F, and the plumbing literature is built on 20 F. NOAA publishes no date shaped cold normal and nothing about how long a cold spell lasts, which is the part that matters to a pipe inside a wall.
Passed through verbatim: National Weather Service cold products, with the issuing office, the areas named and the times, exactly as issued, plus the gridpoint overnight lows on each state page. Reported from others: the Texas Department of Insurance loss compilation and the NOAA NCEI billion dollar disaster figures, both in our own words with the source linked. Outside the record: these pages describe weather, with no risk score, no burst pipe estimate and no statement about a particular building.
One data quality note. NOAA's daily summaries product carries a small number of unflagged impossible values, and three of the 148 stations here have one: Mobile reports 41 below zero on 28 June 1999, Orlando reports 1 F on 31 July 2009, Biloxi reports 0 F on 11 September 2002. At stations where a hard freeze is rare, a single bad value takes over the whole event ranking. Any hard freeze record or event dated June through September is dropped, which removes exactly those three values and nothing else.
Sources: NOAA NCEI GHCN-Daily, NWS api.weather.gov, NOAA NCEI Billion-Dollar Weather and Climate Disasters. All three are US Government works in the public domain. Non-federal and therefore never quoted here, only described and linked: the 1996 Building Research Council report and the Texas Department of Insurance loss compilation.
Frozen pipes FAQ
Frozen pipes, state by state
The same winter, other problems
Every count in this vertical is our own derivation from NOAA NCEI GHCN-Daily station observations over the 30 winters from 1991-92 to 2020-21. NOAA publishes no cold normal at 20 F, no cold date normal and no spell length normal, so none of it is a quoted figure. Live products come from the National Weather Service and are shown verbatim with the issuing office named. There is no national record of burst pipes and nothing here estimates one. For winter safety, see NWS cold weather safety and Ready.gov winter weather. State pages: Texas, Minnesota, Washington.