
King Tides 2026 to 2027: Dates for Every US Coast
The highest predicted tides NOAA publishes for 179 coastal stations from October 1, 2026 to March 31, 2027, by coast, by state and by station, with the National Weather Service's coastal flood products shown live beside them.
Next king tide dates: Nov 24 to 26, 2026, Mid-Atlantic (30 stations)This season at a glance
NOAA CO-OPS predictions, October 2026 to March 2027King tide dates are set by the moon. The new and full moons that fall nearest the moon’s closest approach to Earth bring the biggest predicted tides, so the same few dates recur from coast to coast. Across all 179 stations the peak dates shared most widely this season are November 25, 2026 (113 stations), December 24, 2026 (71 stations) and October 27, 2026 (56 stations).
King tide dates by coast, October 2026 to March 2027
Each row is a run of dates on which a coast’s NOAA stations reach the highest predicted tides of their season. The station count says how many of the coast’s stations have a king tide window peaking on those dates. The highest column names the station whose peak stands furthest above its own mean higher high water, with the predicted height and time. Every figure traces to a NOAA prediction row and to the station’s published datums, and each station page lists all of its windows with the moon phase and the live National Weather Service product for its zone.
New England
29 NOAA stations in Maine, New Hampshire, Massachusetts, Rhode Island and Connecticut.
| Peak dates | Stations peaking then | Highest above MHHW | Moon |
|---|---|---|---|
| Oct 27 to 29, 2026 | 15 of 29 | Stamford, CT +1.3 ft 9.1 ft above MLLW, Oct 27 12:30 PM | Full Moon |
| Nov 25 to 26, 2026 | 28 of 29 | Eastport, ME +2.3 ft 21.5 ft above MLLW, Nov 26 11:29 AM | Waning Gibbous |
| Dec 23 to 25, 2026 | 28 of 29 | Eastport, ME +2.4 ft 21.7 ft above MLLW, Dec 25 11:15 AM | Waning Gibbous |
| Jan 22 to 23, 2027 | 14 of 29 | Eastport, ME +2.5 ft 21.8 ft above MLLW, Jan 23 11:03 AM | Full Moon |
Mid-Atlantic
39 NOAA stations in New York, New Jersey, Pennsylvania, Delaware, Maryland and Virginia.
| Peak dates | Stations peaking then | Highest above MHHW | Moon |
|---|---|---|---|
| Oct 10 to 11, 2026 | 14 of 39 | Kiptopeke Beach, VA +0.6 ft 3.5 ft above MLLW, Oct 11 9:41 AM | New Moon |
| Oct 27 to 30, 2026 | 32 of 39 | Kings Point, NY +1.5 ft 9.3 ft above MLLW, Oct 27 12:10 PM | Waning Gibbous |
| Nov 24 to 26, 2026 | 30 of 39 | Kings Point, NY +1.4 ft 9.2 ft above MLLW, Nov 25 10:52 AM | Full Moon |
| Dec 24 to 25, 2026 | 19 of 39 | Wildwood Crest, NJ +1.0 ft 5.9 ft above MLLW, Dec 24 7:15 AM | Full Moon |
Southeast Atlantic
41 NOAA stations in North Carolina, South Carolina, Georgia and Florida.
| Peak dates | Stations peaking then | Highest above MHHW | Moon |
|---|---|---|---|
| Oct 10 to 14, 2026 | 16 of 41 | Mayport, FL +1.0 ft 5.9 ft above MLLW, Oct 10 9:04 AM | New Moon |
| Oct 25 to 30, 2026 | 38 of 41 | Brunswick, GA +1.9 ft 9.6 ft above MLLW, Oct 27 9:55 AM | Full Moon |
| Nov 25 to 27, 2026 | 36 of 41 | Brunswick, GA +1.9 ft 9.6 ft above MLLW, Nov 25 8:39 AM | Full Moon |
| Dec 24 to 25, 2026 | 12 of 41 | Hilton Head Island, SC +1.2 ft 8.6 ft above MLLW, Dec 24 8:10 AM | Full Moon |
Gulf Coast
24 NOAA stations in Alabama, Mississippi, Louisiana and Texas.
| Peak dates | Stations peaking then | Highest above MHHW | Moon |
|---|---|---|---|
| Oct 1 to 4, 2026 | 20 of 24 | Waveland, MS +0.9 ft 2.5 ft above MLLW, Oct 2 3:02 AM | Last Quarter |
| Oct 27 to 31, 2026 | 20 of 24 | Waveland, MS +1.0 ft 2.6 ft above MLLW, Oct 30 1:58 AM | Waning Gibbous |
| Nov 24 to 27, 2026 | 9 of 24 | Waveland, MS +0.9 ft 2.5 ft above MLLW, Nov 27 12:08 AM | Full Moon |
| Dec 23, 2026 | 3 of 24 | Biloxi, MS +0.8 ft 2.5 ft above MLLW, Dec 23 10:01 PM | Full Moon |
Pacific Coast
30 NOAA stations in California, Oregon and Washington.
| Peak dates | Stations peaking then | Highest above MHHW | Moon |
|---|---|---|---|
| Nov 25 to 27, 2026 | 25 of 30 | La Push, WA +2.3 ft 10.8 ft above MLLW, Nov 25 11:55 AM | Full Moon |
| Dec 22 to 26, 2026 | 30 of 30 | La Push, WA +2.5 ft 11.0 ft above MLLW, Dec 24 11:43 AM | Full Moon |
| Dec 29, 2026 | 1 of 30 | Bremerton, WA +1.4 ft 13.1 ft above MLLW, Dec 29 9:25 AM | Last Quarter |
| Jan 21 to 27, 2027 | 29 of 30 | La Push, WA +2.3 ft 10.8 ft above MLLW, Jan 22 11:39 AM | Full Moon |
Alaska and Hawaii
16 NOAA stations in Alaska and Hawaii.
| Peak dates | Stations peaking then | Highest above MHHW | Moon |
|---|---|---|---|
| Oct 27, 2026 | 4 of 16 | Anchorage, AK +3.6 ft 32.8 ft above MLLW, Oct 27 8:22 PM | Waning Gibbous |
| Nov 25, 2026 | 15 of 16 | Homer, AK +4.2 ft 22.6 ft above MLLW, Nov 25 2:18 PM | Full Moon |
| Dec 24 to 25, 2026 | 15 of 16 | Homer, AK +4.0 ft 22.5 ft above MLLW, Dec 24 2:09 PM | Full Moon |
| Jan 21 to 23, 2027 | 13 of 16 | Homer, AK +4.1 ft 22.6 ft above MLLW, Jan 23 2:56 PM | Full Moon |
The heights are NOAA’s predictions of the astronomical tide. Wind, barometric pressure and river flow raise or lower the real water level on the day, and the National Weather Service’s coastal flood product for the zone is the authority on whether water is expected over land.
How far above normal each station’s season peak reaches
One dot per NOAA harmonic station, coloured by how far its highest predicted tide of the season stands above mean higher high water at that station. The darkest dots this season sit in Alaska (Homer, +4.2 ft) and, in the lower 48, at Eastport, ME (+2.5 ft). Hover or tap a dot for the station’s season high and first window; click it for the tide chart.
Season October 2026 to March 2027. Each dot is one NOAA harmonic prediction station, coloured by how far its highest predicted tide of the season stands above mean higher high water (MHHW), the average of each day’s higher high tide at that station. Measuring against MHHW compares each station with its own ordinary high, so 2 ft above MHHW means the same thing in Alaska and in Florida even though their tide ranges differ tenfold. Heights are NOAA’s astronomical predictions; the National Weather Service issues the coastal flood products for each zone, and every station page shows them live.
What a king tide is
NOAA’s National Ocean Service: “A King Tide is a non-scientific term people often use to describe exceptionally high tides.” It adds that “Higher than normal tides typically occur during a new or full moon and when the Moon is at its perigee, or during specific seasons around the country.” Perigee is the moon’s closest approach to Earth in its monthly orbit; when it lines up with a new or full moon, the sun and moon pull together on a moon that is also nearer than usual, and every coast gets the biggest predicted tides of its year.
On these pages a king tide is the highest predicted tide NOAA publishes for a station from October 1, 2026 to March 31, 2027. Each station gets up to three windows: the season’s highest predicted high, extended to the consecutive days whose highest tide stays within 0.3 ft of it, then the next highest outside that run, then the next. The dates cluster on the full moons of late October, late November, late December and late January this season, and the calendar above shows which of those each coast shares.
How to read the numbers
Feet above MLLW. NOAA measures every tide prediction from mean lower low water, the long term average of the lower of each day’s two lows, which is also the zero on NOAA’s nautical charts. A 7.2 ft king tide at San Francisco means the water stands 7.2 feet above that average lowest level.
Above MHHW. Mean higher high water is the long term average of the higher of each day’s two highs at a station. A peak 1.4 ft above MHHW is 1.4 feet higher than an ordinary day’s higher high tide there, which is the number to look at when comparing stations: a 12 ft tide is an ordinary afternoon at Eastport, Maine and a rare event at Galveston, but 2 ft above MHHW means the same thing at both.
The window. The highest predicted tide of the season, plus the consecutive days around it whose highest tide stays within 0.3 ft. The peak date and time are the single highest prediction inside it, in station local time, and the moon column is the phase at that instant.
The NWS line. Every state and station page checks the National Weather Service for a Coastal Flood Advisory, Watch, Warning or Statement covering the station’s public forecast zone and shows the product by name, with a link, when one is active. The prediction says how high the astronomical tide reaches; the product says what NWS expects the water to do over land on the day.
King tide dates by state
Each state page lists every NOAA station on that coast with its first king tide window and its season high above MHHW, links each one to its tide chart, and shows the National Weather Service coastal flood products active for the state’s zones right now.
New England
Maine
7 stations. Highest: Eastport, +2.5 ft above MHHW.
First window Nov 25 to 26, 2026 at EastportNew Hampshire
2 stations. Highest: New Castle, +1.6 ft above MHHW.
First window Nov 24 to 28, 2026 at DoverMassachusetts
10 stations. Highest: Plymouth, +1.6 ft above MHHW.
First window Oct 25 to 29, 2026 at New BedfordRhode Island
5 stations. Highest: Point Judith, +0.9 ft above MHHW.
First window Oct 25 to 29, 2026 at WickfordConnecticut
5 stations. Highest: Stamford, +1.3 ft above MHHW.
First window Oct 9 to 12, 2026 at New HavenMid-Atlantic
New York
9 stations. Highest: Kings Point, +1.5 ft above MHHW.
First window Oct 7 to 13, 2026 at Sag HarborNew Jersey
9 stations. Highest: Wildwood Crest, +1.1 ft above MHHW.
First window Oct 1 to 3, 2026 at Red BankPennsylvania
2 stations. Highest: Marcus Hook, +0.8 ft above MHHW.
First window Oct 8 to 12, 2026 at PhiladelphiaDelaware
4 stations. Highest: Lewes, +0.9 ft above MHHW.
First window Oct 7 to 13, 2026 at Delaware CityMaryland
7 stations. Highest: Ocean City, +1.1 ft above MHHW.
First window Oct 1 to 4, 2026 at Havre de GraceVirginia
8 stations. Highest: Virginia Beach, +0.9 ft above MHHW.
First window Oct 1 to 6, 2026 at Colonial BeachSoutheast Atlantic
North Carolina
9 stations. Highest: Wrightsville Beach, +1.2 ft above MHHW.
First window Oct 1 to 2, 2026 at DuckSouth Carolina
7 stations. Highest: Hilton Head Island, +1.5 ft above MHHW.
First window Oct 6 to 13, 2026 at CharlestonGeorgia
5 stations. Highest: Brunswick, +1.9 ft above MHHW.
First window Oct 8 to 11, 2026 at St. MarysFlorida
20 stations. Highest: St. Augustine Beach, +1.4 ft above MHHW.
First window Oct 1 to 15, 2026 at Fort LauderdaleGulf Coast
Alabama
4 stations. Highest: Dauphin Island, +0.8 ft above MHHW.
First window Oct 1 to 5, 2026 at MobileMississippi
4 stations. Highest: Waveland, +1.0 ft above MHHW.
First window Oct 1 to 5, 2026 at WavelandLouisiana
6 stations. Highest: Shell Beach, +0.9 ft above MHHW.
First window Oct 1 to 22, 2026 at New OrleansTexas
10 stations. Highest: Corpus Christi, +0.9 ft above MHHW.
First window Oct 1 to 14, 2026 at Sabine PassPacific Coast
California
14 stations. Highest: Eureka, +2.0 ft above MHHW.
First window Nov 24 to 26, 2026 at Crescent CityOregon
6 stations. Highest: Depoe Bay, +2.3 ft above MHHW.
First window Nov 24 to 26, 2026 at AstoriaWashington
10 stations. Highest: La Push, +2.5 ft above MHHW.
First window Nov 24 to 26, 2026 at Neah BayKing tides FAQ
NOAA’s National Ocean Service: “A King Tide is a non-scientific term people often use to describe exceptionally high tides.” On these pages the term means the highest predicted tides NOAA publishes for a station from October 1, 2026 to March 31, 2027.Source: oceanservice.noaa.gov
All state pages
Tide heights are NOAA CO-OPS harmonic predictions (https://api.tidesandcurrents.noaa.gov/api/prod/datagetter) for October 1, 2026 to March 31, 2027, reproduced as published, with MHHW and MLLW from the CO-OPS station datums; NWS public forecast zones from api.weather.gov; data built 2026-09-19. NOAA and NWS material is US government work in the public domain, attributed as NOS requests. NOAA’s published disclaimer applies to every prediction shown: “These data are based upon the latest information available as of the date of your request, and may differ from the published tide tables.” Seven day tide tables for every station: US tide charts.
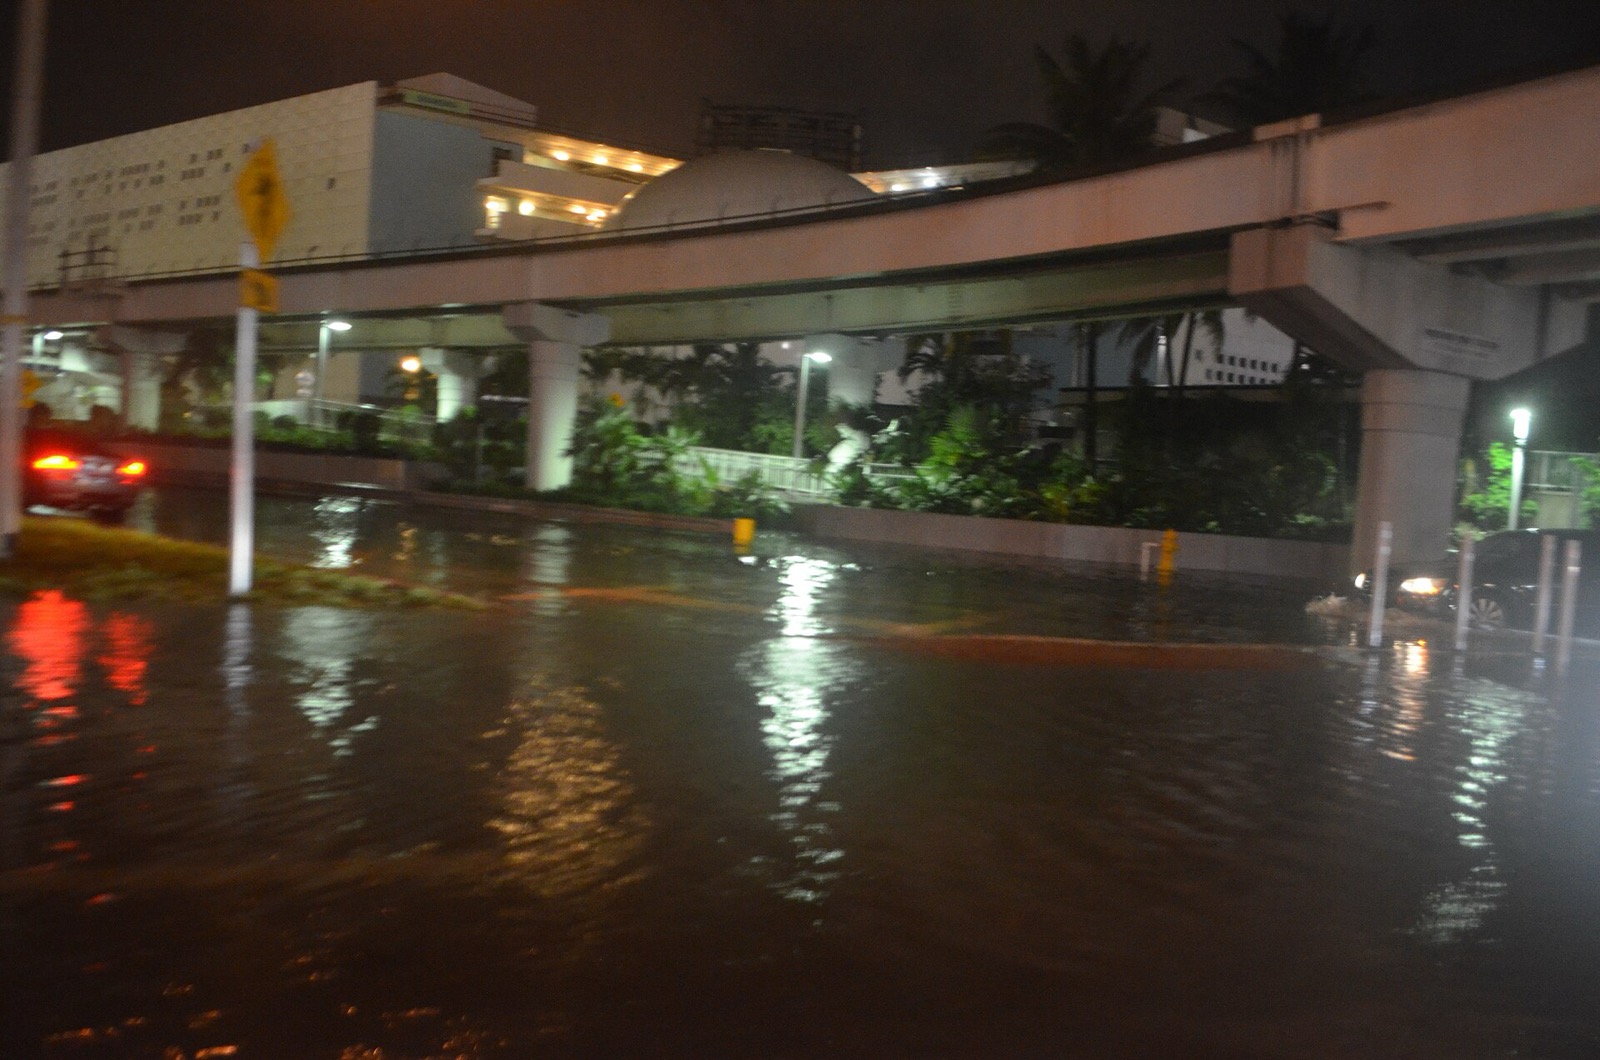
Hero image: “Miami tidal flooding with rain at high tide during king tides 02” — B137 — CC0