
Skip to content
Historical record · 1816 to 2020

When Lakes Freeze Over: Ice In Dates, State by State

The freeze is the half of the ice season fewer people wrote down. Where somebody did, they mostly did it for two hundred years. Here is what those records say about when 40 United States water bodies have typically closed over, and how far that date has moved.

40
Water bodies with a freeze record
out of the 116 with any ice record
3,402
Recorded freezes
individual dates written down
1816
Oldest observation
Lake Champlain, kept since then
22 of 23
Closing later
of the long enough freeze records

Dates from past winters. For today’s ice, ask the agency that manages the water.

The short answer

November 15 to February 10

Across the 40 water bodies with a freeze record, the typical closing runs from November 15 on Maple Lake in WI to February 10 on Grand Traverse Bay in MI. That is 87 days inside five states, and most of it is depth and surface area rather than latitude. Every figure on this page is a median drawn from past winters, not an observation of any lake now.

87 days
Between the earliest and latest typical freeze
17
Records spanning a century or more
109
Winters with no freeze at all, on 11 water bodies
5
States with a freeze record, against nine for the thaw

Every lake with a freeze record, in the order they close

Read this from the top and you are reading the country freezing over. The small shallow lakes of northern Wisconsin and Minnesota go first, in the middle of November. The deep ones follow through December. The Great Lakes bays come last and sometimes do not come at all.

Nov 1Dec 1Jan 1Feb 1Mar 1Maple Lake (WI)Nov 15Mystery Lake (WI)Nov 17Spruce Lake (WI)Nov 19Detroit (MN)Nov 22Lake Shishebogama (WI)Nov 22Lake Escanaba (WI)Nov 25Lake Nebish (WI)Nov 27Pepin (MN)Nov 27East Okoboji Lake (IA)Nov 30Lake Wingra (WI)Nov 30Spirit Lake (IA)Nov 30Green (MN)Dec 2Mirror (NY)Dec 2Shell Lake (WI)Dec 2Waconia (MN)Dec 2Big Muskellunge Lake (WI)Dec 3Fair Lake (MI)Dec 6Lake Kegonsa (WI)Dec 9Loon (NY)Dec 11Genegantslet (NY)Dec 12West Okoboji Lake (IA)Dec 12Lake Monona (WI)Dec 15Cazenovia (NY)Dec 16Placid (NY)Dec 16Devils Lake (WI)Dec 18Brant (NY)Dec 19Lake Mendota (WI)Dec 20Mohonk (NY)Dec 21Oneida (NY)Dec 22Schroon (NY)Dec 22Green Bay at Menominee (MI)Dec 31Lake Superior at Bayfield (WI)Jan 1Lake Geneva (WI)Jan 2Gull Lake (MI)Jan 6Big Green Lake (WI)Jan 9Lake Superior at Madeline Island (WI)Jan 9Otsego (NY)Jan 11George (NY)Jan 18Lake Champlain (NY)Feb 2Grand Traverse Bay (MI)Feb 10

Each bar runs from that water body's earliest recorded closing to its latest. The solid dot is the median across the whole record and the ring is the median across its most recent 30 recorded winters. The scale starts near the earliest date in the set rather than at January 1, because these are dates a few weeks apart and a full year axis would hide the whole picture.

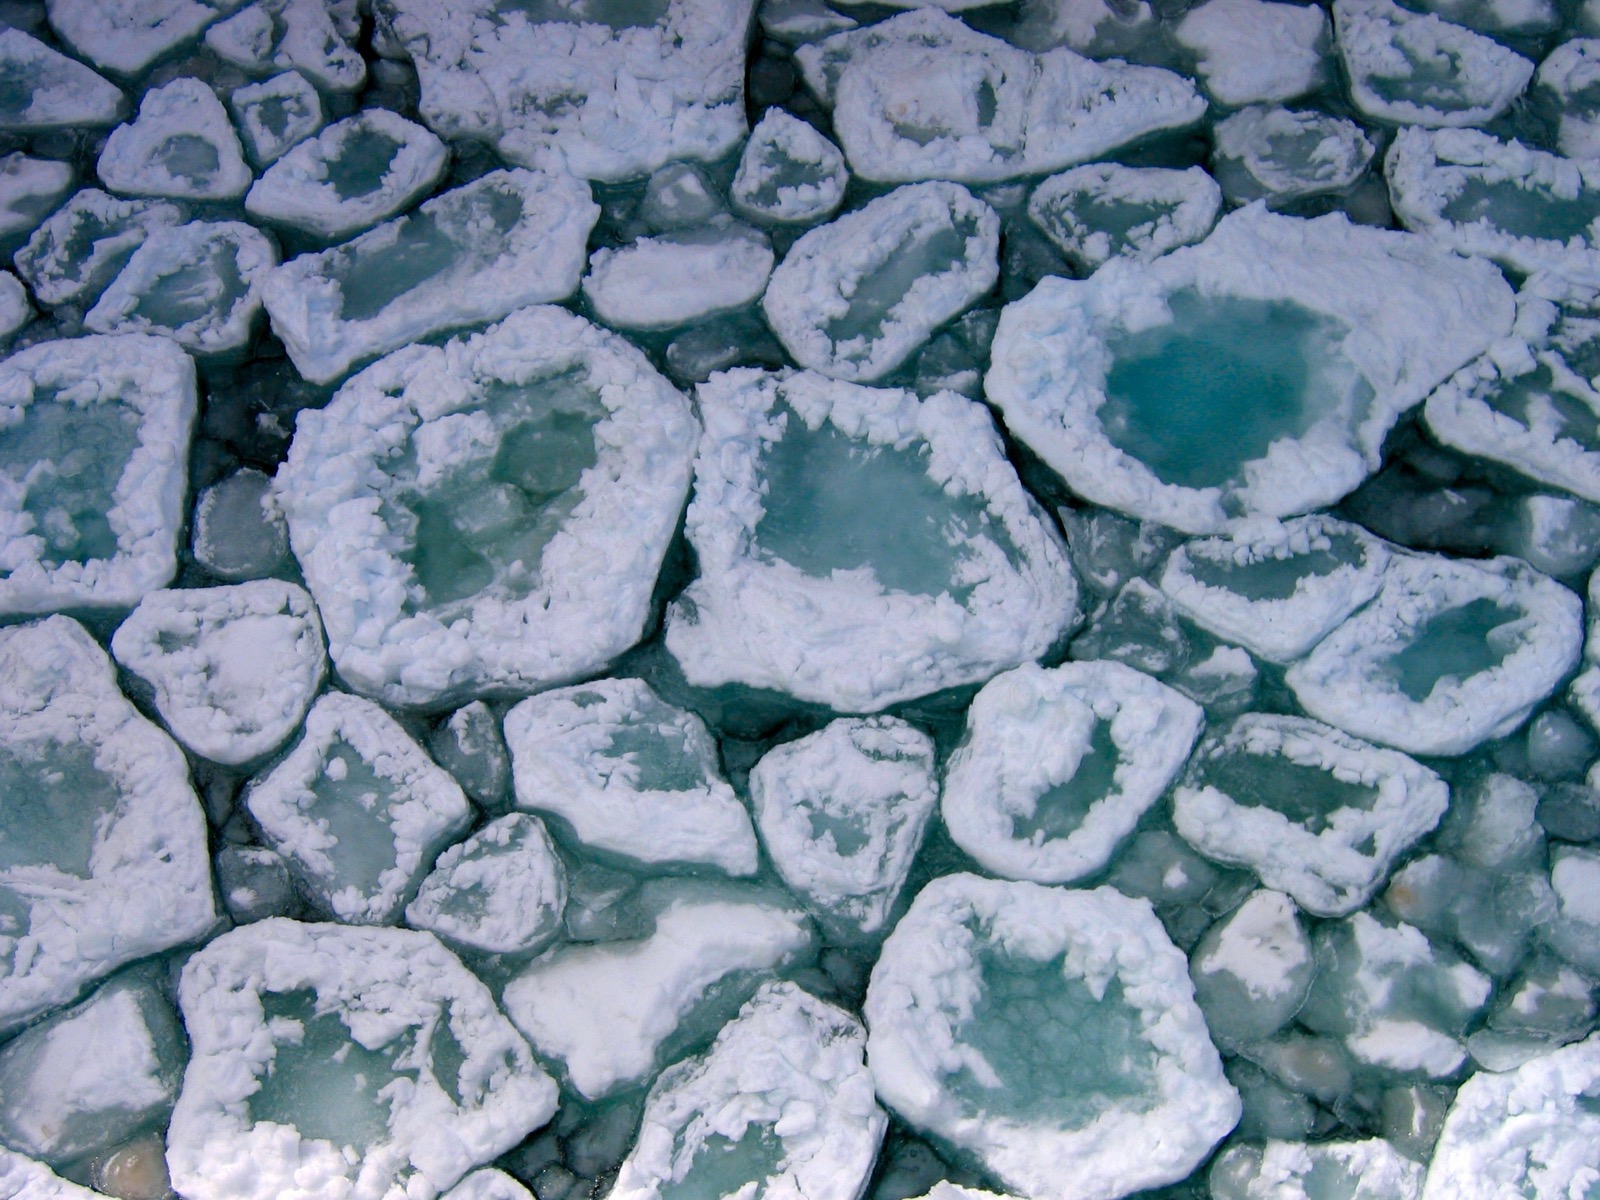
Overhead view of pancake ice on Lake Superior, rounded plates of new ice with raised white rims and pale turquoise centres packed edge to edge across the water
Pancake ice on Lake Superior. Each plate froze on its own, then collided with its neighbours until the collisions rounded and rimmed it. A closing date is the day all of this finally welds together, which on a small lake takes a night and on water this size can take a month or never happen at all. “Pancake Ice on Lake Superior” — National Park Service, Pictured Rocks National Lakeshore — Public domain

Ice in and ice out are timing questions, answerable from records that already exist: every figure on these pages is a date somebody observed in a past winter. Ice strength is a different question, and the state agency linked on each state page is the source for the current season.

What two centuries show

The ice season is closing from both ends

This is the part the record shows directly, and it is the reason the freeze half of the record is worth publishing separately. 22 lakes here carry a least squares slope on both variables. On 21 of them the freeze has been arriving later, and on 21 the thaw has been arriving earlier. On 21 it is both at once.

The median freeze shift across those lakes is 7.1 days later per century. The median thaw shift is -5.6 days per century. Add one lake’s own freeze line to its own thaw line and the median lake in that set has lost about 12.3 days of ice season per century. The widest is Lake Superior at Bayfield, where the freeze has moved 15.4 days later and the thaw 16.2 days earlier, which is 31.6 days of ice season per century on a record that has run since 1858.

Every one of those figures is a straight line fitted to one lake’s own observations, which is the standard description in the ice phenology literature. It is arithmetic on dates that were written down. It is not a projection, there is no model underneath it, and it does not say what the next decade will do.

no change10d shorter20d shorter30d shorterLake Superior at Bayfield (WI)31.6d shorterBig Green Lake (WI)29.6d shorterGull Lake (MI)24.4d shorterSchroon (NY)20.8d shorterLake Monona (WI)19.5d shorterLake Mendota (WI)17.2d shorterLake Geneva (WI)16.5d shorterMohonk (NY)15.5d shorterMirror (NY)15d shorterLake Wingra (WI)14.3d shorterCazenovia (NY)12.4d shorterOtsego (NY)12.1d shorterShell Lake (WI)12.1d shorterGrand Traverse Bay (MI)11.9d shorterGreen (MN)11.9d shorterOneida (NY)11.8d shorterDetroit (MN)11.5d shorterLake Kegonsa (WI)10.3d shorterPlacid (NY)7.1d shorterGeorge (NY)6.9d shorterWest Okoboji Lake (IA)5.1d shorterEast Okoboji Lake (IA)4.7d longer
  • Freeze arriving later
  • Thaw arriving earlier

Each bar is one lake's own freeze line added to its own thaw line, both fitted by least squares to that lake's observations and both already published in the source data. The figure on the right is how many days of ice season that adds up to per century. It is arithmetic on a record, not a model and not a projection, and only lakes with 80 or more years on both variables appear.

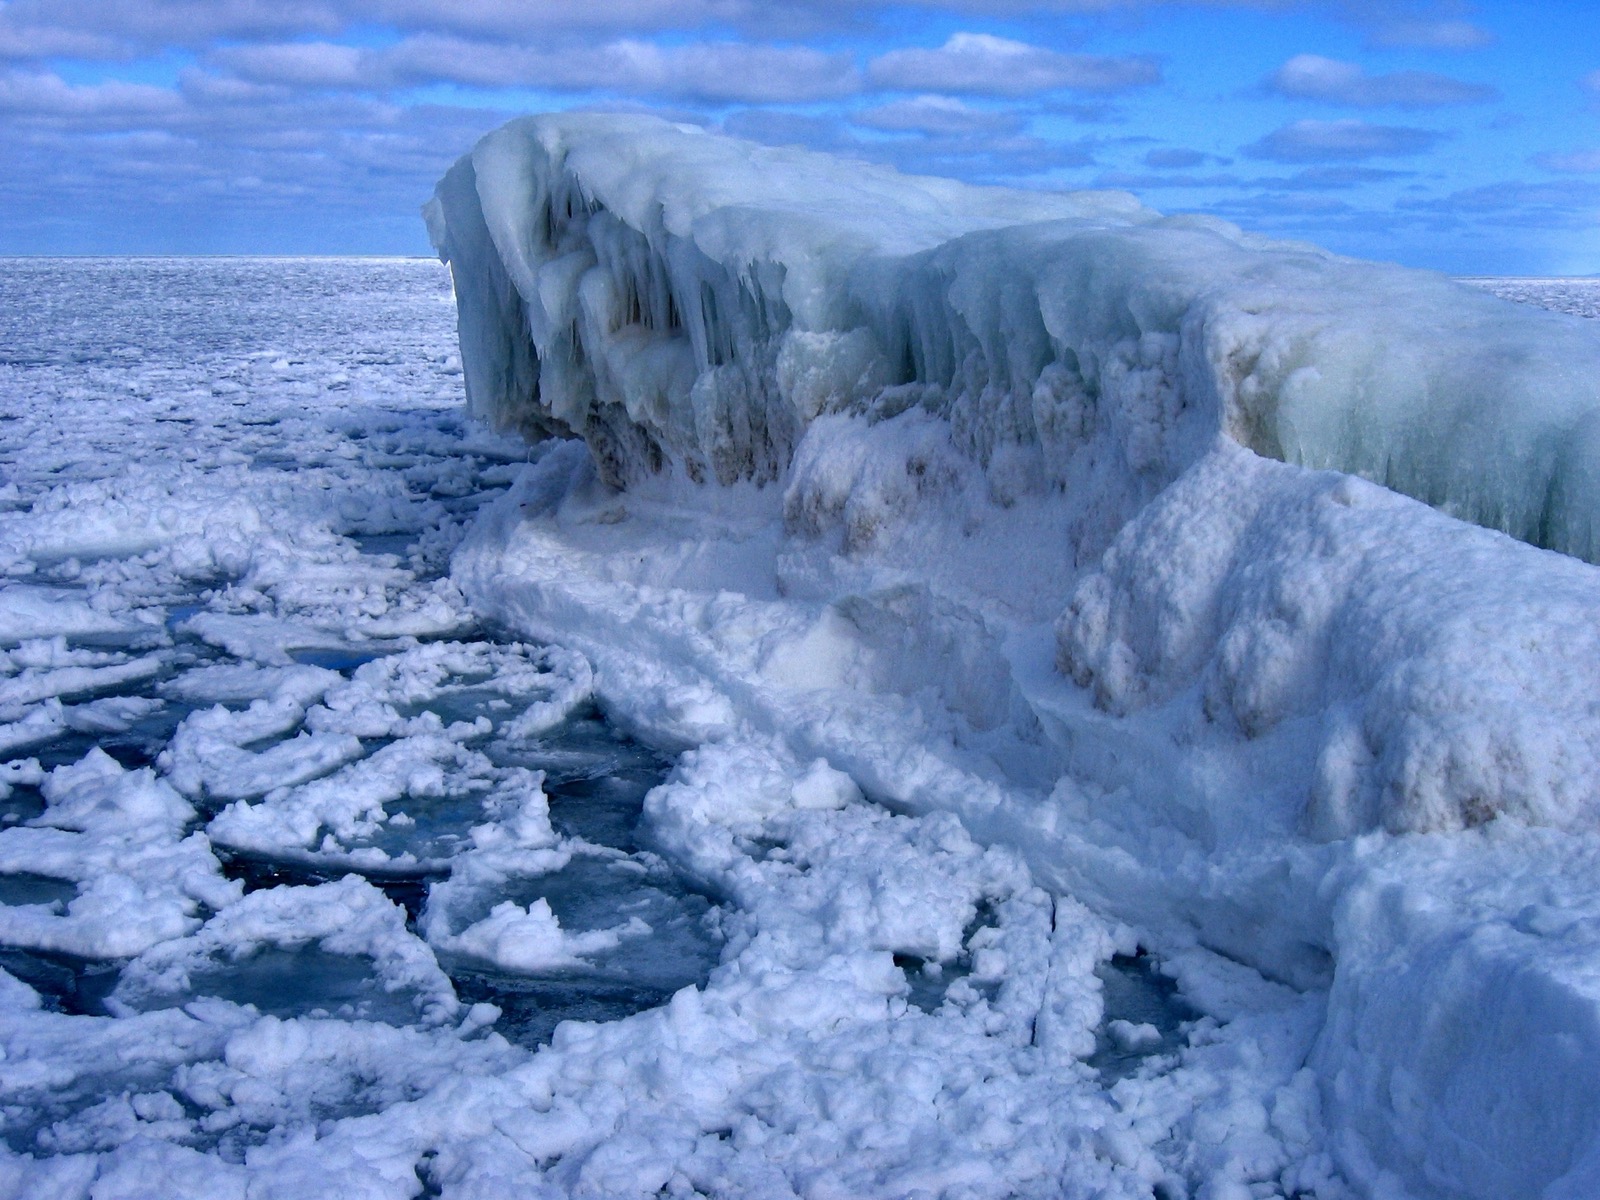
A wall of shelf ice rising above a lake surface strewn with broken plates of new ice and patches of dark open water, under a blue sky with high cloud
Shelf ice standing above a field of broken new plates, with open water still showing between them. This is the state a lake is in for days or weeks before anybody writes a closing date against it, and it is why two observers on the same shore can pick two different days. “Ice along Lake Superior” — National Park Service, Pictured Rocks National Lakeshore — Public domain
Advertisement
Where the records are

The five states with a freeze record

Of the 116 United States water bodies in the international database with 40 or more usable observations, 40 carry a freeze series, and they sit in five states; nine states have a thaw record. The thaw was the date that paid: it set when the boats went in, when the sporting camps opened, when the ferries ran. The freeze mattered to fewer people, so fewer people wrote it down.

StateWater bodiesRecord startsDeepest recordTypical ice in thereEarliest to latest in the state
Wisconsin171851Lake Monona (166 winters)Dec 15Nov 15 to Jan 9
New York121816Otsego (167 winters)Jan 11Dec 2 to Feb 2
Michigan41852Grand Traverse Bay (122 winters)Feb 10Dec 6 to Feb 10
Minnesota41860Detroit (106 winters)Nov 22Nov 22 to Dec 2
Iowa31916East Okoboji Lake (92 winters)Nov 30Nov 30 to Dec 12
The long ones

The deepest freeze records in the country

These two have between them more than three hundred recorded winters, and neither record was started for science. Otsego was kept by a lakeside observer and a university field station; the Madison lakes were kept by a chain of people beginning at the Washburn Observatory who simply wrote the date down every year.

Otsego

Lake in New York · 167 recorded winters, 1850 to 20193 winters open

Jan 11
typical ice in
Jan 19
last 30 recorded winters
Dec 13
earliest, 1917
Feb 25
latest, 1932

Across the whole record the closing date has moved 7 days later per century across the record.

Its ice out has moved 5 days earlier per century across the record, so adding the two lines together this lake’s ice season is about 12 days shorter per century.

3 winters on record it never closed over at all, most recently the one ending in 2017. Those winters are counted separately from the 167 dates above.

1850sJan 81860sJan 61870sJan 51880sJan 101890sJan 141900sJan 121910sJan 131920sJan 101930sJan 221940sJan 121950sJan 181960sJan 111970sJan 101980sJan 121990sJan 242000sJan 182010sJan 20

Mean closing date per decade. Only decades with four or more observations appear, and the scale starts near the shortest bar rather than at January 1 so that small differences stay visible rather than collapsing into one length.
Lake Monona

Lake in Wisconsin · 166 recorded winters, 1851 to 2018

Dec 15
typical ice in
Dec 24
last 30 recorded winters
Nov 23
earliest, 1857
Jan 30
latest, 1932

Across the whole record the closing date has moved 8 days later per century across the record.

Its ice out has moved 12 days earlier per century across the record, so adding the two lines together this lake’s ice season is about 20 days shorter per century.

1850sDec 101860sDec 81870sDec 151880sDec 121890sDec 171900sDec 131910sDec 161920sDec 151930sDec 191940sDec 151950sDec 181960sDec 221970sDec 171980sDec 211990sDec 242000sDec 232010sDec 20

Mean closing date per decade. Only decades with four or more observations appear, and the scale starts near the shortest bar rather than at January 1 so that small differences stay visible rather than collapsing into one length.

Grand Traverse Bay did not close over at all in 44 winters on record, which is 27 percent of the winters in its span, and the eight most recent of those ended in 2006, 2007, 2008, 2010, 2011, 2012, 2016, 2017. The source records those winters rather than leaving them blank, and this page keeps them, because dropping them and averaging only the winters the water did close would bias the record toward an earlier freeze. In Michigan that is the single most important thing the freeze record has to say.

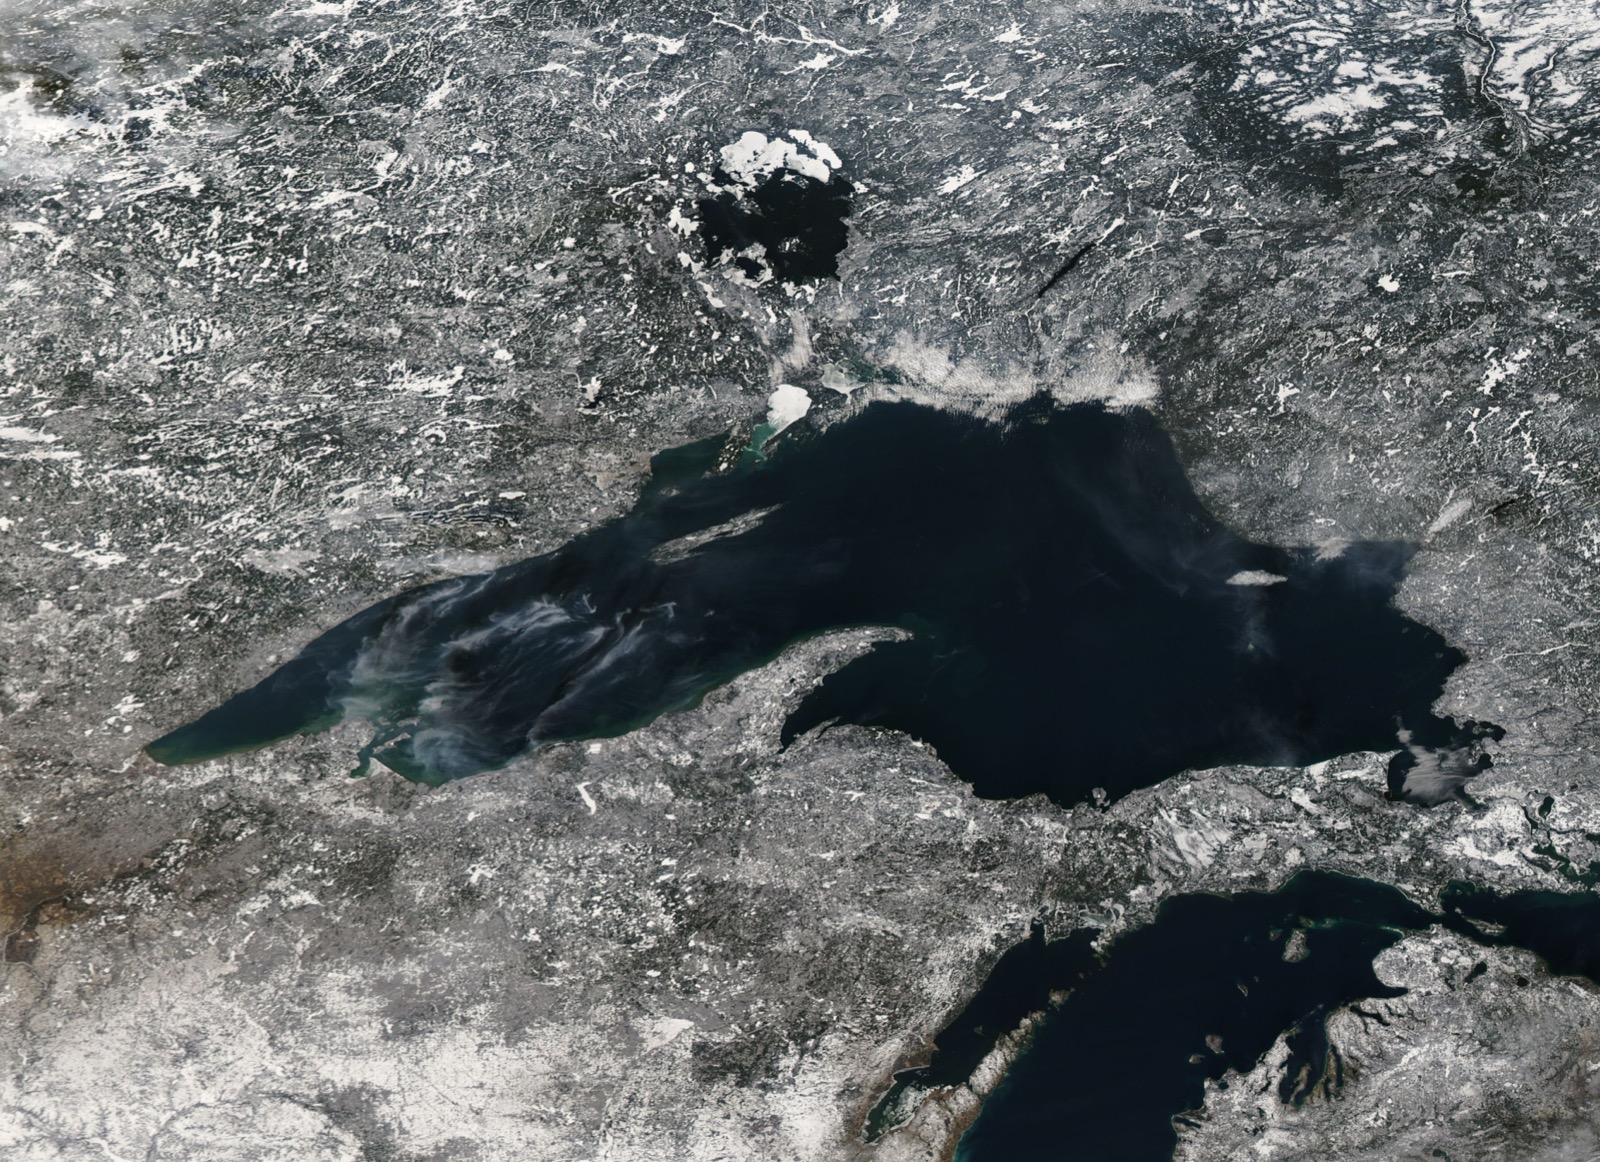
Satellite view of Lake Superior in mid December with the surrounding land under snow, the open lake dark, and pale new ice showing in the shallow western bays
Lake Superior on December 15, with the first ice of that winter forming in the shallow western bays while the deep middle stays open and dark. The Bayfield record on the Wisconsin shore is drawn from exactly this corner, and its typical closing date is January 1. Grand Traverse Bay, the latest typical freeze in this dataset at February 10, is also the water body most likely to record nothing at all: in 44 of its winters it never closed across. “Lake Superior (MODIS 2018-12-20)” — MODIS Land Rapid Response Team, NASA GSFC — Public domain
Other states

States without a freeze record

5 states have a freeze record and a page here; the ice out side covers eight. The difference is the first entry below: Maine, New Hampshire and Massachusetts have long lake ice records on this site that contain no freeze dates at all. The rest are listed with the reason.

Maine, New Hampshire and Massachusetts

All three have a lake ice-out page on this site, and their records are thaw records. The USGS compilation behind the New England thaw dates is an ice-out report: it collected the day the ice went off 29 lakes and not the day it came on, and no New England water body in the international database carries a freeze series of 40 or more winters. The thaw was the date that mattered commercially, because it set when the boats went in, so the thaw is the date somebody wrote down.

Vermont

Vermont shares Lake Champlain with New York and shares the longest freeze record in the country with it. The international database files that series under New York, so that is where it appears here, and the reader who wants it should follow the New York page. No lake wholly inside Vermont carries a freeze series in either compilation this site is built on.

Alaska

Alaska has one long freeze-up and breakup record in the database and it is the Tanana River at Nenana, watched since 1917 by the Nenana Ice Classic. A river freezing up is a different physical event from a lake closing over, it is driven by current rather than by heat loss from a still surface, and it does not belong in a lake ice-in table. It is a magnificent record and it deserves its own treatment.

The Dakotas, Montana, Idaho, Wyoming, Colorado, Washington

Cold enough for lake ice every winter, and no lake in either compilation. Records exist locally in places, held by lake associations, resorts and individual observers, and none of them has been gathered into a published series.

Everywhere else

Roughly two thirds of the country either does not reliably grow lake ice or has never had anyone write down the date it arrived, so no freeze record exists for it, and the states above are the ones where somebody kept one.

Ice in is the autumn halfThe day a lake closed over in a past winter. Five states, 40 water bodies, 3,402 recorded freezes. You are on it.
Ice out is the spring halfThe day the ice finished leaving in a past spring. Nine states, 116 water bodies, and the oldest single observation in the country, from 1807.
Provenance

Where all of this came from

40 water bodies, 3,402 recorded freezes

Every figure on these pages is derived from the international ice phenology database held at the National Snow and Ice Data Center. These pages cover every United States water body in it with 40 or more usable observations, and the medians, the extremes, the decade means and the least squares trends are computed from those observations. The same generated file feeds the ice out side of the site.

Benson, B., Magnuson, J. and Sharma, S. (2000). Global Lake and River Ice Phenology Database. (G01377, Version 1). Boulder, Colorado USA. National Snow and Ice Data Center. https://doi.org/10.7265/N5W66HP8 Accessed 2026-08-24.

Definitions of ice in genuinely differ between lakes and between observers, and the source says so about its own data. Minnesota requires the whole lake frozen with the cover holding; Wisconsin uses the first date the majority of the surface is estimated to be frozen; the Bayfield series on Lake Superior uses the last boat out of the harbour. Several New York series were re dated by a later compiler to mean first freeze rather than final closing. That matters most when comparing two lakes against each other, and least when comparing one lake against its own past.
Common questions

Lake ice in FAQ

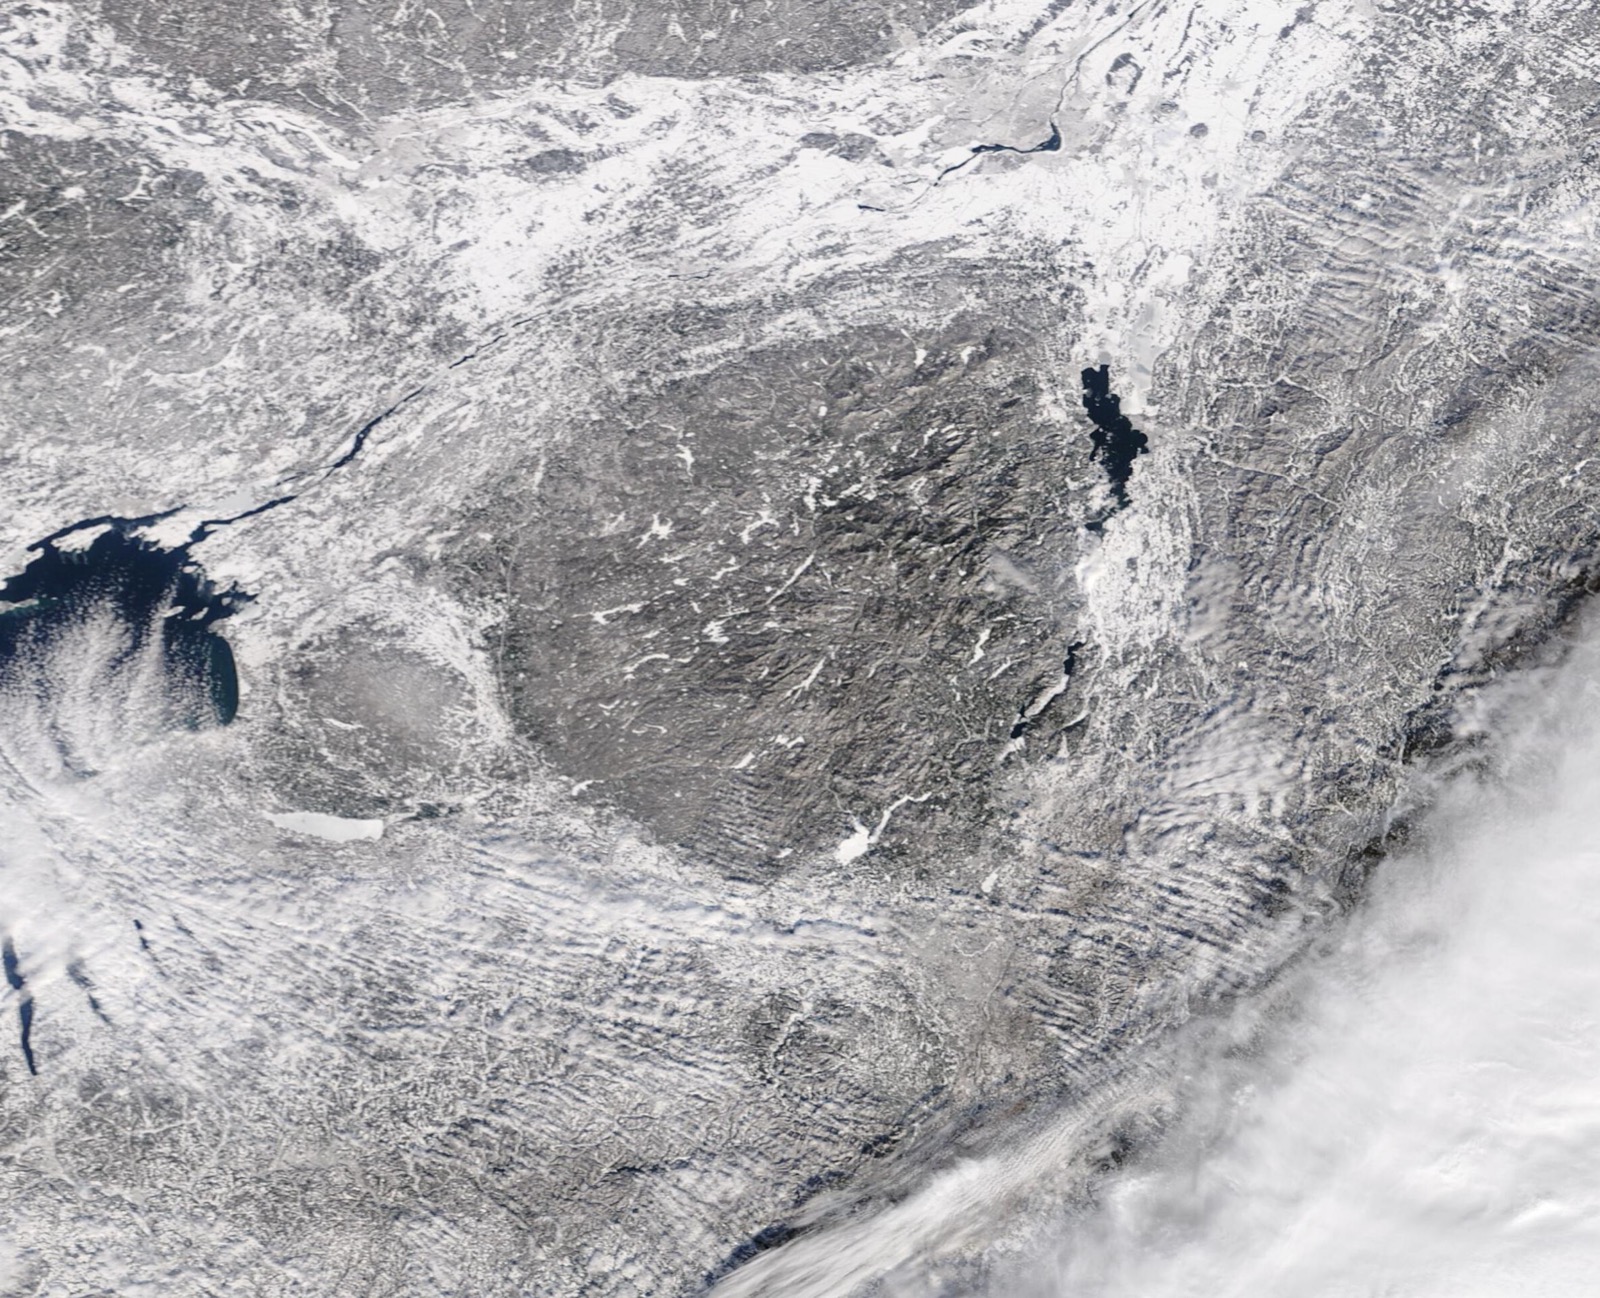
Satellite view of snow covered northern New York in mid January, with the darker Adirondack uplands in the centre and the long narrow shape of Lake Champlain running dark and open down the right hand side
Northern New York on January 20, snow across the whole scene and Lake Champlain still a dark open ribbon down the right. The National Weather Service has kept Champlain’s closing record in Burlington since 1816, and in 42 of those winters the answer it recorded was that the lake never closed at all. “Winter in the Adirondacks (MODIS 2022-01-22)” — MODIS Land Rapid Response Team, NASA GSFC — Public domain
Advertisement

All dates on these pages are historical observations, not forecasts. The most recent observation anywhere in this data is from 2020; for the current winter, each state page links to the agency that publishes it. These pages carry no live measurement and no statement about ice condition or ice strength, and no figure here says a lake is frozen; for anything involving going out on ice, the state agency is the source. Median, earliest, latest, decade mean and change per century are computed from the observations. The other end of the season: lake ice out dates. Related: winter outlook, first snow, lake guides.
Hero image: “Ice on Green Lake” by Wideshpan6, CC BY-SA 4.0
Deepest freeze record here, Otsego: typical ice in January 11 across 167 recorded winters.