
Skip to content
The next seven days, from the live hourly forecast for your own marsh

Waterfowl Hunting Forecast: Which Days the Birds Move

Each day rated Slow, Fair, Good, Great or Prime for duck and goose movement, from the snow on the ground, the freeze counted in days, the front, the wind and the barometer, with the study behind every point.

Your week

Rate the next seven days where you hunt

Enter a ZIP code. The forecast reads the hourly weather for that spot, runs it through the published weather severity index and the flight conditions behind it, and returns a rating, a lead reason and every point for each of the next seven days.

What the ratings mean

A day starts in the middle at 50. Snow and the freeze can carry it up by 34 between them, because those are the two readings that make birds leave. The front, the wind, the sky and the barometer decide whether the birds on hand fly and decoy, and they are held to 20 together.

  • Prime80 and up
  • Great68 and up
  • Good55 and up
  • Fair40 and up
  • Slow0 and up
49
States rated
every state with an open waterfowl season, across 4 flyways
140
NOAA reference points
each with its own 1991 to 2020 freeze normals
124
Duck zones tracked
so a rated day knows which zones are open on it
25
Findings behind the weights
quoted word for word from 6 studies and agency reports
The four flyways

How the season is organised, and what it means for a week

Seasons are set inside four federal flyway frameworks, and each flyway is a north to south corridor. That is the useful thing about them for a forecast: cold arrives at the top of a flyway days or weeks before it reaches the bottom, so a hunter at the south end can watch the week upstream and know what is coming.

FlywayStatesFirst duck dayLast duck dayStates that freeze
AtlanticThe eastern seaboard corridor, Maine to Florida, inland to West Virginia.17Sep 28 in MaineJan 31 in New York14 of 17
MississippiThe continent's busiest duck corridor, following the Mississippi River system.14Sep 26 in MichiganJan 31 in Alabama11 of 14
CentralThe Great Plains corridor from the Dakotas and Montana down through Texas.10Sep 26 in South DakotaJan 31 in Texas10 of 10
PacificThe western corridor from Alaska down the coast states and Great Basin.8Sep 1 in AlaskaJan 31 in Washington8 of 8
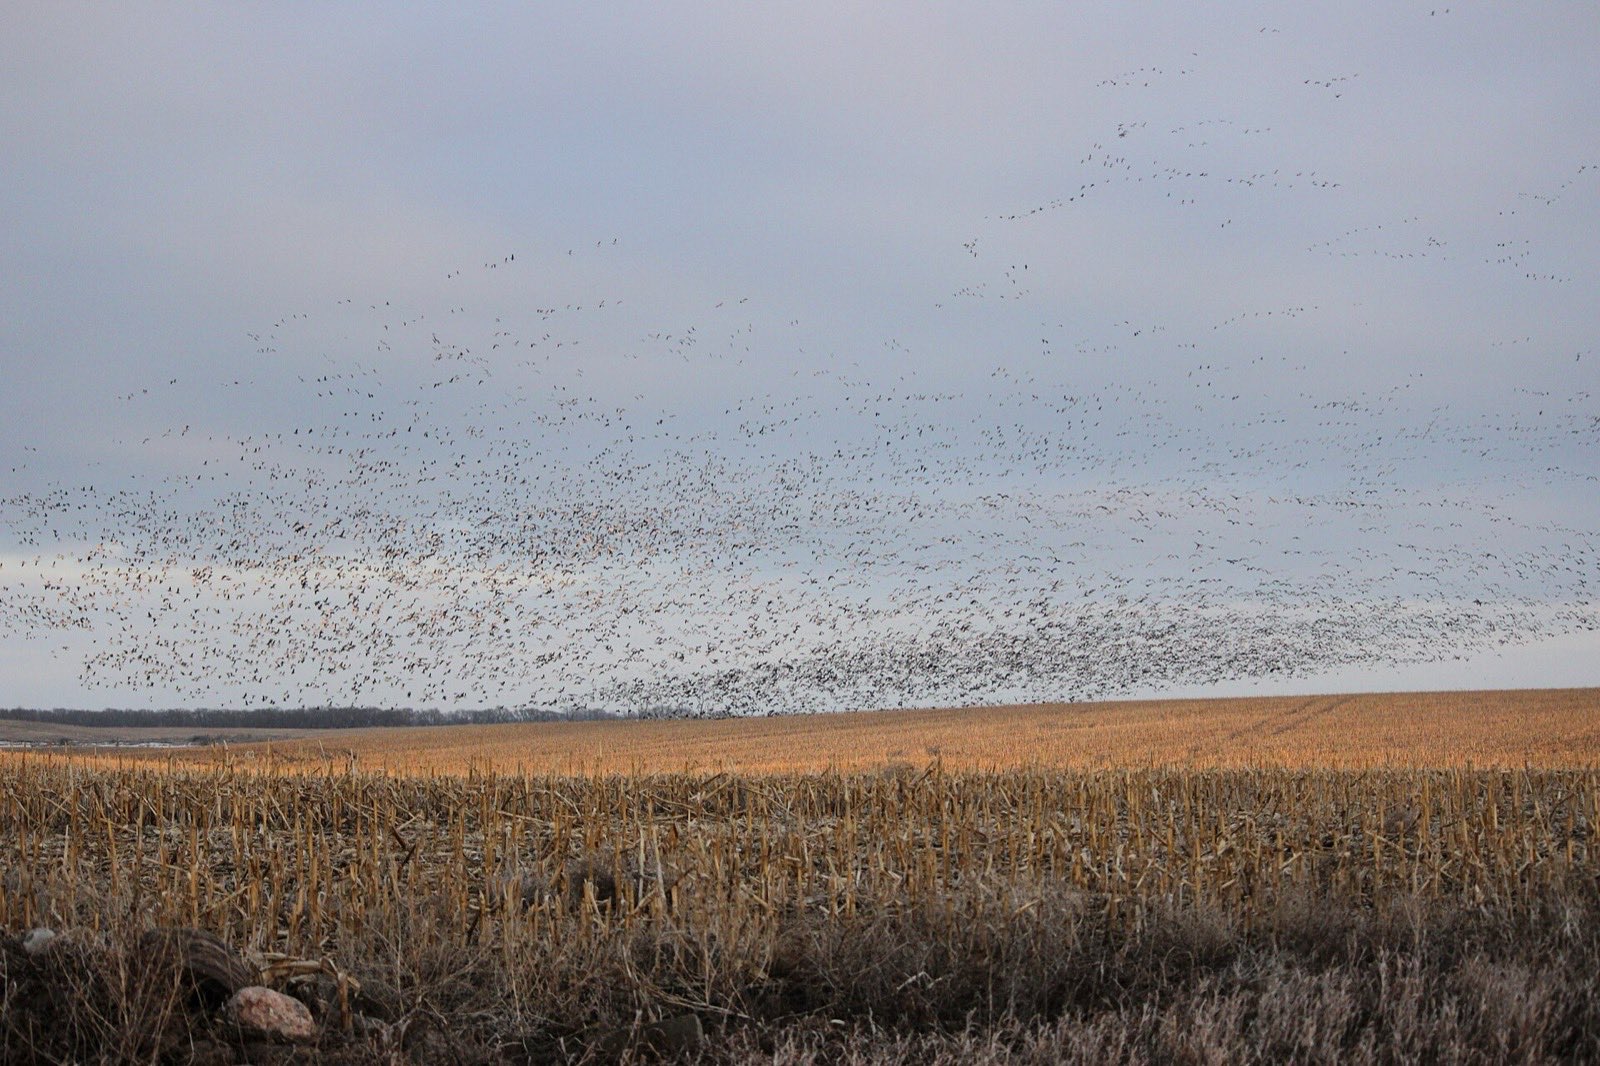
Many thousands of snow geese lifting in a dense cloud off a harvested corn field under a flat grey sky, the stubble running to a dark tree line
A field of snow geese getting up at once. This is what a front looks like from the ground: the pressure falls, the wind swings around behind it, and birds that sat for a week leave together. The forecast rates the day a front crosses, and the two days behind it, higher than anything else in a settled week. “Snow Geese take off from Field (16252334173)” by USFWS Mountain-Prairie, CC BY 2.0
Live, coast to coast

The best morning this week, flyway by flyway

Eight reference points, two to a flyway, one near its northern end and one near its southern. Each is a NOAA climate station rated from its own hourly forecast, so the row shows the push arriving at the top of a flyway before it reaches the bottom. Each links to its state’s full week.

FlywayReference pointBest morning this weekWhat carries itBirds
AtlanticCaribou, MELoads as you scroll––
AtlanticTallahassee, FLLoads as you scroll––
MississippiInternational Falls, MNLoads as you scroll––
MississippiNew Orleans, LALoads as you scroll––
CentralMinot, NDLoads as you scroll––
CentralDallas-Fort Worth, TXLoads as you scroll––
PacificFairbanks, AKLoads as you scroll––
PacificSacramento, CALoads as you scroll––
Advertisement
The research

What moves waterfowl, and how much

The order of things is settled, and it is not the order the lore uses. Snow on the ground comes first, then the cold counted over consecutive days. A weather severity index built on exactly those two readings explained 40 percent of the change in dabbling duck numbers across eleven autumns in Missouri, and a GPS collar study of midcontinental mallards found two departures in three followed a run of snow days.

Wind direction survives as a flight condition: departing birds pick nights with a tailwind. The barometer ranks near the bottom in both studies, so its 24 hour change is scored at up to 4 points out of 54 and the direction matters more than the number. The moon is shown on every day and scored at zero, because nothing behind this forecast measured it. Each card gives the weight and the sentence that set it.

Snow on the ground moves the most birds

Up to 18 points. Six for a trace, 14 for an inch or more, 18 once that cover has held two days or a fresh half inch fell today.

  • “Our results indicate that among the tested environmental parameters, the dominant environmental driver of departure decision in autumn-migrating mallards was the onset of snow conditions, and secondarily the onset of temperatures close to, or below, the freezing point.”

    Snow first, the freeze second Snow arriving is the strongest driver of a mallard leaving in autumn, and temperatures at or below freezing the next strongest.

  • “Among recorded departures, most were driven by snow days (65%) followed by current temperature (30%).”

    Two departures in three followed snow days Most recorded departures came after consecutive days of snow on the ground, and most of the rest after the day turned cold.

  • “Departure was best predicted (60% accuracy) by a "winter conditions" model containing temperature, and depth and duration of snow cover. Models conditional on wind speed, precipitation, pressure variation, and cloud cover received lower support.”

    Winter conditions ranked first, the barometer last Among collared mallards the best model held temperature with the depth and duration of snow cover, and wind speed, precipitation, pressure change and cloud cover all ranked below it.

  • “MSU and Missouri collaborators found that cumulative effects of snow and temperature, as well as the duration of these events, best explain the rate of change in duck abundance.”

    Snow and cold added up over days What explains the change in duck numbers is snow and temperature accumulated over consecutive days, not one cold morning.

  • “Number of sequential days of snow depth ≥ 2.54 cm (1 inch) experienced by mallard at this location”

    What counts as a snow day A snow day is one of a run of consecutive days with at least an inch of snow on the ground.
The freeze, counted in days

Plus 3 to plus 16 as the cold deepens and holds, and minus 5 to minus 10 on a warm spell with lows above 42 degrees.

  • “Our results indicate that among the tested environmental parameters, the dominant environmental driver of departure decision in autumn-migrating mallards was the onset of snow conditions, and secondarily the onset of temperatures close to, or below, the freezing point.”

    Snow first, the freeze second Snow arriving is the strongest driver of a mallard leaving in autumn, and temperatures at or below freezing the next strongest.

  • “dabbling ducks, including northern pintail, gadwall and green-winged teal, migrate prior to freezing conditions or snow, while mallards generally migrate when freezing temperature and snow persist for several days”

    Early ducks leave ahead of the freeze, mallards after it Pintail, gadwall and green-winged teal move before freezing weather arrives. Mallards generally wait until the freeze and the snow have held for several days.

  • “In the past few years, we have observed that ducks are not migrating to southern latitudes in abundance, or are doing so generally only in the presence of severe weather”

    Big flights need real weather Ducks reach southern latitudes in numbers mainly when severe weather pushes them there.

  • “explained 40% of the variation in change in relative abundance of mallards and other dabbling ducks in Missouri during autumn–winter of 1995–2005.”

    The index explains two fifths of the change The published weather severity index accounted for 40 percent of the change in dabbling duck numbers across eleven autumns and winters in Missouri.

A front arriving, all at once

Up to 12 points when the temperature drop and the wind swinging into the northwest quadrant land on the same day.

  • “The best approximating model of departure probability was our integrated model, which included variables accounting for wind aloft direction favorable for departure (i.e., tailwind), absence of precipitation, and a partially or completely clear sky.”

    A tailwind, dry air and a clear sky The model that best predicted a duck leaving a stopover combined a favourable tailwind aloft, no precipitation, and a partly or completely clear sky.

  • “Our results indicate that among the tested environmental parameters, the dominant environmental driver of departure decision in autumn-migrating mallards was the onset of snow conditions, and secondarily the onset of temperatures close to, or below, the freezing point.”

    Snow first, the freeze second Snow arriving is the strongest driver of a mallard leaving in autumn, and temperatures at or below freezing the next strongest.

  • “MSU and Missouri collaborators found that cumulative effects of snow and temperature, as well as the duration of these events, best explain the rate of change in duck abundance.”

    Snow and cold added up over days What explains the change in duck numbers is snow and temperature accumulated over consecutive days, not one cold morning.

A north wind is a tailwind

Plus 10 on a wind out of the north or northwest, plus 6 on a west or northeast wind, minus 8 on a wind out of the south.

  • “Tailwind was documented as the primary weather condition affecting the propensity for migration in many bird species, including ducks, due to its substantial effect on the net energetic cost of migration”

    The wind pays for the flight Tailwind is the flight condition that matters most across migrating birds, because it decides what the journey costs.

  • “The best approximating model of departure probability was our integrated model, which included variables accounting for wind aloft direction favorable for departure (i.e., tailwind), absence of precipitation, and a partially or completely clear sky.”

    A tailwind, dry air and a clear sky The model that best predicted a duck leaving a stopover combined a favourable tailwind aloft, no precipitation, and a partly or completely clear sky.

  • “Flight weather is a prominent migration driver in passerines, but with the notable exception of wind direction, it plays less of a role in waterfowl.”

    Wind direction is the one flight factor that carries Flight weather drives songbird migration more than it drives waterfowl, and wind direction is the exception that still counts.

Enough wind to break the water

Ours, not the research: plus 4 to plus 8 from 8 to 25 miles an hour, minus 6 on a slick calm morning and minus 6 above 35.

  • “Flight weather is a prominent migration driver in passerines, but with the notable exception of wind direction, it plays less of a role in waterfowl.”

    Wind direction is the one flight factor that carries Flight weather drives songbird migration more than it drives waterfowl, and wind direction is the exception that still counts.

A clear sky and no rain

Plus 3 to plus 6 under a sky 80 percent clear or better with nothing falling, minus 2 to minus 6 once rain reaches a tenth of an inch.

  • “The best approximating model of departure probability was our integrated model, which included variables accounting for wind aloft direction favorable for departure (i.e., tailwind), absence of precipitation, and a partially or completely clear sky.”

    A tailwind, dry air and a clear sky The model that best predicted a duck leaving a stopover combined a favourable tailwind aloft, no precipitation, and a partly or completely clear sky.

  • “The integrated model accounted for all model weight in the candidate set and explained 55% of the variation in departure probability. Estimated probability of departure was 0.76 after parameterizing the best model with favorable conditions for all covariates.”

    Three chances in four on the right night With every one of those conditions favourable, the estimated probability a duck departed was 0.76, and the model explained 55 percent of the variation.

  • “Departure was best predicted (60% accuracy) by a "winter conditions" model containing temperature, and depth and duration of snow cover. Models conditional on wind speed, precipitation, pressure variation, and cloud cover received lower support.”

    Winter conditions ranked first, the barometer last Among collared mallards the best model held temperature with the depth and duration of snow cover, and wind speed, precipitation, pressure change and cloud cover all ranked below it.

The barometer, last

Up to 4 points on a 24 hour change: 4 when it has climbed 4 millibars behind a front, 2 when it has fallen 4 ahead of one.

  • “Moreover, Pearse (2007) reported that winter temperature and landscape snow coverage in mid– North America were more important in explaining variation in waterfowl abundance in the Mississippi Alluvial Valley, USA, than variables measuring winter precipitation, barometric pressure, and river levels in this region.”

    Temperature and snow beat the barometer In the same region, winter temperature and snow cover explained more of the change in waterfowl numbers than barometric pressure, precipitation or river levels did.

  • “Departure was best predicted (60% accuracy) by a "winter conditions" model containing temperature, and depth and duration of snow cover. Models conditional on wind speed, precipitation, pressure variation, and cloud cover received lower support.”

    Winter conditions ranked first, the barometer last Among collared mallards the best model held temperature with the depth and duration of snow cover, and wind speed, precipitation, pressure change and cloud cover all ranked below it.

The moon is shown, not scored

Zero points. The phase appears on every day for reference, and no study behind this forecast ranked it among the drivers of a departure.

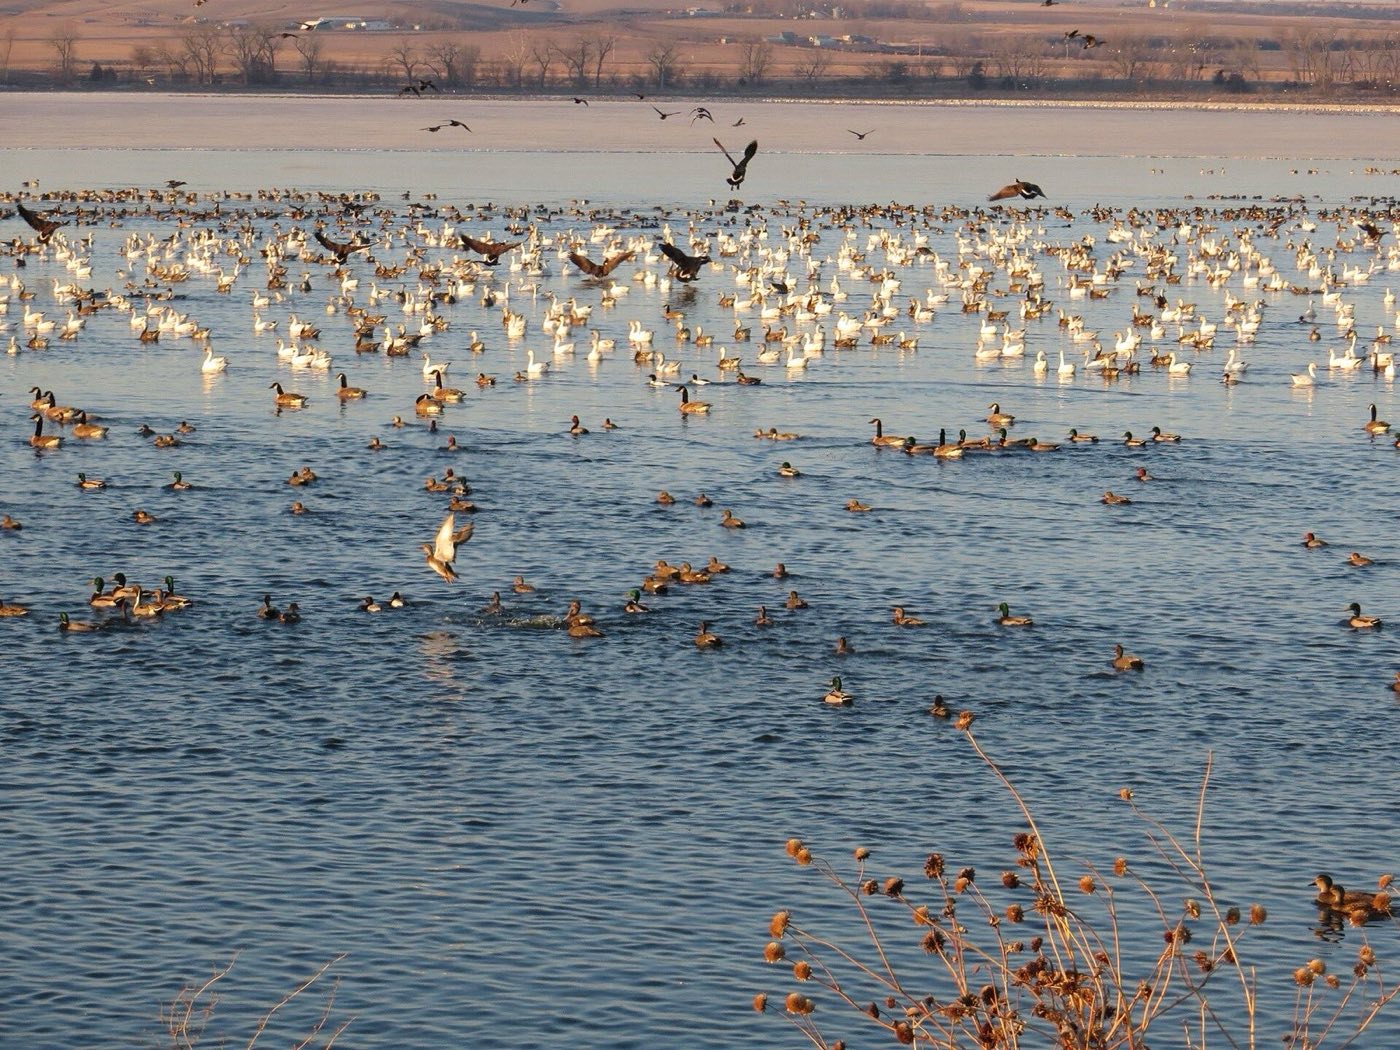
    Hundreds of mallards, snow geese and Canada geese rafted on open blue water in low sun, with a sheet of ice and a bare farm shoreline across the back of the lake
    Mallards, snow geese and Canada geese packed onto what is left of the open water at Lake Andes in South Dakota, the ice already across the far end. Birds leave on cold and snow, not on the calendar, which is why the forecast carries a running weather severity score beside the week and says what it means for the birds on hand. “Waterfowl on Lake Andes; Lake Andes National Wildlife Refuge (52390894441)”, USFWS Mountain Prairie, Public domain

    The sources

    49 states

    Waterfowl forecasts by state

    Each state page rates the week at its own two or three NOAA reference points, carries the freeze dates those stations publish, names the duck zones open on each rated day, and quotes its own agency where a sentence was quotable. 43 of the 49 states reach a freeze or a 28 degree night in a normal year; the rest get the week on the wind, the front and the sky.

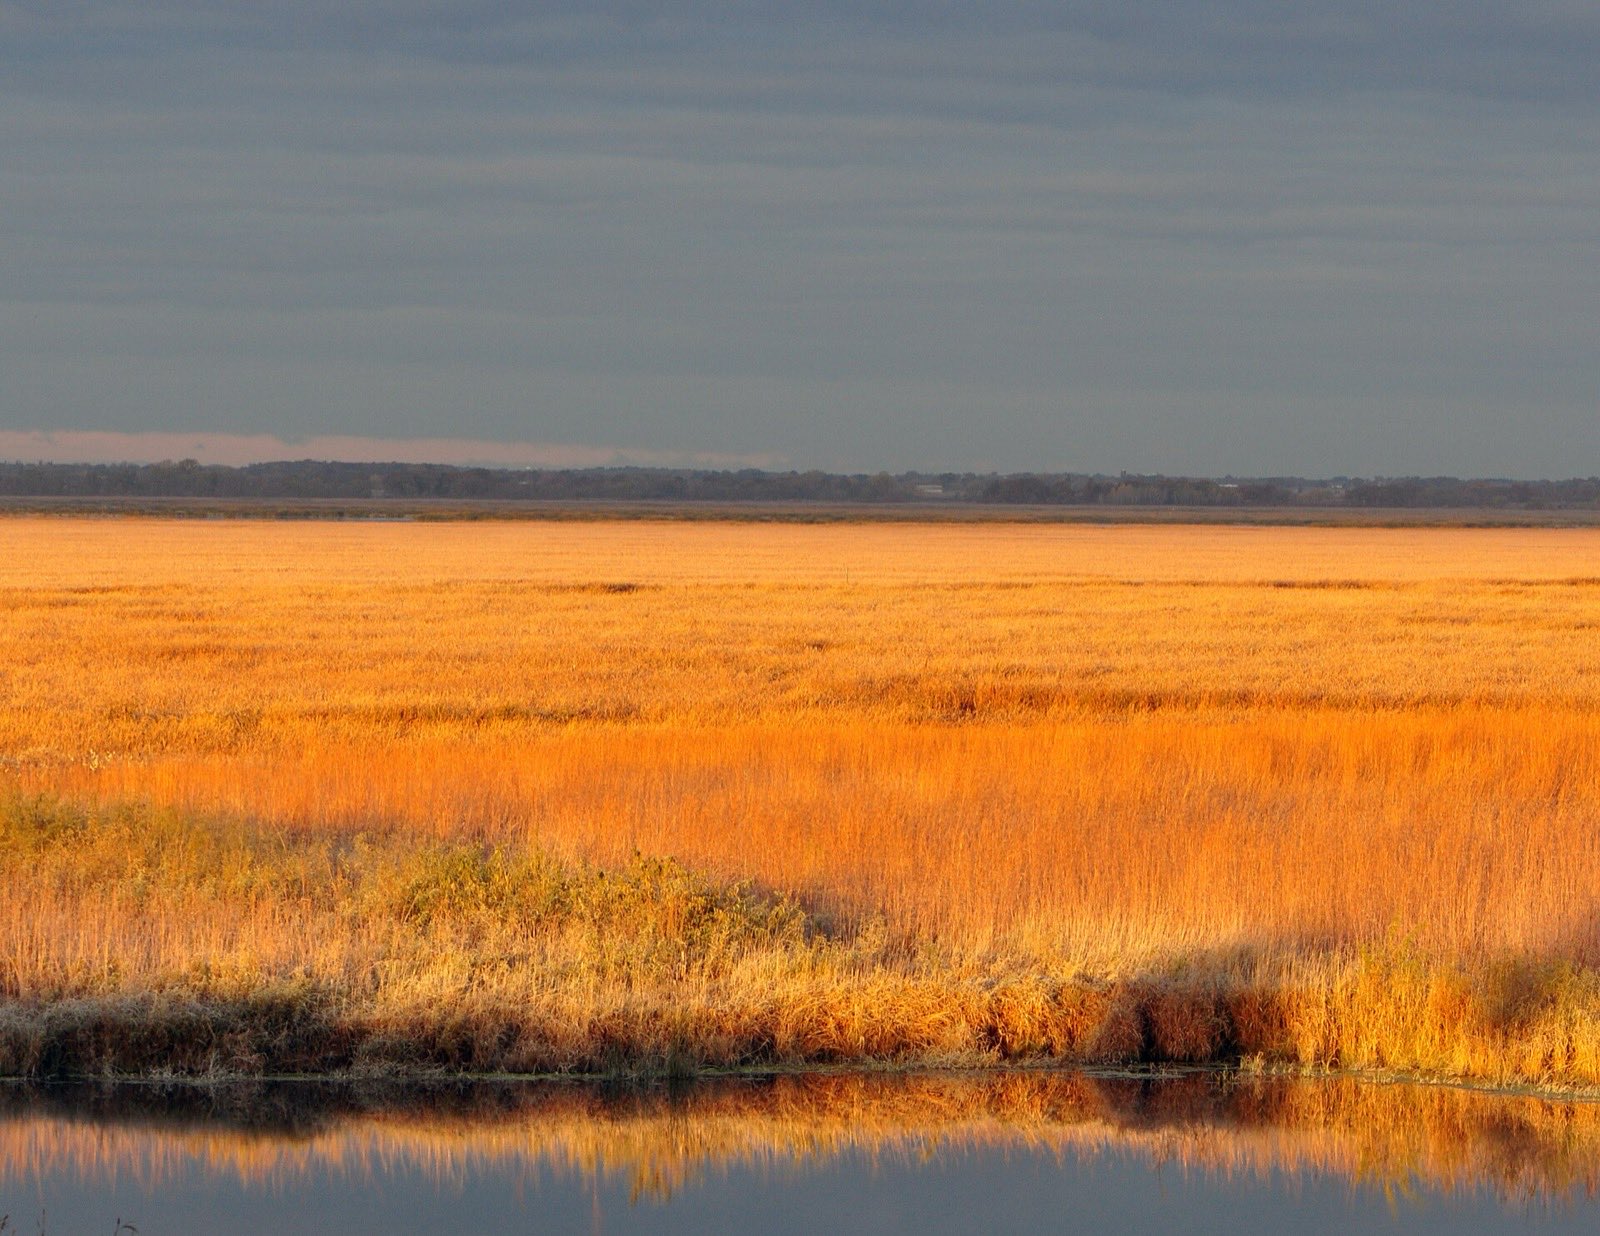
    A wide cattail marsh lit orange by low sun, the stand of reeds running flat to a distant tree line under a grey sky, with still open water and the reeds reflected in the foreground
    First light on the Horicon marsh in Wisconsin. A clear, calm morning like this one scores well for seeing birds and badly for working them: with no wind to hold a decoy spread and nothing pushing from the north, the birds that fly are the ones already here, and they come high. “Marsh of Gold - Horicon National Wildlife Refuge (10476458714)”, U.S. Fish and Wildlife Service - Midwest Region, Public domain

    Waterfowl forecast questions

    Every ZIP code

    The rating works anywhere a duck flies

    A ZIP code in any of the 49 states gets the full seven days, and so does one in Hawaii, which holds no open waterfowl season. The flyway pages carry the same week across every state in a corridor at once:

    • Atlantic Flyway: The Atlantic Flyway runs the seaboard from Maine to Florida and reaches inland to West Virginia.
    • Mississippi Flyway: The Mississippi Flyway follows the river system from the Great Lakes to the Gulf.
    • Central Flyway: The Central Flyway runs the plains from the Dakotas and Montana down through Texas.
    • Pacific Flyway: The Pacific Flyway runs from Alaska down the coast states and through the Great Basin.

    Season dates and zones come from the waterfowl season pages, which quote each agency and record the date each page was read, and the freeze normals from the NOAA 1991 to 2020 daily climate normals, read 2026-11-01. The 2026-27 dates and bag limits that govern are the ones on your own agency’s page. A rating reads the weather, and food, habitat and hunting pressure move birds too.

    More for the season

    Advertisement