
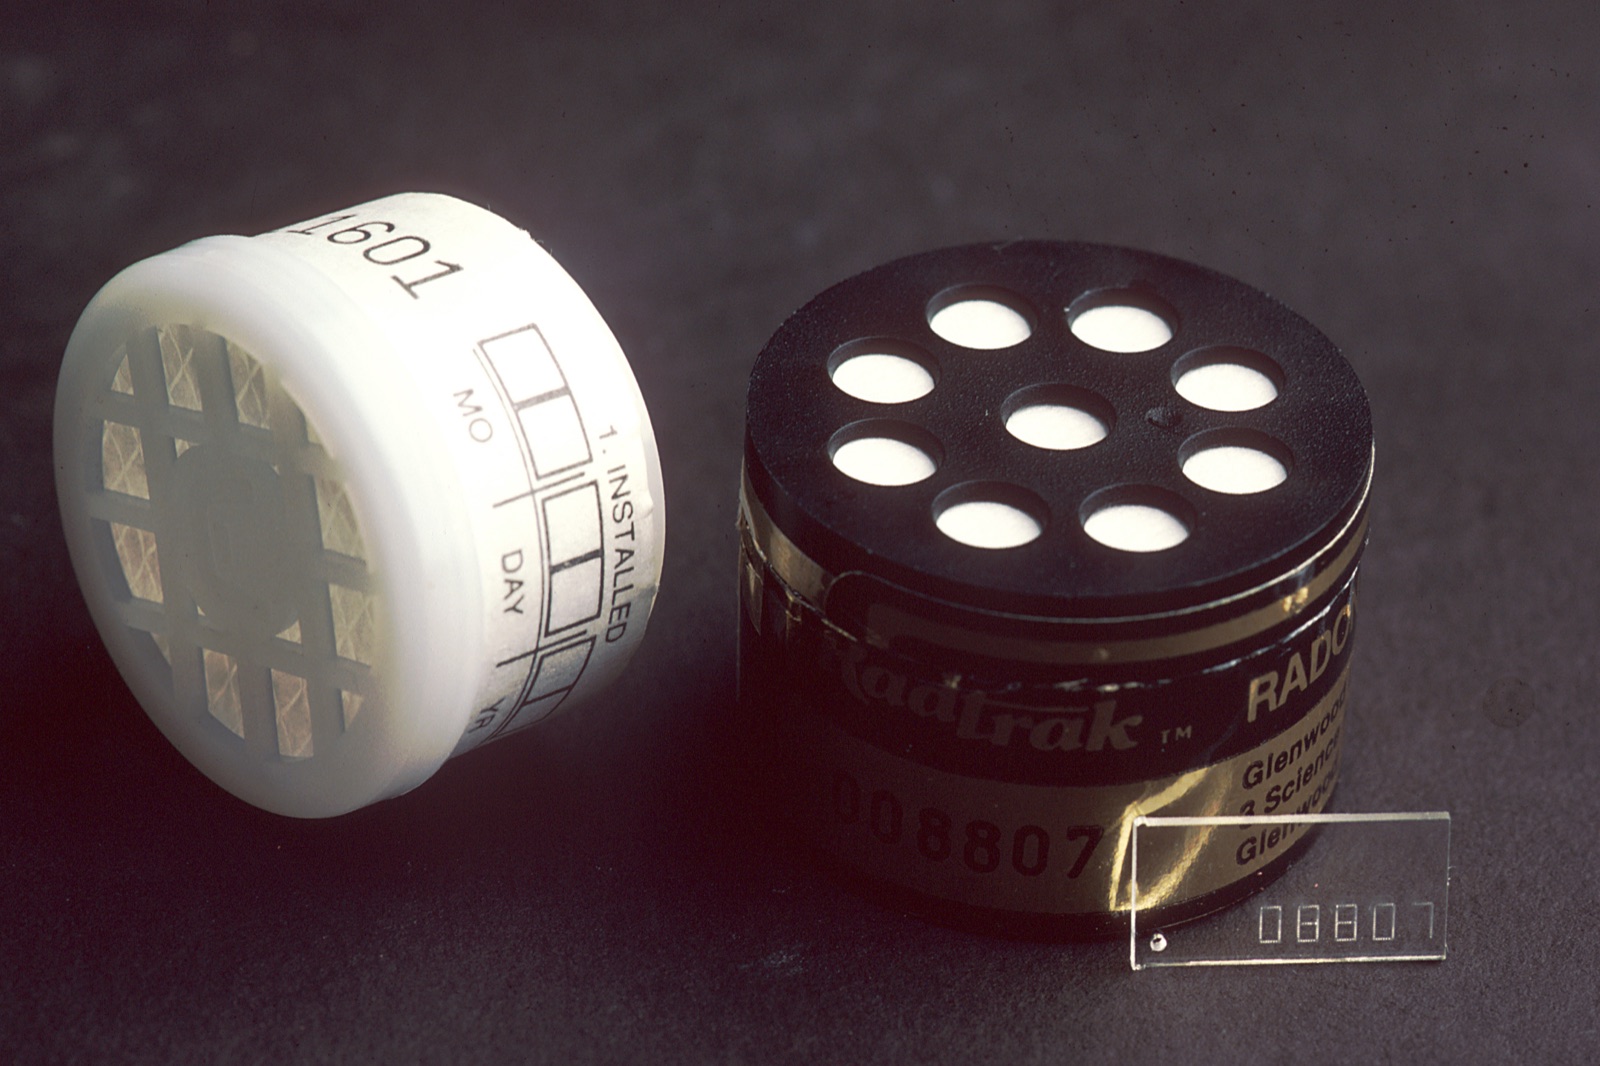
What Radon Zone Am I In?
Enter a ZIP code and get the real answer: every county the ZIP touches, each county's zone on the 1993 EPA Map of Radon Zones with EPA's definition and its test-every-home caveat attached, newer state test data where a state publishes any, and the exact doors to knock on to test.
EPA assigned 3,143 counties to three radon zones in 1993: 1,069 highest, 1,035 moderate, 1,039 low potentialYour county's radon report
ZIP in, every county out, with the vintage and the caveat attachedAbout three ZIPs in ten touch more than one county, and the counties can sit in different zones, so the report shows every county the ZIP touches with its land area share.
One map, three zones, drawn in 1993 and never revised
Everything on this page rests on a single federal dataset, so here is exactly what it is and when it is from, in EPA's words:
EPA, EPA Map of Radon Zones and Supplemental Information“The Map of Radon Zones was developed in 1993 to identify areas of the U.S. with the greatest potential for elevated indoor radon levels based on indoor radon measurement data, geology, aerial radioactivity, soil parameters, and foundation types.”
EPA, Radon Zones Map (accessible text version)“Zone 1 (red zones) Highest potential; average indoor radon levels may be greater than 4 pCi/L (picocuries per liter). Zone 2 (orange zones) Moderate potential; average indoor radon levels may be between 2 and 4 pCi/L. Zone 3 (yellow zones) Low potential; average indoor radon levels may be less than 2 pCi/L.”
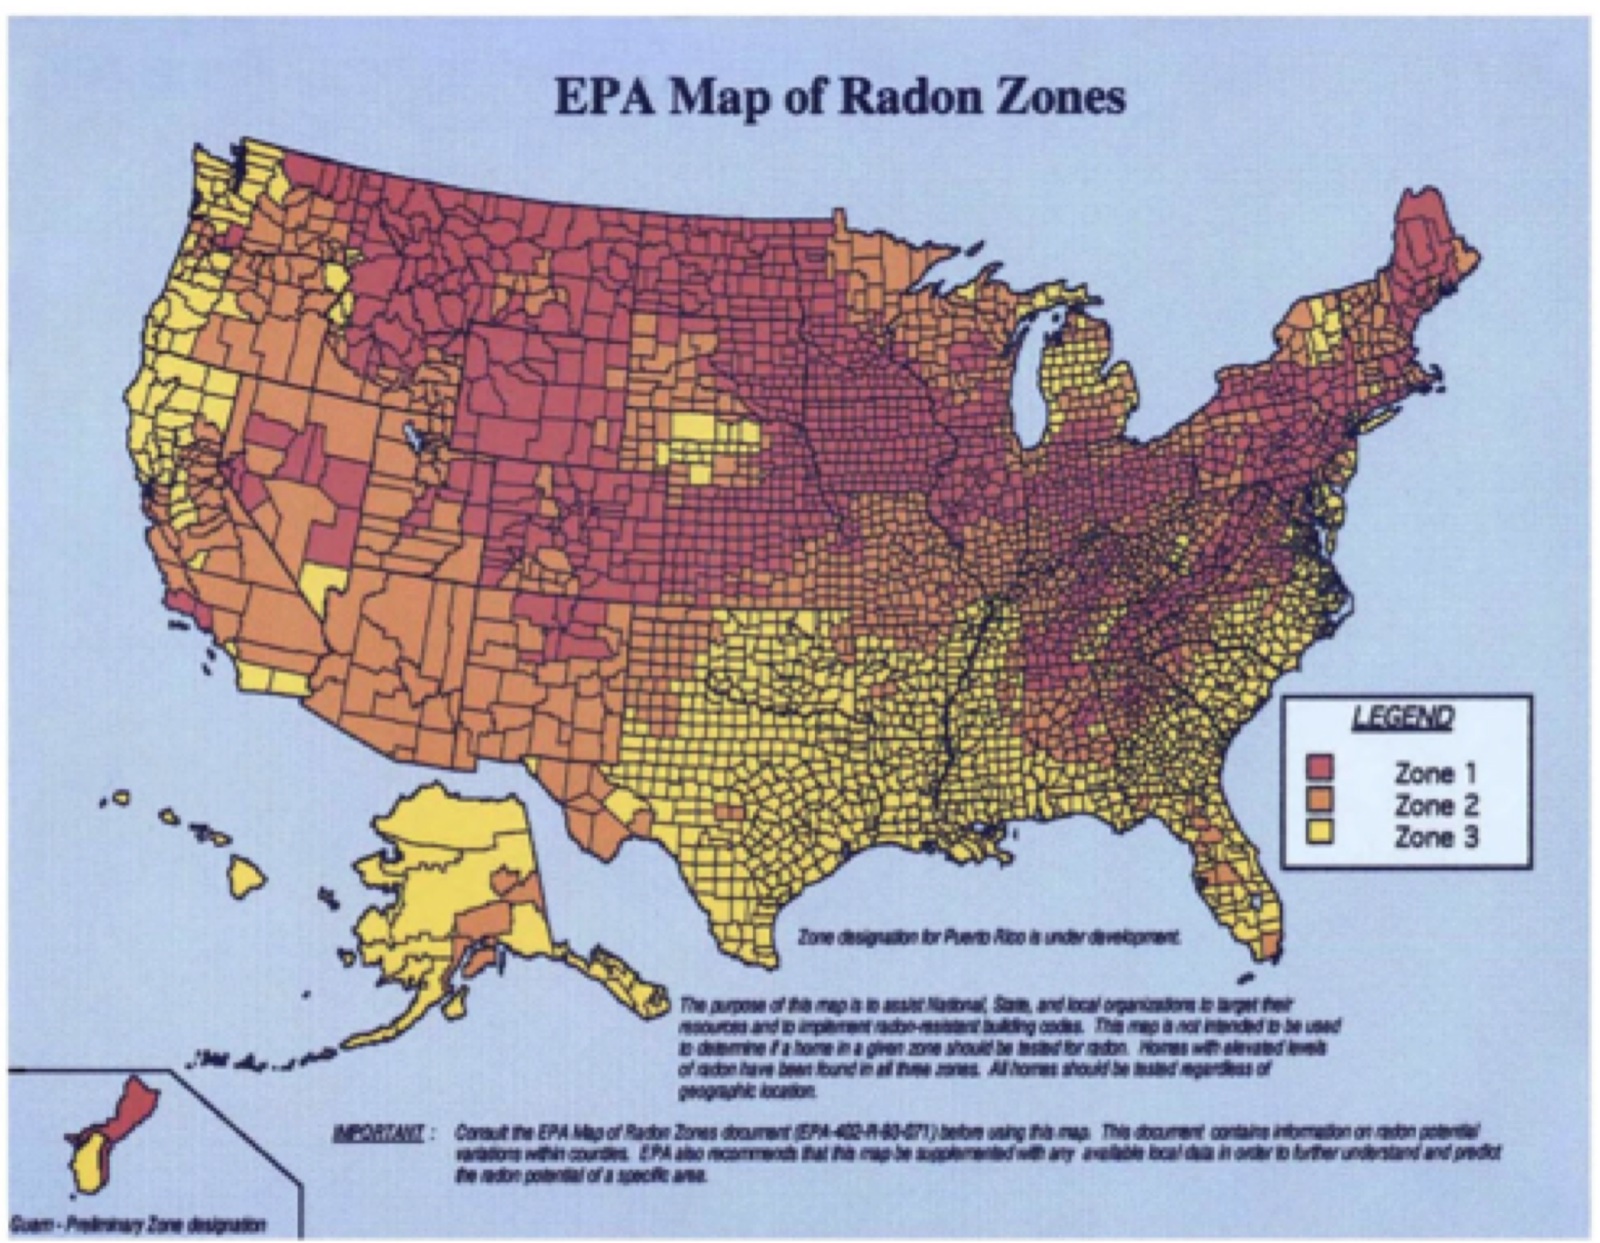
The map's age is a fact we print next to every zone, because a thirty-plus-year-old prediction deserves to be read as one. What has NOT changed since 1993: the geology the zones were largely built from. What has: county lines (seven current counties postdate the map and inherit zones from their predecessors, flagged wherever they appear), the amount of actual test data (millions of tests since), and EPA's framing, which now leads with the caveat:
EPA, Radon Zones Map (accessible text version)“The map should not be used to determine if a home in a given zone should be tested for radon. Homes with elevated levels of radon have been found in all three zones. All homes should be tested for radon.”
Our county assignments come from EPA's own map service, the one behind EPA's current interactive map, fetched 2026-09-02. We audited it against EPA's downloadable zone spreadsheet and found eight counties where EPA's two publications disagree. Six could be checked against EPA's published state map PDFs and the map service was right all six times; the last two, Ketchikan Gateway in Alaska and Somerset in Maryland, are clipped off the edge of their state PDFs, so this site shows both values for those two counties rather than picking one.
Summarised from EPA geodata radon zones map service in our own words.
All 50 states, ranked by share of Zone 1 counties
Iowa and North Dakota are the only states where every county is Zone 1. 12 states have no Zone 1 county at all (Alaska, Arizona, Arkansas, Delaware, Florida, Hawaii, Louisiana, Mississippi, Oklahoma, Oregon, Texas, Vermont), and EPA's testing advice is identical in all of them, which tells you how to read this table: as a map of where the odds run high, never as permission to skip the test.
| State | Counties | Zone 1 | Zone 2 | Zone 3 | Zone mix |
|---|---|---|---|---|---|
| Iowa | 99 | 99 | 0 | 0 | |
| North Dakota | 53 | 53 | 0 | 0 | |
| Wyoming | 23 | 21 | 2 | 0 | |
| Montana | 56 | 49 | 7 | 0 | |
| Colorado | 64 | 52 | 12 | 0 | |
| Minnesota | 87 | 68 | 19 | 0 | |
| Maine | 16 | 12 | 4 | 0 | |
| Pennsylvania | 67 | 49 | 17 | 1 | |
| South Dakota | 66 | 48 | 18 | 0 | |
| Indiana | 92 | 57 | 35 | 0 | |
| Kansas | 105 | 65 | 40 | 0 | |
| Ohio | 88 | 53 | 35 | 0 | |
| Nebraska | 93 | 53 | 24 | 16 | |
| Illinois | 102 | 56 | 43 | 3 | |
| New York | 62 | 34 | 13 | 15 | |
| Nevada | 17 | 9 | 7 | 1 | |
| Connecticut | 8 | 4 | 3 | 1 | |
| Virginia | 133 | 62 | 29 | 42 | |
| Idaho | 44 | 19 | 20 | 5 | |
| Rhode Island | 5 | 2 | 2 | 1 | |
| Tennessee | 95 | 38 | 32 | 25 | |
| Wisconsin | 72 | 28 | 44 | 0 | |
| West Virginia | 55 | 20 | 29 | 6 | |
| Maryland | 24 | 8 | 8 | 8 | |
| New Jersey | 21 | 7 | 11 | 3 | |
| Kentucky | 120 | 30 | 82 | 8 | |
| Utah | 29 | 7 | 22 | 0 | |
| Massachusetts | 14 | 3 | 10 | 1 | |
| New Mexico | 33 | 7 | 26 | 0 | |
| Alabama | 67 | 13 | 33 | 21 | |
| Washington | 39 | 7 | 14 | 18 | |
| Michigan | 83 | 9 | 32 | 42 | |
| New Hampshire | 10 | 1 | 9 | 0 | |
| Missouri | 115 | 11 | 97 | 7 | |
| North Carolina | 100 | 8 | 31 | 61 | |
| California | 58 | 2 | 29 | 27 | |
| Georgia | 159 | 4 | 55 | 100 | |
| South Carolina | 46 | 1 | 8 | 37 | |
| Alaska | 30 | 0 | 5 | 25 | |
| Arizona | 15 | 0 | 15 | 0 | |
| Arkansas | 75 | 0 | 14 | 61 | |
| Delaware | 3 | 0 | 1 | 2 | |
| Florida | 67 | 0 | 9 | 58 | |
| Hawaii | 5 | 0 | 0 | 5 | |
| Louisiana | 64 | 0 | 0 | 64 | |
| Mississippi | 82 | 0 | 8 | 74 | |
| Oklahoma | 77 | 0 | 9 | 68 | |
| Oregon | 36 | 0 | 21 | 15 | |
| Texas | 254 | 0 | 39 | 215 | |
| Vermont | 14 | 0 | 12 | 2 |
January is the season, and the test wants the windows shut
Radon testing has an actual season, and it is winter. January is National Radon Action Month on EPA's calendar, when most state programs run their free and discounted kit campaigns, and the physics cooperates: a short-term test wants closed-house conditions, which a heated house in January maintains without trying.
EPA, National Radon Action Month Information ("Five Things You Can Do During National Radon Action Month")“Test your home - EPA and the U.S. Surgeon General recommend that all homes in the U.S. be tested for radon. Testing is easy and inexpensive.”
EPA, A Citizen's Guide to Radon“Follow the instructions that come with your test kit. If you are doing a short-term test, close your windows and outside doors and keep them closed as much as possible during the test.”

What the numbers on a result mean is EPA's call, and EPA has published it plainly:
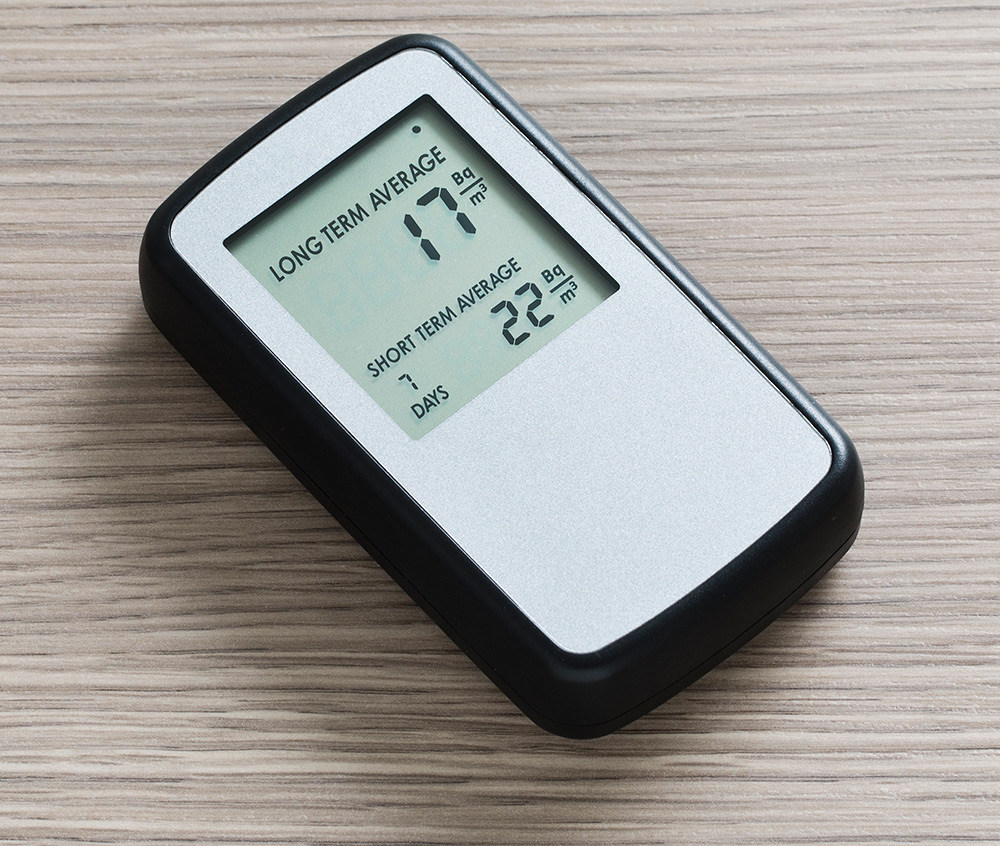
EPA, What is EPA's Action Level for Radon and What Does it Mean?“The EPA recommends homes be fixed if the radon level is 4 pCi/L (picocuries per liter) (150 becquerels per meter cubed (Bq/m3)) or more. Because there is no known safe level of exposure to radon, the EPA also recommends that Americans consider fixing their home for radon levels between 2 pCi/L and 4 pCi/L (75 - 150 Bq/m3).”
EPA, What is EPA's Action Level for Radon and What Does it Mean?“The average indoor radon concentration for America’s homes is about 1.3 pCi/L (50 Bq/m3). It is upon this national average indoor level that the EPA based its estimate of 21,000 radon-related lung cancers a year. The average concentration of radon in outdoor air is .4 pCi/L (15 Bq/m3) or 1/10th of EPA's 4 pCi/L (150 Bq/m3) action level.”
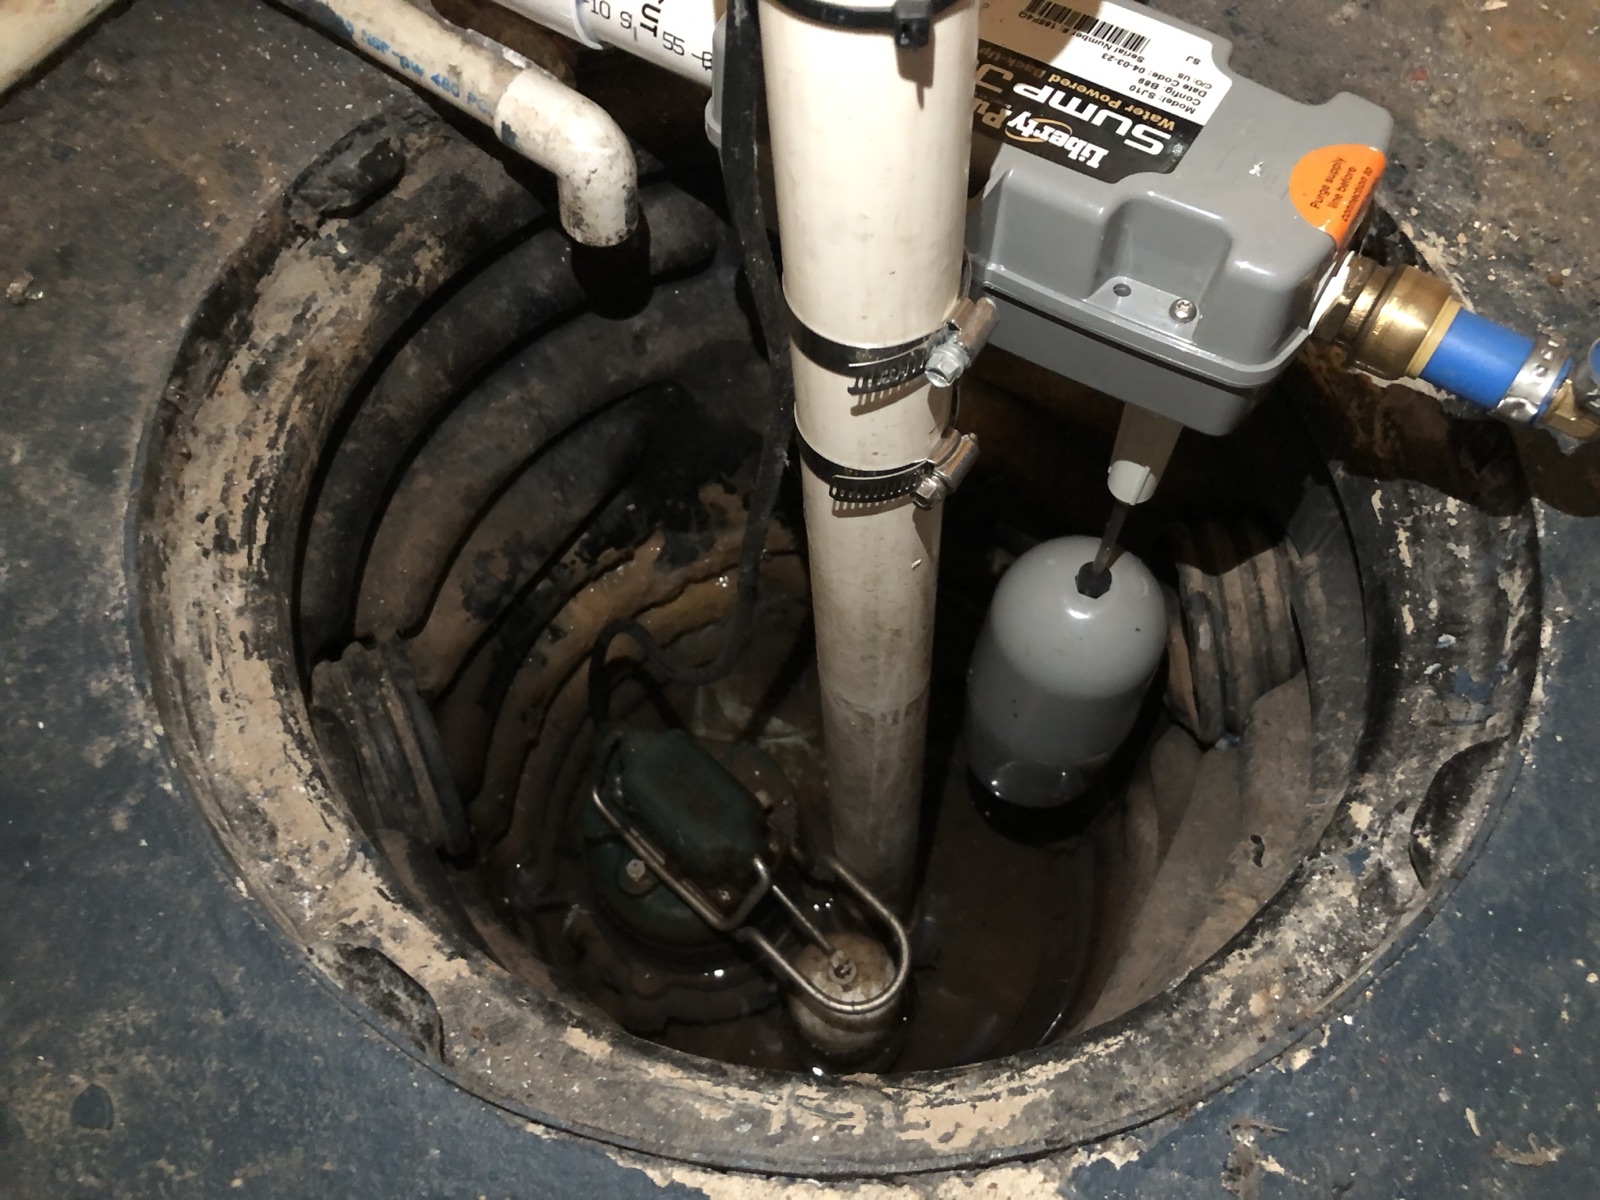
Where radon gets in is the least mysterious part: soil gas moves through whatever openings the foundation offers, and a fix is a pipe and a fan that give it an easier way out. EPA's Citizen's Guide covers testing and its companion guide covers fixing; EPA's test kit and professional finder covers who to call. State programs keep the certified mitigator lists.
The health case, entirely in EPA's words
EPA, Health Risk of Radon“Radon is the number one cause of lung cancer among non-smokers, according to EPA estimates. Overall, radon is the second leading cause of lung cancer. Radon is responsible for about 21,000 lung cancer deaths every year. About 2,900 of these deaths occur among people who have never smoked.”
EPA, National Radon Action Month Information“You can’t see, smell or taste radon, but it could be present at a dangerous level in your home. Radon is the leading cause of lung cancer deaths among nonsmokers in America and claims the lives of about 21,000 Americans each year.”
The rest, including risk tables by smoking status, the BEIR VI report and the 2005 Surgeon General advisory, lives at EPA, Health Risk of Radon. This site adds nothing to it and subtracts nothing from it. Personal risk questions belong with your doctor.
Where the data comes from
Zones. EPA Map of Radon Zones (EPA 402-R-93-071, 1993), county assignments from EPA's map service, cross-checked against EPA's zone spreadsheet and EPA's published state maps. A US Government work in the public domain. ZIP resolution. US Census Bureau 2020 ZCTA to county relationship file, committed to this site, with land area shares. Newer state data. New York State Department of Health county test results (updated 2025-11-18) and counts of the Pennsylvania DEP's posted results (through 2026-07-08), each dated where shown; other states' publications are linked from their pages. Zones describe counties; tests describe homes. Every page keeps those two apart, with no per-home estimate or verdict of its own.