
Radon in Indiana: County Zones and How to Test
Most of Indiana sits in EPA's highest radon potential zone. Enter your ZIP for your county's zone with EPA's own definition and caveat attached, see every county's assignment, and get the state program that will actually help you test.
57 of Indiana's 92 counties are in Zone 1, EPA's highest radon potential category, on the 1993 EPA Map of Radon ZonesYour county's radon report
Every county your ZIP touches, zone, vintage and caveat attachedIndiana has 57 Zone 1 counties and not a single Zone 3, one of only a handful of states with no low-potential county at all. The glaciated center and north and the limestone belt of the south both carry elevated potential. Indianapolis, Fort Wayne and the whole I-70 corridor sit in Zone 1.
Every Indiana county on the 1993 EPA Map of Radon Zones
The zones below are EPA's assignments from the 1993 Map of Radon Zones, which has never been revised, so their vintage is part of the fact. EPA built them from indoor measurements, geology, aerial radioactivity, soil parameters and foundation types, per county, and they predict county averages rather than describing any home.
EPA, Radon Zones Map (accessible text version)“Zone 1 (red zones) Highest potential; average indoor radon levels may be greater than 4 pCi/L (picocuries per liter). Zone 2 (orange zones) Moderate potential; average indoor radon levels may be between 2 and 4 pCi/L. Zone 3 (yellow zones) Low potential; average indoor radon levels may be less than 2 pCi/L.”
57 counties
- Adams County
- Allen County
- Bartholomew County
- Benton County
- Blackford County
- Boone County
- Carroll County
- Cass County
- Clark County
- Clinton County
- Decatur County
- DeKalb County
- Delaware County
- Elkhart County
- Fayette County
- Fountain County
- Fulton County
- Grant County
- Hamilton County
- Hancock County
- Harrison County
- Hendricks County
- Henry County
- Howard County
- Huntington County
- Jay County
- Jennings County
- Johnson County
- Kosciusko County
- LaGrange County
- Lawrence County
- Madison County
- Marion County
- Marshall County
- Miami County
- Monroe County
- Montgomery County
- Noble County
- Orange County
- Putnam County
- Randolph County
- Rush County
- Scott County
- Shelby County
- St. Joseph County
- Steuben County
- Tippecanoe County
- Tipton County
- Union County
- Vermillion County
- Wabash County
- Warren County
- Washington County
- Wayne County
- Wells County
- White County
- Whitley County
35 counties
- Brown County
- Clay County
- Crawford County
- Daviess County
- Dearborn County
- Dubois County
- Floyd County
- Franklin County
- Gibson County
- Greene County
- Jackson County
- Jasper County
- Jefferson County
- Knox County
- Lake County
- LaPorte County
- Martin County
- Morgan County
- Newton County
- Ohio County
- Owen County
- Parke County
- Perry County
- Pike County
- Porter County
- Posey County
- Pulaski County
- Ripley County
- Spencer County
- Starke County
- Sullivan County
- Switzerland County
- Vanderburgh County
- Vigo County
- Warrick County
EPA prints one sentence in bold on every one of its state zone map PDFs, Indiana's included, and it is the right way to leave this table:
EPA, state Maps of Radon Zones (printed on every state map PDF)“All homes should be tested, regardless of zone designation.”
EPA, Radon Zones Map (accessible text version)“The map should not be used to determine if a home in a given zone should be tested for radon. Homes with elevated levels of radon have been found in all three zones. All homes should be tested for radon.”
What Indiana has published since the map
For Indiana, the 1993 EPA zones above are the newest county-level assignment published as data: the state program had no county-level radon test summary published as data as of 2026-09-01. The state program is the place to ask for newer local numbers, and a test of your own home outranks every map ever drawn.
EPA, EPA Map of Radon Zones and Supplemental Information“EPA's Map of Radon Zones can be supplemented with available state-developed or other data to further understand the radon potential for a specific area.”
Testing a Indiana home, in EPA's words and one link to the state
The state program is the practical door: Indiana Department of Environmental Management, Radon Program (contact as listed by EPA, 2026-09-01). Many state programs mail free or discounted test kits, and January, National Radon Action Month on EPA's calendar, is when most of those campaigns run. Winter is also when a short-term test is easiest to run properly, because the test wants the house closed up and winter does that for you.
EPA, A Citizen's Guide to Radon“Follow the instructions that come with your test kit. If you are doing a short-term test, close your windows and outside doors and keep them closed as much as possible during the test.”
EPA, What is EPA's Action Level for Radon and What Does it Mean?“The EPA recommends homes be fixed if the radon level is 4 pCi/L (picocuries per liter) (150 becquerels per meter cubed (Bq/m3)) or more. Because there is no known safe level of exposure to radon, the EPA also recommends that Americans consider fixing their home for radon levels between 2 pCi/L and 4 pCi/L (75 - 150 Bq/m3).”
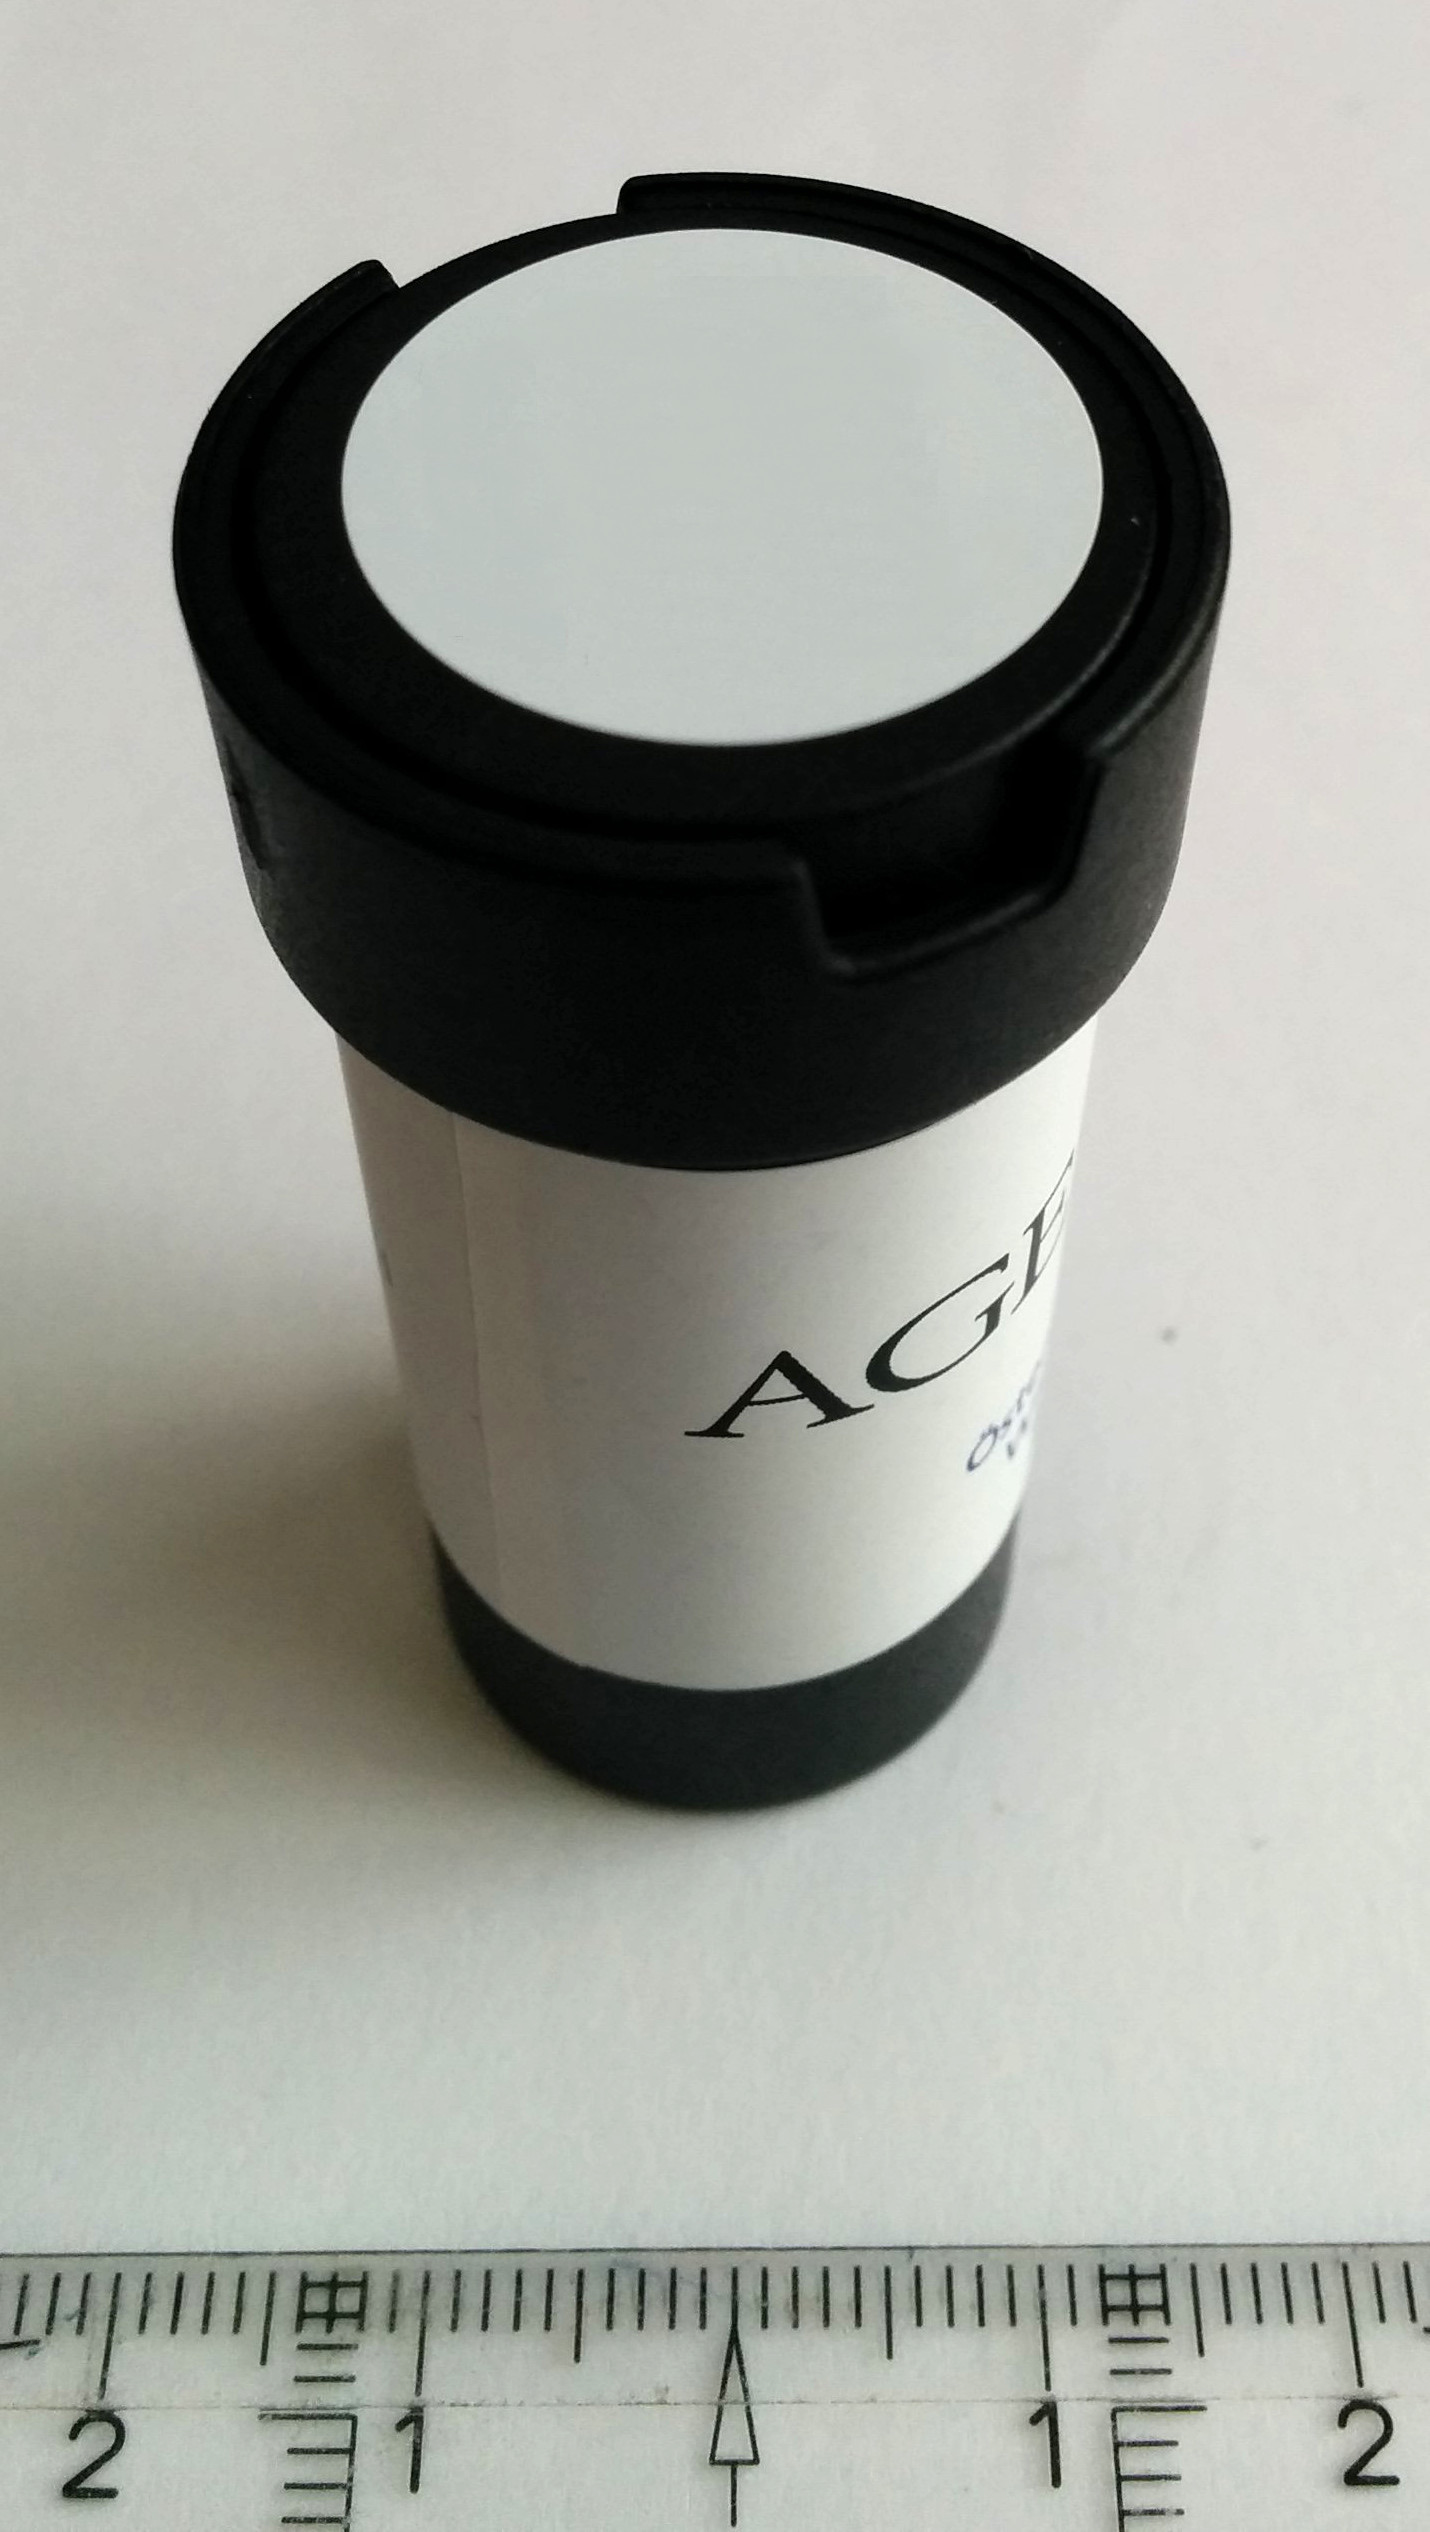
EPA's two testing pages cover the rest: A Citizen's Guide to Radon (EPA 402/K-12/002) and EPA, Find a Radon Test Kit or Measurement and Mitigation Professional. If a test comes back at or above 4.0 pCi/L, the fix is a mitigation system, and the state program keeps the list of certified installers. This site sells nothing and certifies nobody.
The health case, in EPA's words
Health guidance on radon is EPA's. Here it is, verbatim, with the door to the rest of it.
EPA, Health Risk of Radon“Radon is the number one cause of lung cancer among non-smokers, according to EPA estimates. Overall, radon is the second leading cause of lung cancer. Radon is responsible for about 21,000 lung cancer deaths every year. About 2,900 of these deaths occur among people who have never smoked.”
EPA, National Radon Action Month Information“You can’t see, smell or taste radon, but it could be present at a dangerous level in your home. Radon is the leading cause of lung cancer deaths among nonsmokers in America and claims the lives of about 21,000 Americans each year.”
The full picture, including EPA's risk tables by smoking status and the 2005 Surgeon General advisory, is at EPA, Health Risk of Radon. Questions about your own risk belong with your doctor, especially if you smoke or ever did.