
Winter Forecast 2026–27: NOAA's Outlook, Read State by State
The official government winter outlook read onto all 50 states, in plain English, plus first-snow dates, snowfall normals, live snow depth, and what a seasonal forecast means for your winter.
Will it be a snowy winter where you live?
Enter a ZIP code for your state's NOAA tilt, the nearest reference city's normal snowfall, what's on the ground right now, and a straight answer.
NOAA's 2026–27 winter outlook in plain English
Where these tilts come from: Each state's tilt here is read straight off CPC's official Dec–Feb probability map, at the three reference cities listed on that state's page. CPC forecasts by region, not by state: its probability bands cross state lines, so where a state's three cities land in different bands the tilt shows as equal chances. Check any state against CPC's own map. See CPC's official Dec–Feb outlook map →
The background state. El Niño conditions are present and strengthening. In its August 13, 2026 ENSO Diagnostic Discussion, CPC gave a greater than 90% chance of a very strong event during fall and winter 2026–27, and a 69% chance that the October–December season sets a record (+2.5°C or more, 3-month RONI) for any El Niño since 1950. CPC is explicit that impacts consistent with El Niño become more likely with an event this large, but are not guaranteed.
Northeast Dec–Feb
CPC's Dec–Feb map favors a milder-than-normal winter across the whole Northeast, and tilts everything from New Jersey and New York through southern New England and the Green and White Mountains wetter as well. That is the classic strong-El Niño combination: an active storm track up the coast, but marginal cold. Maine and Pennsylvania read as equal chances on precipitation. Translation for snow lovers: storms are likely, the rain/snow line is the whole game, and the interior highlands are the safer snow bet than I-95.
Southeast Dec–Feb
The Southeast carries the strongest precipitation signal in the entire outlook: above-normal probabilities exceed 60% in places, with the wet tilt running up nearly the whole East Coast. Temperature leans milder across most of the region too — Virginia and the Carolinas through Georgia, Alabama, Arkansas and the Tennessee Valley — while Florida, Mississippi and Louisiana read as equal chances. Mild and wet is not a snow recipe, but it is an ice recipe every time a shallow cold shot arrives, which is the Carolina piedmont, north Georgia and the Tennessee Valley story. Kentucky and Tennessee read as equal chances on precipitation.
Midwest Dec–Feb
Every Midwest state is favored milder than normal, with probabilities above 50% across the northern tier — Minnesota, Wisconsin, Michigan, the Dakotas. Precipitation is mostly equal chances: only Michigan carries a below-normal tilt, and only Kansas and Nebraska sit in the wet central-Plains extension. Lake-effect belts still get their snow when the lakes are open and the air is cold enough, but seasonal totals in strong El Niño years have historically run below average here — the shortfall comes from the warmth, not from missing storms. Warm plus wet in the central Plains leans toward more mixed-precipitation events.
Rockies Dec–Feb
Mixed, and split north to south. Montana is the one state in the region favored both milder and drier — the worst combination for snowpack — while Idaho and Wyoming lean milder with equal chances on precipitation. Colorado goes the other way: equal chances on temperature but a tilt toward above-normal precipitation, consistent with a southern-branch storm track that has historically done more for Colorado's southern mountains than its northern ranges. Utah is equal chances on both. Nevada leans milder and wetter.
Southwest Dec–Feb
The wet signal is real: Arizona, New Mexico, Texas and Oklahoma are all tilted toward above-normal precipitation, with probabilities above 50% in southern Arizona and peaking in late winter (Jan–Mar). Temperature is equal chances across Arizona, New Mexico and Texas; only Oklahoma leans milder. For Texas and Oklahoma, wet winters are the ice-storm setup worth preparing for — the cold does not have to be unusual, only timely.
West Dec–Feb
Coastal California is the headline — CPC raised above-normal precipitation odds above 50% for DJF through FMA, citing the wet Februaries of 1998 and 2024 in similar east-Pacific El Niños; California leans milder as well. Oregon and Washington are favored milder than normal with equal chances on precipitation (the usual El Niño dry tilt was deliberately left off the coast). Alaska leans milder, with the strongest warm confidence in the outlook over the southeast panhandle, and reads as equal chances on precipitation at our three reference cities even though the discussion describes a drier mainland pattern. Hawaii is equal chances on both.
Source: NOAA Climate Prediction Center seasonal outlook — official Dec–Feb probability map (GIS polygons) plus the FXUS05 discussion and the ENSO Diagnostic Discussion, issued August 20, 2026 (ENSO Diagnostic Discussion August 13, 2026); next release September 17, 2026. The regional write-ups above are our plain-English read of CPC's Dec–Feb discussion; the per-state tilts in the table below are read from CPC's map, not from the discussion. "Tilt" means CPC shifted the odds toward one category — typically to 33–50%, rarely above 60% — against a 33% climatological baseline. It is not a forecast of what will happen.
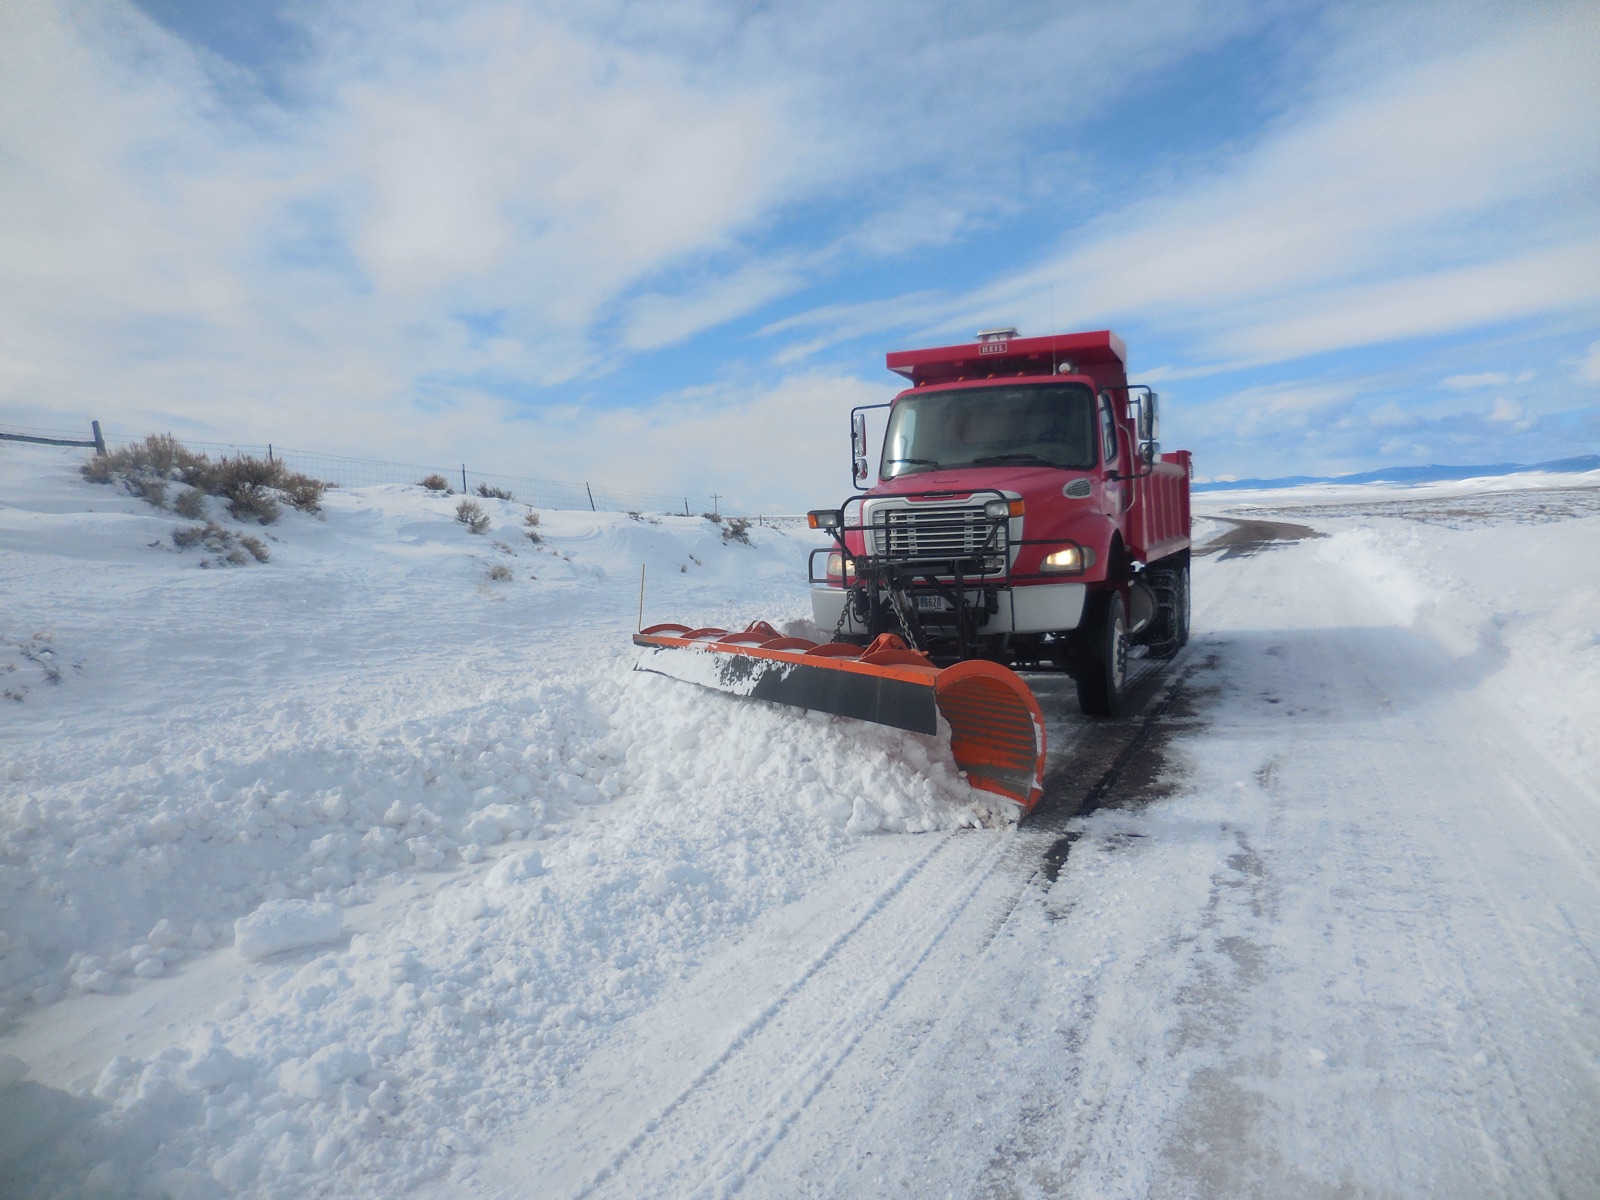
Winter 2026–27 by state: snow, first snow, and CPC's tilt
| State | Avg snowfall (main city) | Typical first snow | Temp tilt | Precip tilt | Ice risk |
|---|---|---|---|---|---|
| Alabama | 1 in · Birmingham | January 20 | Leans milder | Leans wetter | Moderate (3/5) |
| Alaska | 78 in · Anchorage | October 15 | Leans milder | Equal chances | Occasional (2/5) |
| Arizona | rare · Phoenix | — | Equal chances | Leans wetter | Low (1/5) |
| Arkansas | 4 in · Little Rock | December 28 | Leans milder | Leans wetter | Very high (5/5) |
| California | rare · Los Angeles | — | Leans milder | Leans wetter | Low (1/5) |
| Colorado | 49 in · Denver | October 18 | Equal chances | Leans wetter | Low (1/5) |
| Connecticut | 47 in · Hartford | December 8 | Leans milder | Leans wetter | Moderate (3/5) |
| Delaware | 19 in · Wilmington | December 22 | Leans milder | Leans wetter | Moderate (3/5) |
| Florida | rare · Miami | — | Equal chances | Leans wetter | Low (1/5) |
| Georgia | 2 in · Atlanta | January 15 | Leans milder | Leans wetter | Moderate (3/5) |
| Hawaii | rare · Honolulu | — | Equal chances | Equal chances | Low (1/5) |
| Idaho | 18 in · Boise | November 25 | Leans milder | Equal chances | Low (1/5) |
| Illinois | 38 in · Chicago | November 30 | Leans milder | Equal chances | Moderate (3/5) |
| Indiana | 25 in · Indianapolis | December 5 | Leans milder | Equal chances | Moderate (3/5) |
| Iowa | 35 in · Des Moines | November 28 | Leans milder | Equal chances | Moderate (3/5) |
| Kansas | 14 in · Wichita | December 8 | Leans milder | Leans wetter | High (4/5) |
| Kentucky | 12 in · Louisville | December 15 | Leans milder | Equal chances | Very high (5/5) |
| Louisiana | rare · New Orleans | — | Equal chances | Leans wetter | Occasional (2/5) |
| Maine | 62 in · Portland | November 28 | Leans milder | Equal chances | Moderate (3/5) |
| Maryland | 19 in · Baltimore | December 20 | Leans milder | Leans wetter | High (4/5) |
| Massachusetts | 49 in · Boston | December 10 | Leans milder | Leans wetter | Moderate (3/5) |
| Michigan | 45 in · Detroit | November 28 | Leans milder | Leans drier | Moderate (3/5) |
| Minnesota | 52 in · Minneapolis–St. Paul | November 15 | Leans milder | Equal chances | Occasional (2/5) |
| Mississippi | 1 in · Jackson | January 25 | Equal chances | Leans wetter | Moderate (3/5) |
| Missouri | 18 in · St. Louis | December 10 | Leans milder | Equal chances | Very high (5/5) |
| Montana | 55 in · Billings | October 25 | Leans milder | Leans drier | Low (1/5) |
| Nebraska | 27 in · Omaha | November 28 | Leans milder | Leans wetter | Moderate (3/5) |
| Nevada | rare · Las Vegas | — | Leans milder | Leans wetter | Low (1/5) |
| New Hampshire | 61 in · Concord | November 25 | Leans milder | Leans wetter | Moderate (3/5) |
| New Jersey | 29 in · Newark | December 15 | Leans milder | Leans wetter | Moderate (3/5) |
| New Mexico | 9 in · Albuquerque | December 5 | Equal chances | Leans wetter | Low (1/5) |
| New York | 30 in · New York City | December 14 | Leans milder | Leans wetter | Moderate (3/5) |
| North Carolina | 4 in · Charlotte | January 10 | Leans milder | Leans wetter | Very high (5/5) |
| North Dakota | 50 in · Fargo | November 8 | Leans milder | Equal chances | Occasional (2/5) |
| Ohio | 23 in · Columbus | December 5 | Leans milder | Equal chances | Moderate (3/5) |
| Oklahoma | 8 in · Oklahoma City | December 20 | Leans milder | Leans wetter | Very high (5/5) |
| Oregon | 4 in · Portland | December 25 | Leans milder | Equal chances | Occasional (2/5) |
| Pennsylvania | 23 in · Philadelphia | December 18 | Leans milder | Equal chances | Moderate (3/5) |
| Rhode Island | 34 in · Providence | December 12 | Leans milder | Leans wetter | Moderate (3/5) |
| South Carolina | 1 in · Columbia | January 20 | Leans milder | Leans wetter | High (4/5) |
| South Dakota | 42 in · Sioux Falls | November 15 | Leans milder | Equal chances | Occasional (2/5) |
| Tennessee | 5 in · Nashville | January 5 | Leans milder | Equal chances | Very high (5/5) |
| Texas | 2 in · Dallas–Fort Worth | January 10 | Equal chances | Leans wetter | Very high (5/5) |
| Utah | 54 in · Salt Lake City | November 15 | Equal chances | Equal chances | Low (1/5) |
| Vermont | 81 in · Burlington | November 18 | Leans milder | Leans wetter | Moderate (3/5) |
| Virginia | 10 in · Richmond | January 5 | Leans milder | Leans wetter | High (4/5) |
| Washington | 6 in · Seattle | December 20 | Leans milder | Equal chances | Low (1/5) |
| West Virginia | 30 in · Charleston | December 8 | Leans milder | Leans wetter | Moderate (3/5) |
| Wisconsin | 47 in · Milwaukee | November 25 | Leans milder | Equal chances | Occasional (2/5) |
| Wyoming | 60 in · Cheyenne | October 10 | Leans milder | Equal chances | Low (1/5) |
Snowfall and first-snow values are NOAA 1991–2020 normals for each state's largest metro station — not a statewide average, which doesn't exist. Mountain and lake-effect belts run far higher; each state page lists them. The temp and precip columns are taken from CPC's official Dec–Feb probability map at each state's three reference cities, since CPC publishes probabilities by region rather than a call per state.
Where there's snow on the ground right now
Modeled snow depth across a wide view of the Great Lakes and Northeast by default — enter any ZIP to recenter, widen to ~250 miles, or flip to the 7-day snowfall forecast. The full-page version lives at /snow-depth-map.
Modeled snow depth on the ground around Syracuse, NY. This is a weather-model estimate, not a gauge reading: it misses drifts, shaded hollows, and freshly plowed lots. For official observations see NOAA's NOHRSC snow analysis or a nearby SNOTEL site.
Farmers' Almanac vs NOAA: who should you believe?
The almanacs
Published every August with maps of "frigid, snowy" and "mild, wet" regions and sometimes storm dates. The formulas are secret; the claimed 80% accuracy has never survived an independent check. Fun to read, not a planning tool.
NOAA CPC
Probabilities, not adjectives. Built on ENSO state, ocean temperatures, model ensembles, and trends; publicly verified after every season; updated monthly. Modest but real skill for temperature, especially in strong El Niño/La Niña years.
The 30-year normal
For snowfall specifically, your area's 1991–2020 normal beats every seasonal forecast ever published. Use NOAA's tilt to lean, the normal to plan, and the 7-day forecast to decide.
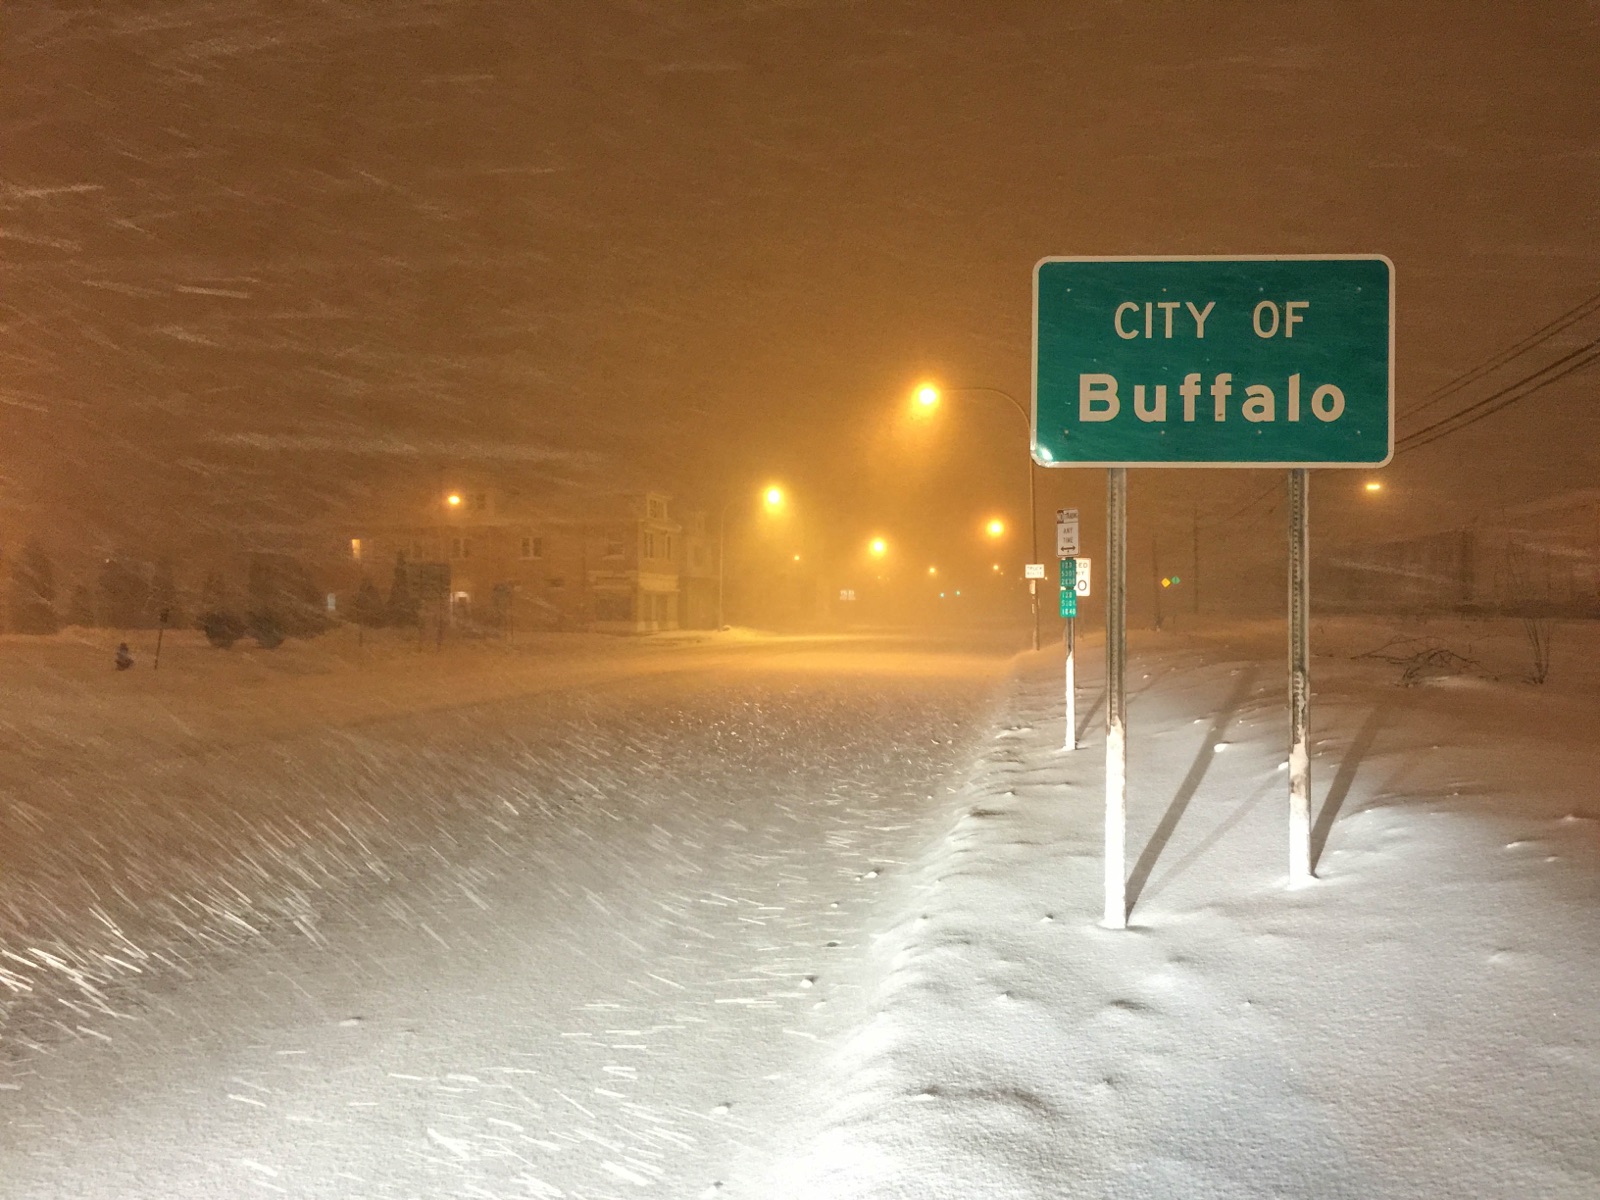
The ice storm belt
Freezing rain needs mild, moist air riding over a thin layer of sub-freezing air at the ground. That happens most often where Gulf moisture meets shallow arctic outbreaks — the Southern Plains, the Ozarks and mid-South, and the Carolina and Virginia Piedmont where cold air dams against the Appalachians. These states rate 4 or 5 on our 5-point freezing-rain scale:
This winter: CPC's map tilts most of this belt — the Southern Plains, the mid-South, and the Piedmont — toward above-normal precipitation. More storms crossing a zone where shallow arctic air is the norm means more chances for freezing rain, even in a winter that leans mild overall: an ice storm needs one cold night, not a cold season. Generators, tree trimming, and a plan for a multi-day outage are worth more here than a snow shovel.
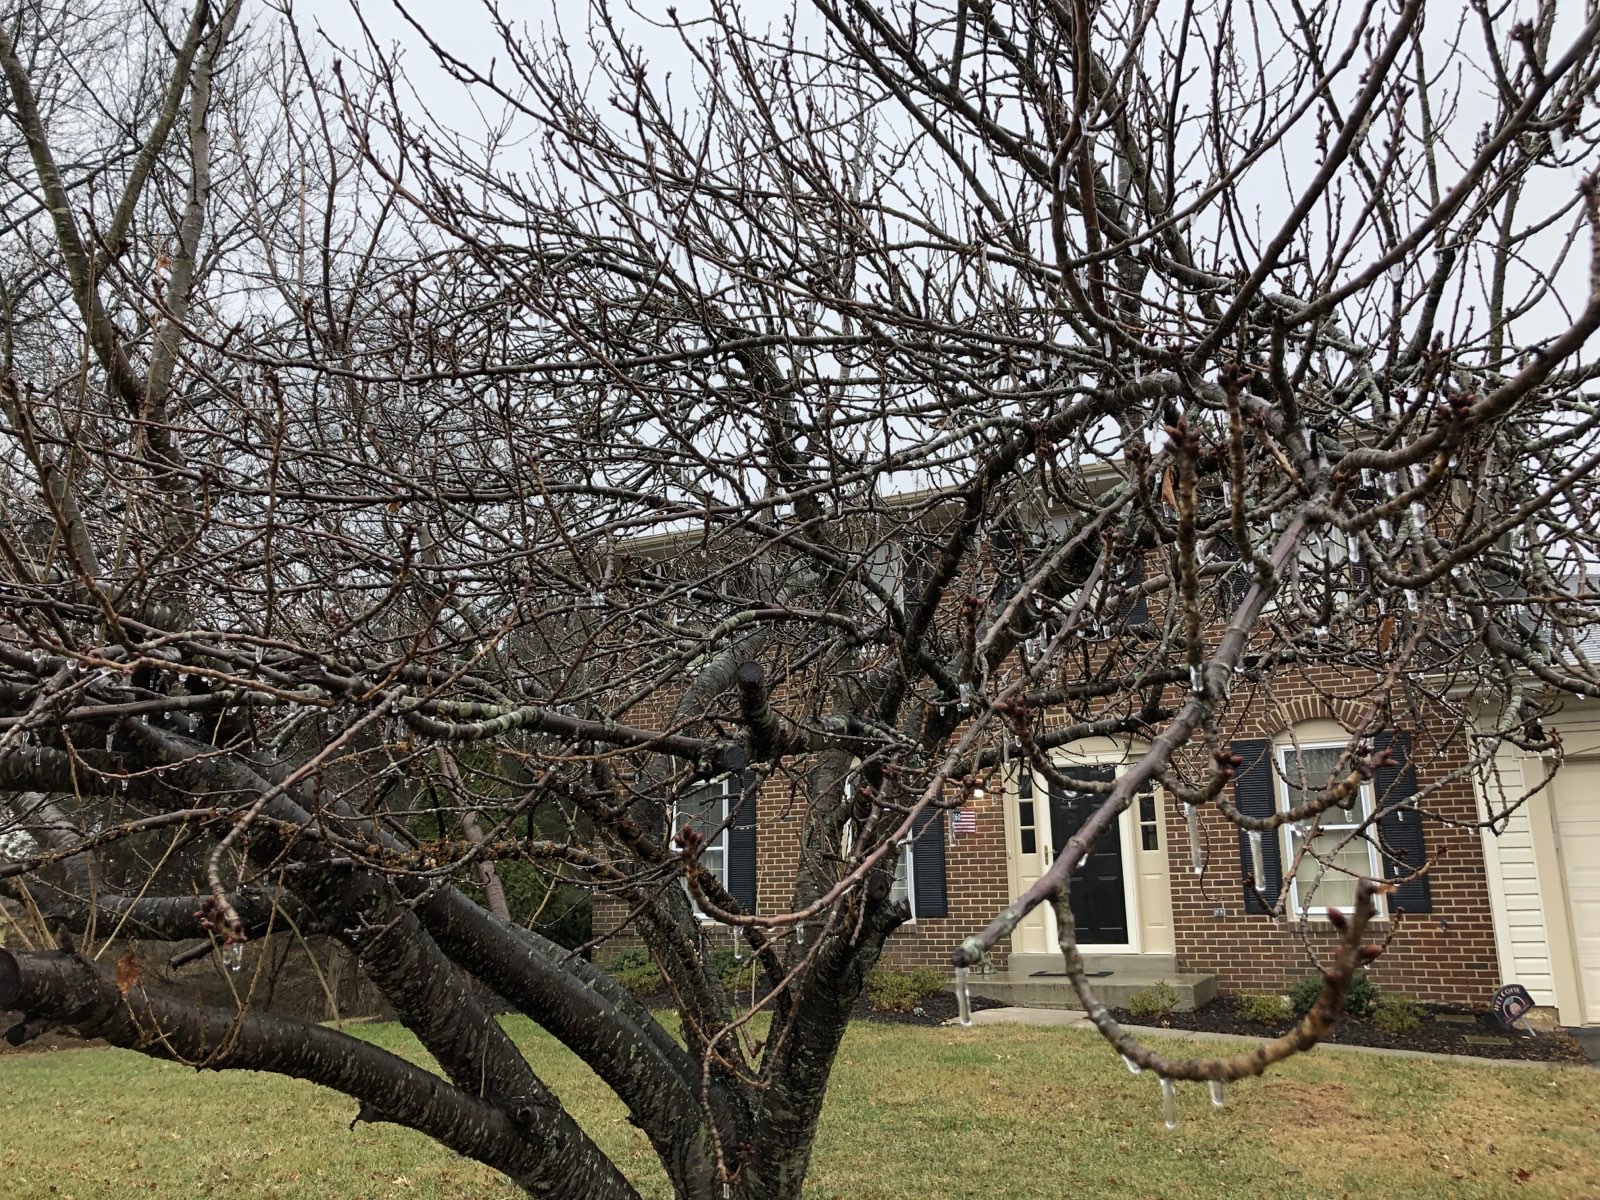
The snowiest states (by main-city normal)
| # | State | Normal snowfall | Snow belt |
|---|---|---|---|
| 1 | Vermont · Burlington | 81 in | Northern Green Mountains — Jay Peak averages ~350 in |
| 2 | Alaska · Anchorage | 78 in | Valdez — snowiest city in America (~300 in) |
| 3 | Maine · Portland | 62 in | Western mountains — Sugarloaf & Rangeley |
| 4 | New Hampshire · Concord | 61 in | White Mountains — Mount Washington averages 280+ in |
| 5 | Wyoming · Cheyenne | 60 in | Tetons & Jackson Hole — Grand Targhee ~500 in |
| 6 | Montana · Billings | 55 in | Cooke City & the Beartooths (200+ in) |
| 7 | Utah · Salt Lake City | 54 in | Wasatch — Alta & Snowbird top 500 in |
| 8 | Minnesota · Minneapolis–St. Paul | 52 in | North Shore highlands above Lake Superior — Duluth ~90 in |
| 9 | North Dakota · Fargo | 50 in | Turtle Mountains & Pembina Hills |
| 10 | Massachusetts · Boston | 49 in | Berkshires — Pittsfield & the Hoosac Range |
What a seasonal outlook actually is
CPC forecasters start from the tropical Pacific: the ENSO state shifts where the jet stream parks for months. They layer on ocean temperature patterns elsewhere, snow and sea-ice cover, the last 15 years of warming trend, and ensembles of climate models run months ahead. The output is three probabilities — above, near, below normal — for each three-month window. When nothing lines up, they say so with "equal chances," and large parts of the map are often exactly that.
What they never produce is a snowfall map. Snow depends on the cold and the moisture arriving in the same 48 hours, which is a weather question, not a climate one. That is why this site pairs the outlook with each state's 30-year normals and a live snow-depth read — the three numbers that actually bracket your winter.
Winter 2026–27 forecast FAQ
Climatology from NOAA NCEI 1991–2020 U.S. Climate Normals; outlook from the NOAA Climate Prediction Center (issued August 20, 2026), with per-state tilts taken from CPC's official Dec–Feb probability map at each state's three reference cities, since CPC publishes probabilities by region rather than a call per state; live snow from Open-Meteo model data. Hero image: “Rime ice on Jay Peak” by Runningonbrains, CC BY 3.0. Related: first frost dates · fall foliage · snow depth map · tick forecast.