
Washington Winter Forecast 2026–27: Snow, Cold & First Snow
Typical first snow December 20 · Seattle averages 6 in a season — plus NOAA's Dec–Feb outlook for the state and what's on the ground right now.
First snow typically December 20 · 72 days awayThe Washington snow season at a glance
NOAA 1991–2020 normals · SeattleMount Baker Ski Area's 1,140 in in 1998–99 is the most snow ever measured in one season anywhere on Earth — 90 miles from a Seattle that averages 6 in.
What NOAA's 2026–27 winter outlook means for Washington
NOAA's Climate Prediction Center issues a probability tilt — above, below, or equal chances — for temperature and precipitation, three months at a time. It is the only government seasonal forecast that exists, and it does not, and cannot, forecast snowfall totals or specific storms.
Where this tilt comes from: Each state's tilt here is read straight off CPC's official Dec–Feb probability map, at the three reference cities listed on that state's page. CPC forecasts by region, not by state: its probability bands cross state lines, so where a state's three cities land in different bands the tilt shows as equal chances. Check any state against CPC's own map. See CPC's official Dec–Feb outlook map →
What it means for snow: A milder tilt with no precipitation lean usually means snowfall slightly below normal — fewer days cold enough for snow, not necessarily fewer storms.
West context. Coastal California is the headline — CPC raised above-normal precipitation odds above 50% for DJF through FMA, citing the wet Februaries of 1998 and 2024 in similar east-Pacific El Niños; California leans milder as well. Oregon and Washington are favored milder than normal with equal chances on precipitation (the usual El Niño dry tilt was deliberately left off the coast). Alaska leans milder, with the strongest warm confidence in the outlook over the southeast panhandle, and reads as equal chances on precipitation at our three reference cities even though the discussion describes a drier mainland pattern. Hawaii is equal chances on both.
Snow on the ground in Washington right now
| City | Snow depth now | Snowfall next 7 days | Coldest low next 7 days | Normal season |
|---|---|---|---|---|
| Seattle | loading… | — | — | 6 in |
| Spokane | loading… | — | — | 45 in |
| Yakima | loading… | — | — | 20 in |
Loading live conditions…
Snow depth map around Seattle
Current modeled snow depth across the surrounding terrain, or flip to the 7-day snowfall forecast. Enter a ZIP to recenter anywhere in the country.
Modeled snow depth on the ground around Seattle, WA. This is a weather-model estimate, not a gauge reading: it misses drifts, shaded hollows, and freshly plowed lots. For official observations see NOAA's NOHRSC snow analysis or a nearby SNOTEL site.
Seattle winter normals, October–April
| Month | Avg snowfall | Avg high | Avg low |
|---|---|---|---|
| October | 0 in | 60°F | 47°F |
| November | 1 in | 51°F | 41°F |
| December | 2 in | 46°F | 37°F |
| January | 3 in | 48°F | 38°F |
| February | 2 in | 51°F | 38°F |
| March | 1 in | 55°F | 41°F |
| April | 0 in | 60°F | 44°F |
NOAA NCEI 1991–2020 climate normals for Seattle, rounded. Seasonal total (6 in) includes May–September trace months not shown. January is the snowiest month. State record low: -48°F, Mazama & Winthrop, 1968.
Washington's snow belts
Mount Baker
world record 1,140 in in 1998–99
Paradise, Mount Rainier
~640 in
Stevens & Snoqualmie passes
One of Washington's snowiest zones — expect totals well above the Seattle normal.
Spokane & the Palouse
~45 in
Washington winter-prep checklist, by date
The first frost is the warning shot. Typical first frost in Washington: October 28 — see the Washington first-frost page.
A hard freeze typically follows the first frost by about two weeks. Backflow preventers and above-ground manifolds crack first — this is the single most expensive thing to skip.
Book the HVAC tech before the first cold snap, when every company's schedule fills. Test the CO detector — furnaces and generators are the two winter CO sources.
Median first measurable snow in Seattle is December 20; one winter in ten it arrives by November 25.
Homes in Washington are often built without deep pipe protection, which is why a single arctic outbreak does so much damage here.
Ice storm risk in Washington: low
Washington rarely sees damaging freezing rain. Where ice is a problem it is black ice on roads after a thaw-refreeze, not accumulation on lines and trees.
Freezing rain needs a specific sandwich: warm, moist air aloft sliding over a shallow layer of below-freezing air at the surface. That is why the ice belt runs from Texas and Oklahoma through the Ozarks, the mid-South, and up the Carolina Piedmont into the mid-Atlantic — places where arctic air arrives thin and Gulf moisture arrives on top.
What a seasonal outlook tells you about snow
Day-to-day weather is unpredictable beyond about two weeks. What seasonal forecasters have instead is the background state — mainly ENSO, the El Niño / La Niña cycle in the tropical Pacific — which nudges the jet stream's average position for months at a time. NOAA's Climate Prediction Center turns that nudge into a probability: "40% chance of above-normal temperatures" means 40%, with 33% the climatological baseline. A 33/33/33 split (equal chances) means they see no usable signal at all.
Snowfall is harder still, because it needs cold and moisture to line up storm by storm. A warm, wet tilt can deliver a huge snow winter if the cold arrives on the right three days, or a washout if it doesn't. Independent verification studies consistently find CPC temperature outlooks carry modest skill in winter (most of it from ENSO and long-term warming trends), precipitation outlooks less, and almanac-style snow forecasts none. So: use the tilt to lean your planning, use the 30-year normals on this page as the anchor, and use the 7-day forecast for anything that actually needs a decision.
This year's background state: El Niño conditions are present and strengthening. In its August 13, 2026 ENSO Diagnostic Discussion, CPC gave a greater than 90% chance of a very strong event during fall and winter 2026–27, and a 69% chance that the October–December season sets a record (+2.5°C or more, 3-month RONI) for any El Niño since 1950. CPC is explicit that impacts consistent with El Niño become more likely with an event this large, but are not guaranteed.
- A stronger, southward-shifted Pacific jet stream: wetter than normal across the southern tier from California to the Southeast, especially in late winter (Jan–Mar).
- Milder than normal across the northern tier — Pacific Northwest, northern Rockies, northern Plains, Great Lakes, and Northeast — with below-normal snowfall often following from the warmth, not from a lack of storms.
- Drier than normal across the northern Rockies, northern High Plains, and parts of the Great Lakes and Ohio Valley; mainland Alaska trends drier and milder.
- Nor'easters and Gulf-coast storms are often more frequent in strong El Niño winters; whether they fall as snow or rain in the mid-Atlantic is the big unknown and depends on the cold supply week to week.
- Ice-storm risk climbs in the Southern Plains and Southeast when a wet southern storm track meets shallow cold air — exactly the setup strong El Niño favors.
Washington winter forecast FAQ
More Washington seasonal timing
More West winter forecasts
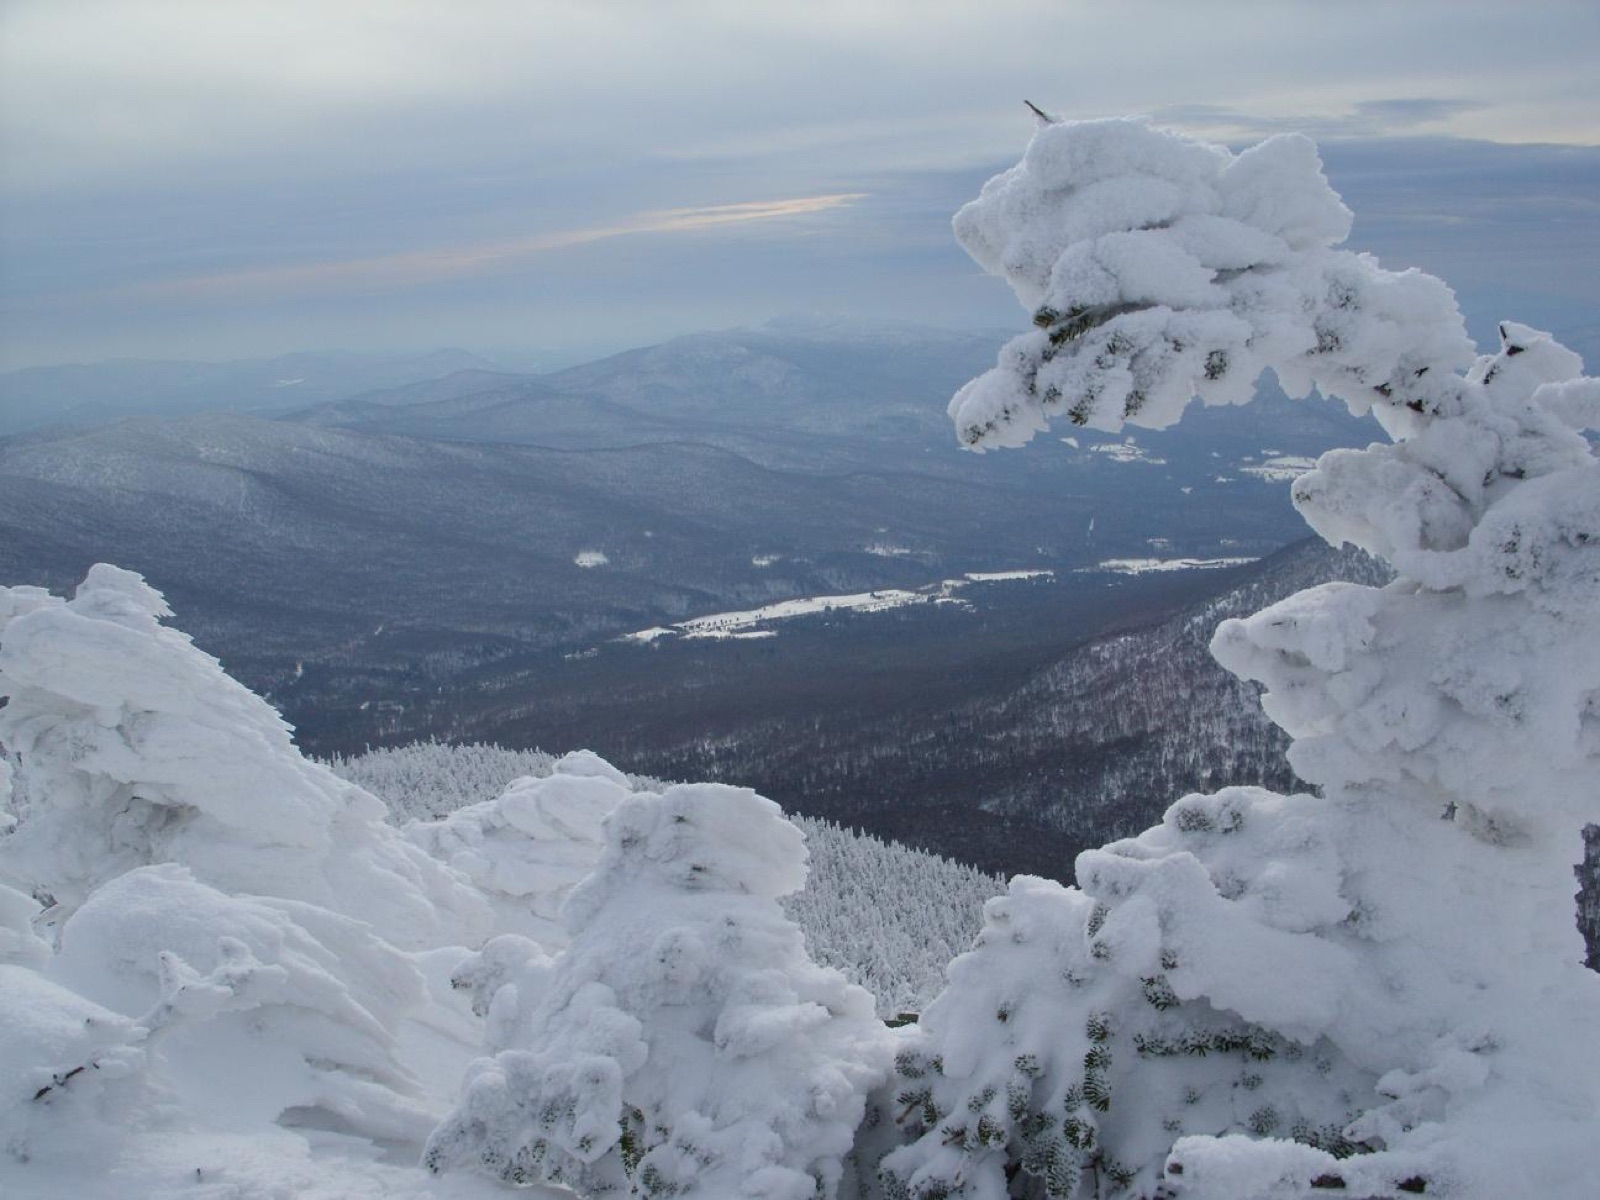
Climatology: NOAA NCEI 1991–2020 U.S. Climate Normals for Seattle and the cities listed; state record lows from NCEI state climate extremes. Outlook: NOAA Climate Prediction Center seasonal outlook issued August 20, 2026 — a probability tilt, not a snowfall forecast, and the state-level tilt shown here is taken from CPC's official Dec–Feb probability map at each state's three reference cities, since CPC publishes probabilities by region rather than a call per state. Live values: Open-Meteo model data, not gauge observations. Hero image: “Rime ice on Jay Peak” by Runningonbrains, CC BY 3.0. National picture: the 2026–27 winter outlook for every state → · national snow depth map →