
US Tide Charts, Town by Town
Seven day tide tables and today's tide curve for 179 NOAA harmonic prediction stations across 24 coastal states, read live from NOAA CO-OPS and reproduced as published.
179 station pages across 24 coastal statesThe US tide, at a glance
NOAA harmonic predictionsThe next high tide is one number. The week is the useful view: the curve, the heights, the sun and moon times, and the one afternoon a minus tide turns the shoreline into walkable ground.
Tide charts by state
Every page reads NOAA’s harmonic predictions live for one station: today’s curve, 7 days of highs and lows with heights, sunrise and sunset, the moon phase, and derived callouts like the lowest daytime tide of the week. Pick a state, then the station nearest the shoreline you plan to stand on.
New England
Maine
7 tide chart pages, Eastport, Bar Harbor, Rockland and more.
New Hampshire
2 tide chart pages, Dover, New Castle.
Massachusetts
10 tide chart pages, Newburyport, Gloucester, Boston and more.
Rhode Island
5 tide chart pages, Newport, Providence, Wickford and more.
Connecticut
5 tide chart pages, New London, Mystic, New Haven and more.
Mid-Atlantic
New York
9 tide chart pages, Montauk, Sag Harbor, Greenport and more.
New Jersey
9 tide chart pages, Sandy Hook, Red Bank, Toms River and more.
Pennsylvania
2 tide chart pages, Philadelphia, Marcus Hook.
Delaware
4 tide chart pages, Delaware City, Mahon River, Lewes and more.
Maryland
7 tide chart pages, Havre de Grace, Baltimore, Annapolis and more.
Virginia
8 tide chart pages, Colonial Beach, Chincoteague, Tangier Island and more.
Southeast Atlantic
North Carolina
9 tide chart pages, Duck, Oregon Inlet, Cape Hatteras and more.
South Carolina
7 tide chart pages, Myrtle Beach, Garden City, Pawleys Island and more.
Georgia
5 tide chart pages, Fort Pulaski, St. Simons Island, Brunswick and more.
Florida
20 tide chart pages, Fernandina Beach, Mayport, Jacksonville Beach and more.
Gulf Coast
Pacific Coast
How to read a tide chart
A tide chart lists the times the water reaches its highest and lowest points each day, with a predicted height beside each. The heights are measured from mean lower low water (MLLW), the long-term average of the lower of each day’s two lows, which is also the zero on NOAA’s nautical charts. So a 4.2 ft high tide means the water stands 4.2 feet above that average lowest level, and a minus tide is water below it, exposing ground that most days never uncover.
Between the listed times the water is always moving, fastest in the middle of the swing: roughly half of the total change happens in the middle two hours between a high and a low. That is why the station pages draw the full curve rather than just the four moments, and why anglers talk about fishing the moving water rather than the slack at either end.
Timing is local. The tide arrives as a wave traveling along the coast and up every bay, so the right chart is the station nearest your actual shoreline, not the nearest big city. Each of the 179 pages here is one NOAA harmonic station with its own schedule.
Moon phase, spring tides and king tides
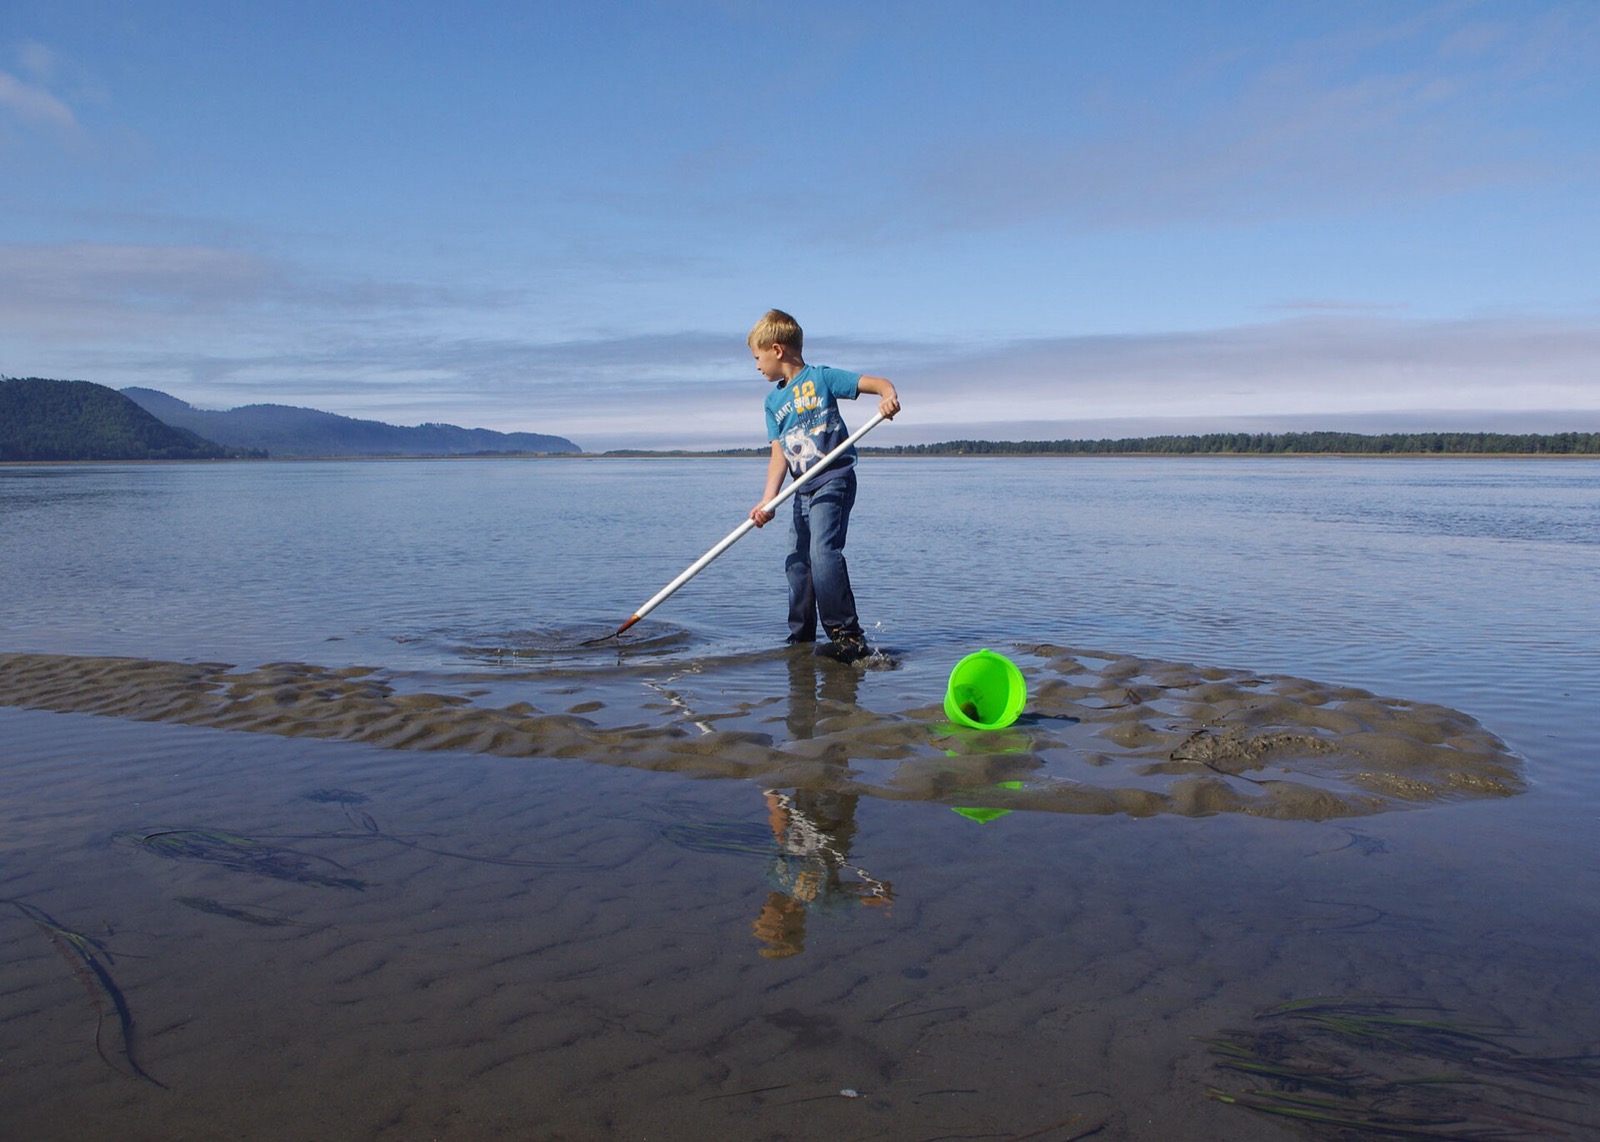
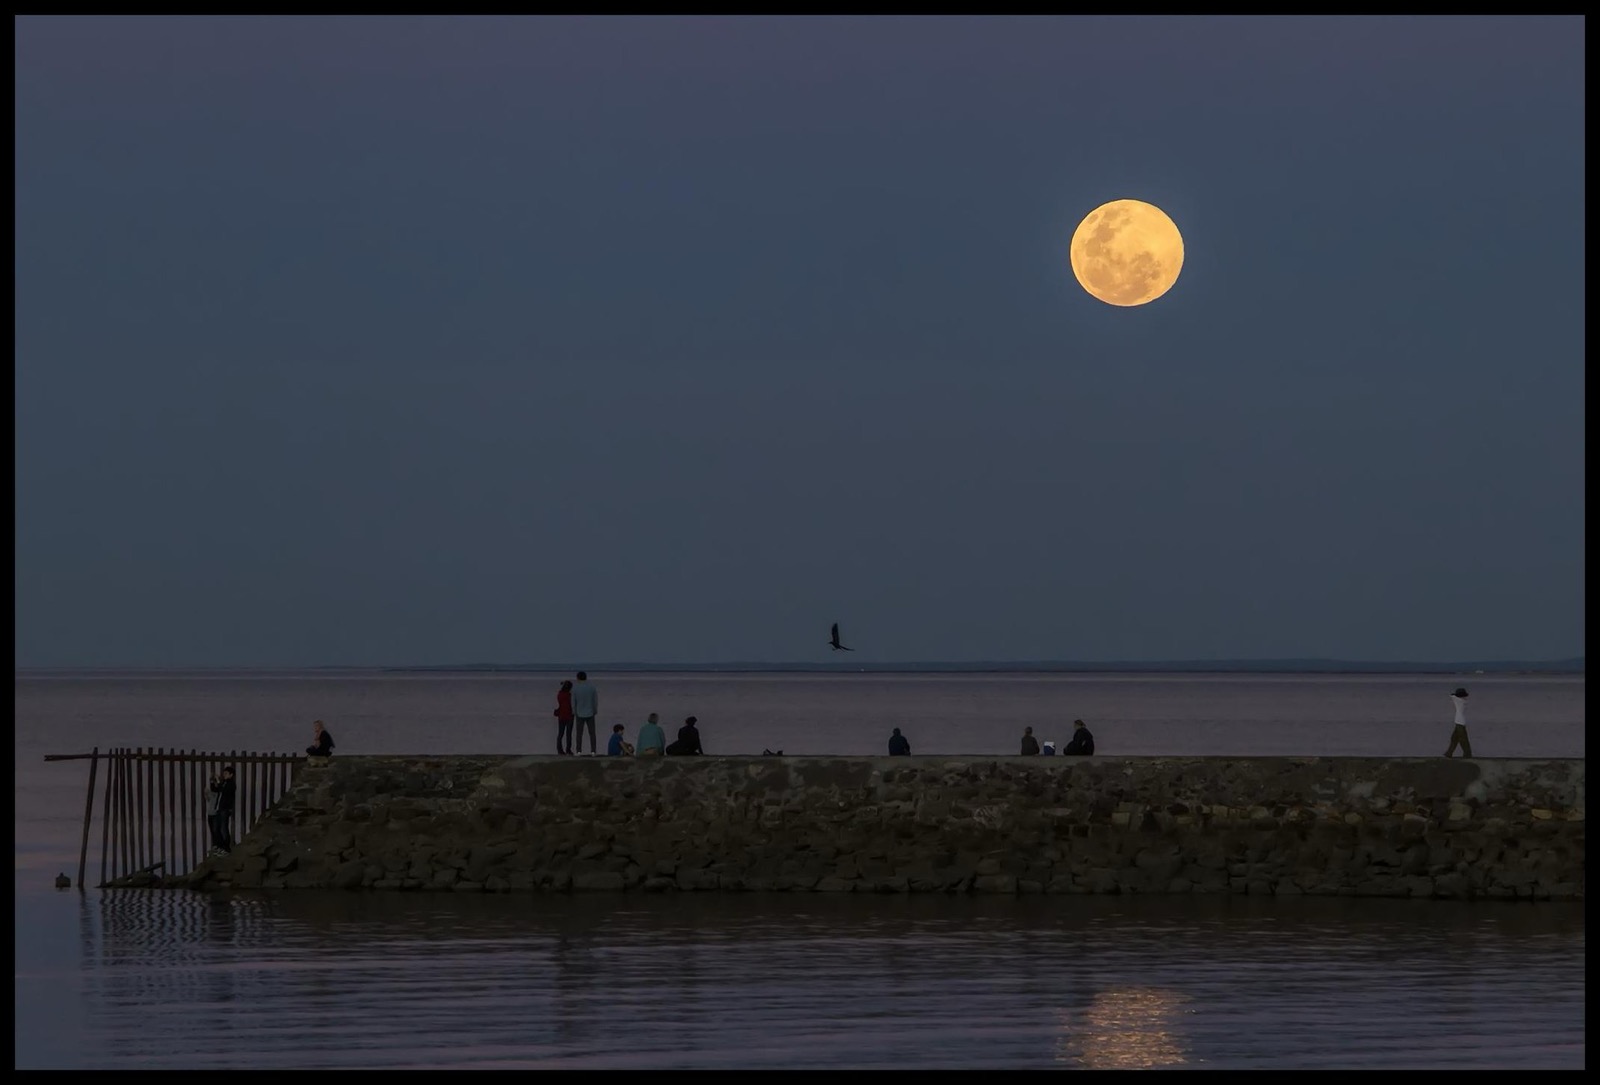
The moon does most of the pulling. Around new and full moon the sun and moon line up and every coast gets its spring tides, the biggest highs and lowest lows of the month; around the quarter moons the pulls partly cancel and the swing shrinks to neap tides. The best tidepooling and clamming weeks cluster around the new and full moons for exactly this reason, and every station page here prints the moon phase beside every day.
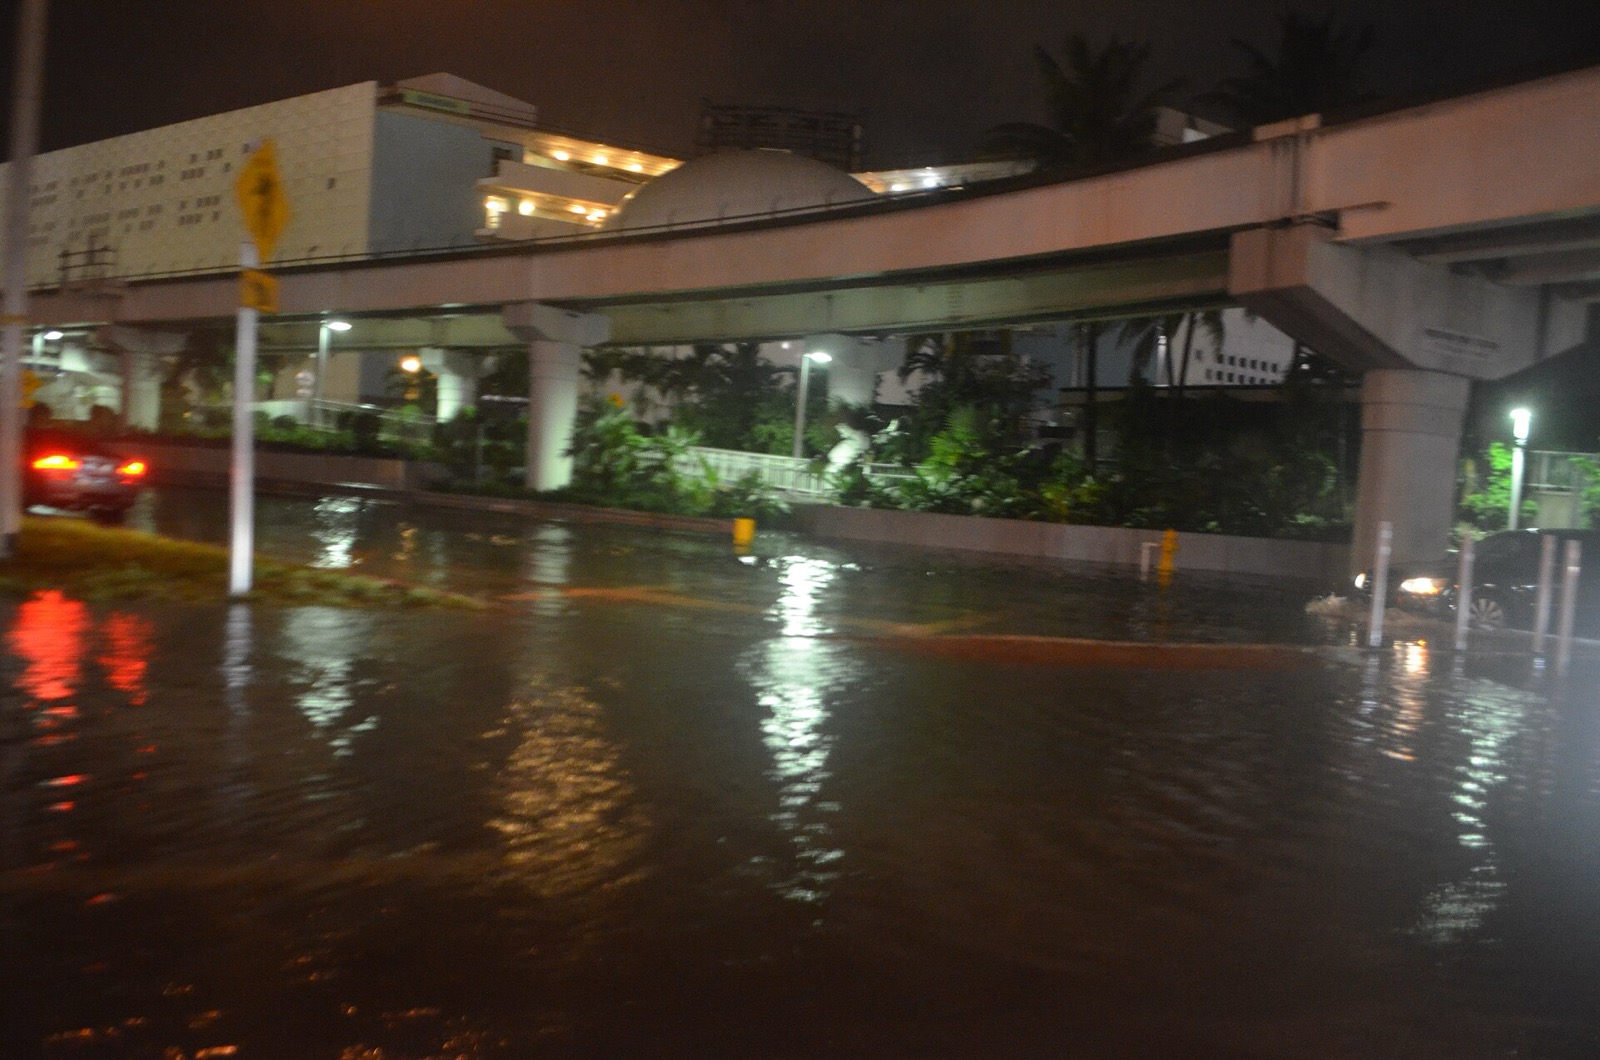
The National Ocean Service’s definition of the term you hear on the news: “A King Tide is a non-scientific term people often use to describe exceptionally high tides,” typically when a new or full moon coincides with the moon’s perigee, its closest approach to Earth. Add onshore weather and the highest highs can flood streets that stay dry the rest of the year.
Why some states have no tide chart here
The Great Lakes states. Michigan, Wisconsin, Illinois, Indiana, Ohio and Minnesota have magnificent freshwater coasts but no usable lunar tide, and we would rather say so than ship an empty chart. NOAA’s National Ocean Service explains: “True tides, changes in water level caused by the gravitational forces of the sun and moon, do occur in a semi-diurnal (twice daily) pattern on the Great Lakes. Studies indicate that the Great Lakes spring tide, the largest tides caused by the combined forces of the sun and moon, is less than five centimeters in height. These minor variations are masked by the greater fluctuations in lake levels produced by wind and barometric pressure changes. Consequently, the Great Lakes are considered to be non-tidal.” What moves Great Lakes water levels day to day is wind and pressure, including seiches, which are weather events rather than predictable tides.
The inland states. Vermont, West Virginia, Kentucky, Tennessee, Iowa, Missouri, Arkansas, Oklahoma, Kansas, Nebraska, South Dakota, North Dakota, Montana, Wyoming, Colorado, New Mexico, Arizona, Utah, Nevada and Idaho have no tidal shoreline at all. Note that a missing ocean is not always obvious from a map: Pennsylvania makes this list of covered states because the Delaware River is genuinely tidal past Philadelphia, and New York’s Hudson runs tidal all the way to Albany.
Tide chart FAQ
Tide predictions are read live in your browser from NOAA CO-OPS (api.tidesandcurrents.noaa.gov) and reproduced as published; station facts come from the CO-OPS metadata API. NOAA material is US government work in the public domain; attribution is given as NOS requests. NOAA’s published disclaimer applies to every prediction shown: “These data are based upon the latest information available as of the date of your request, and may differ from the published tide tables.” These pages are for beach, fishing and tidepool planning, not navigation.
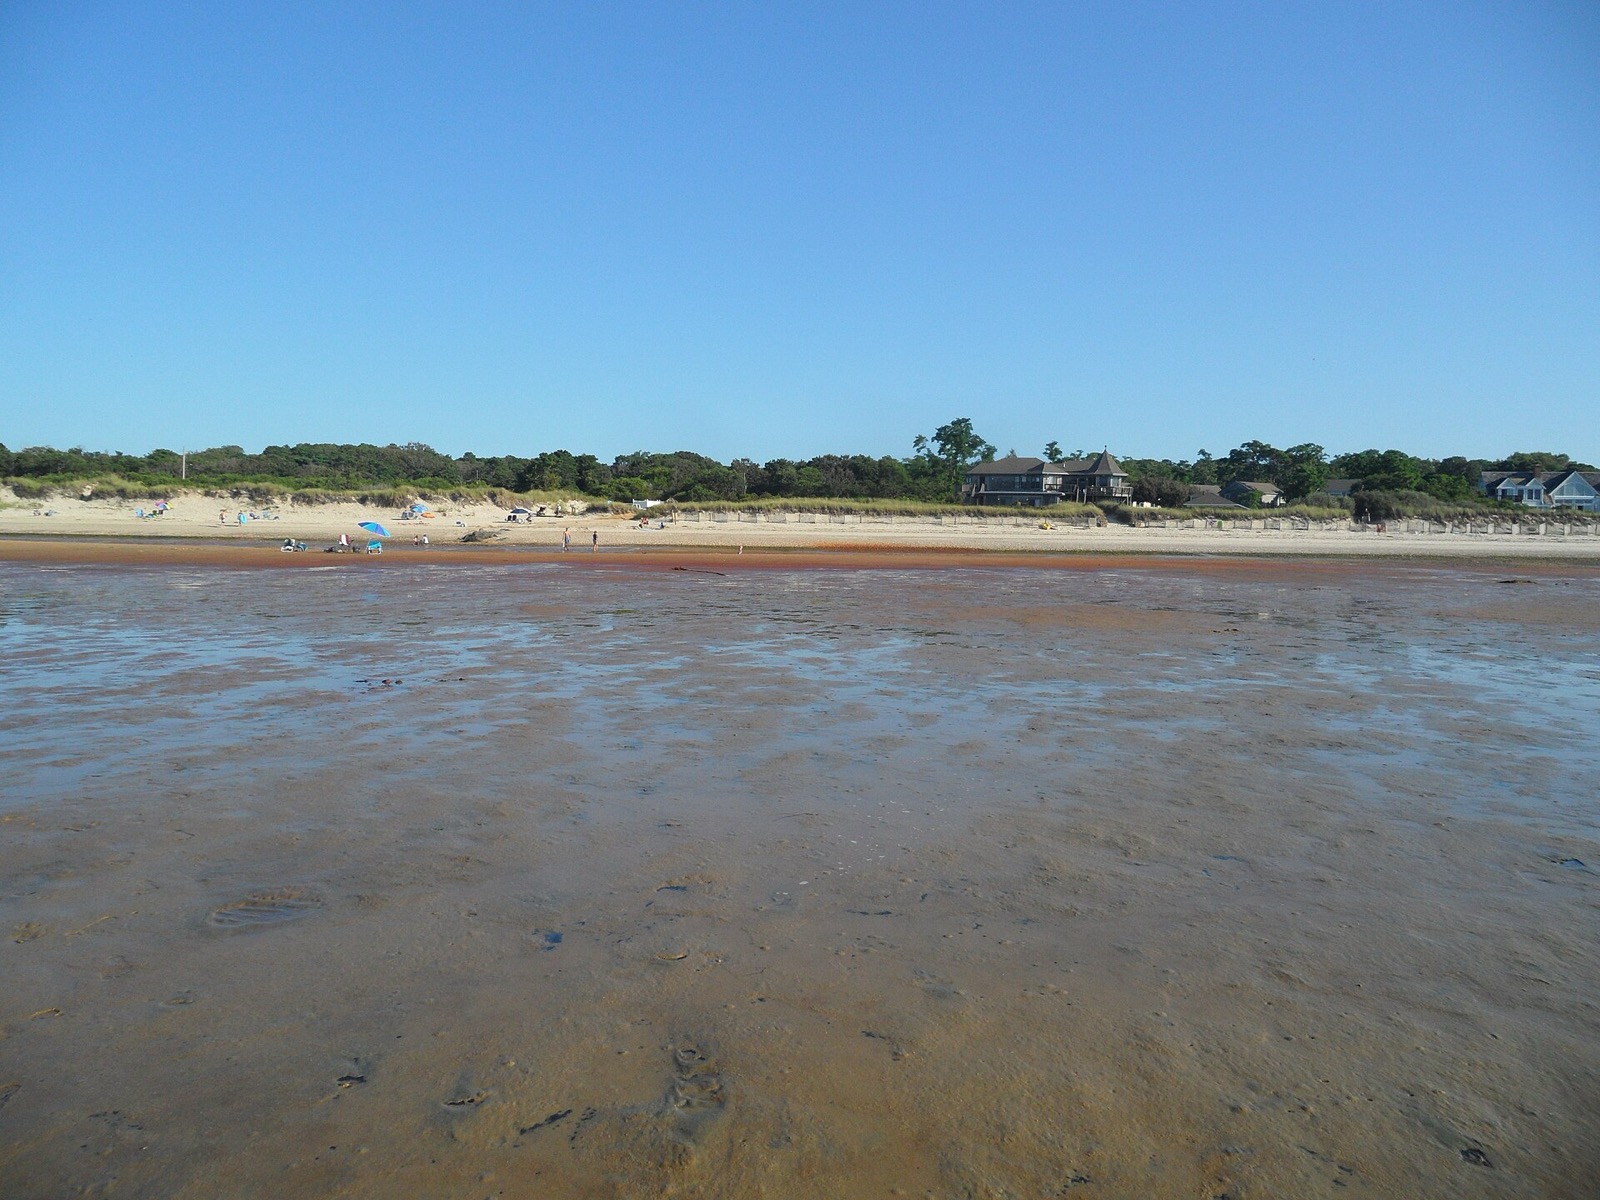
Hero image: “Brewster Flats Tidal Flats on Cape Cod Bay East Brewster Massachusetts” by EgorovaSvetlana, CC BY-SA 4.0