
Snow Totals Near Me: The Last Storm and the Season So Far
Enter your ZIP code for the biggest snow report within 30 miles in the last week, who measured it and when, and how this season stands against normal.
How much snow did we get? Check your ZIP code
The last storm comes from trained spotters and observers who file reports with the National Weather Service. The season comes from the nearest long record weather station, set against its 1991-2020 normal.
Snow across the fifty states
Station records, 1991-2020 normalsFrom 193 weather stations, read October 10, 2026 from the Regional Climate Centers’ ACIS service. Seasons run July 1 to June 30.
Which states get the most snow
Ranked by the median normal season across every weather station in the state that has one, so a mountain top does not carry a whole state. Vermont leads at 87.2 inches a season; Maine and New Hampshire follow. The last column names the snowiest station on these pages. Each state links to its own page with the live list of the week’s biggest reports and every station’s records.
| # | State | Typical normal season | Snowiest station |
|---|---|---|---|
| 1 | Vermont | 87.2 in | Burlington, 87.5 in |
| 2 | Maine | 85.5 in | Rangeley, 123.3 in |
| 3 | New Hampshire | 72.5 in | Mount Washington, 281.8 in |
| 4 | New York | 72.4 in | Hooker, 227.7 in |
| 5 | Michigan | 66 in | Herman, 207.8 in |
| 6 | Alaska | 64.6 in | Alyeska, 214.5 in |
| 7 | Wyoming | 49.7 in | Snake River, 293.6 in |
| 8 | Massachusetts | 49.2 in | Ashburnham, 75.2 in |
| 9 | Wisconsin | 47.9 in | Lac Vieux Desert, 125.7 in |
| 10 | Minnesota | 46.6 in | Duluth, 90.2 in |
| 11 | Colorado | 44.8 in | Climax, 294.7 in |
| 12 | North Dakota | 43.1 in | McHenry, 59.8 in |
| 13 | Montana | 42.5 in | Mystic Lake, 192.7 in |
| 14 | Idaho | 41.3 in | McCall, 132.2 in |
| 15 | South Dakota | 40.9 in | Lead, 183.9 in |
The board, the six hour rule and why reports differ
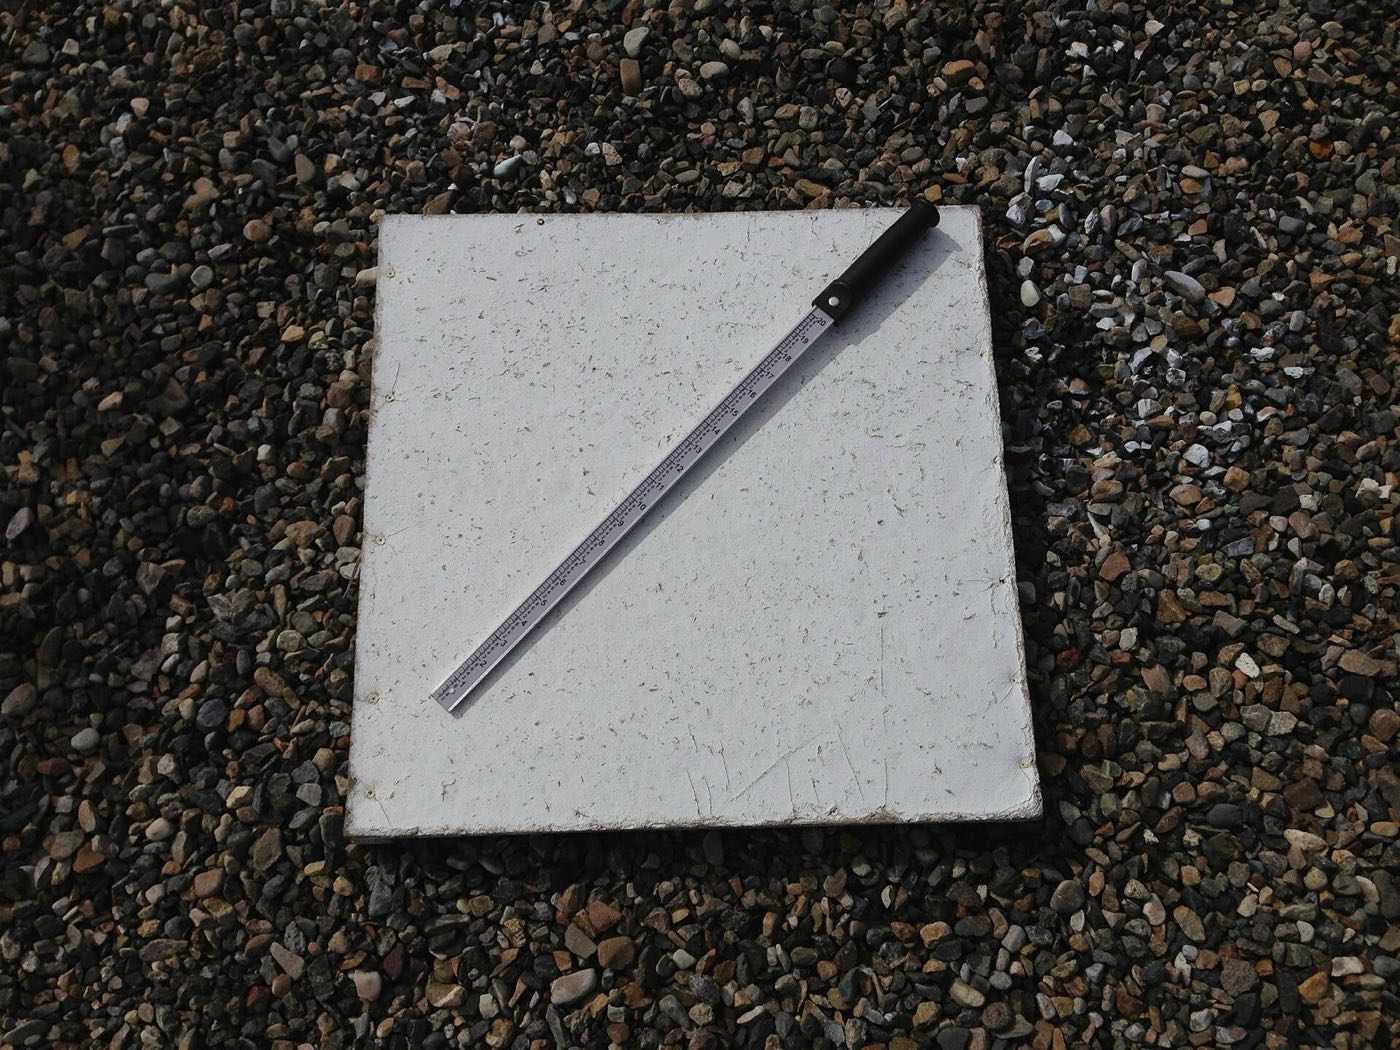
A flat white board
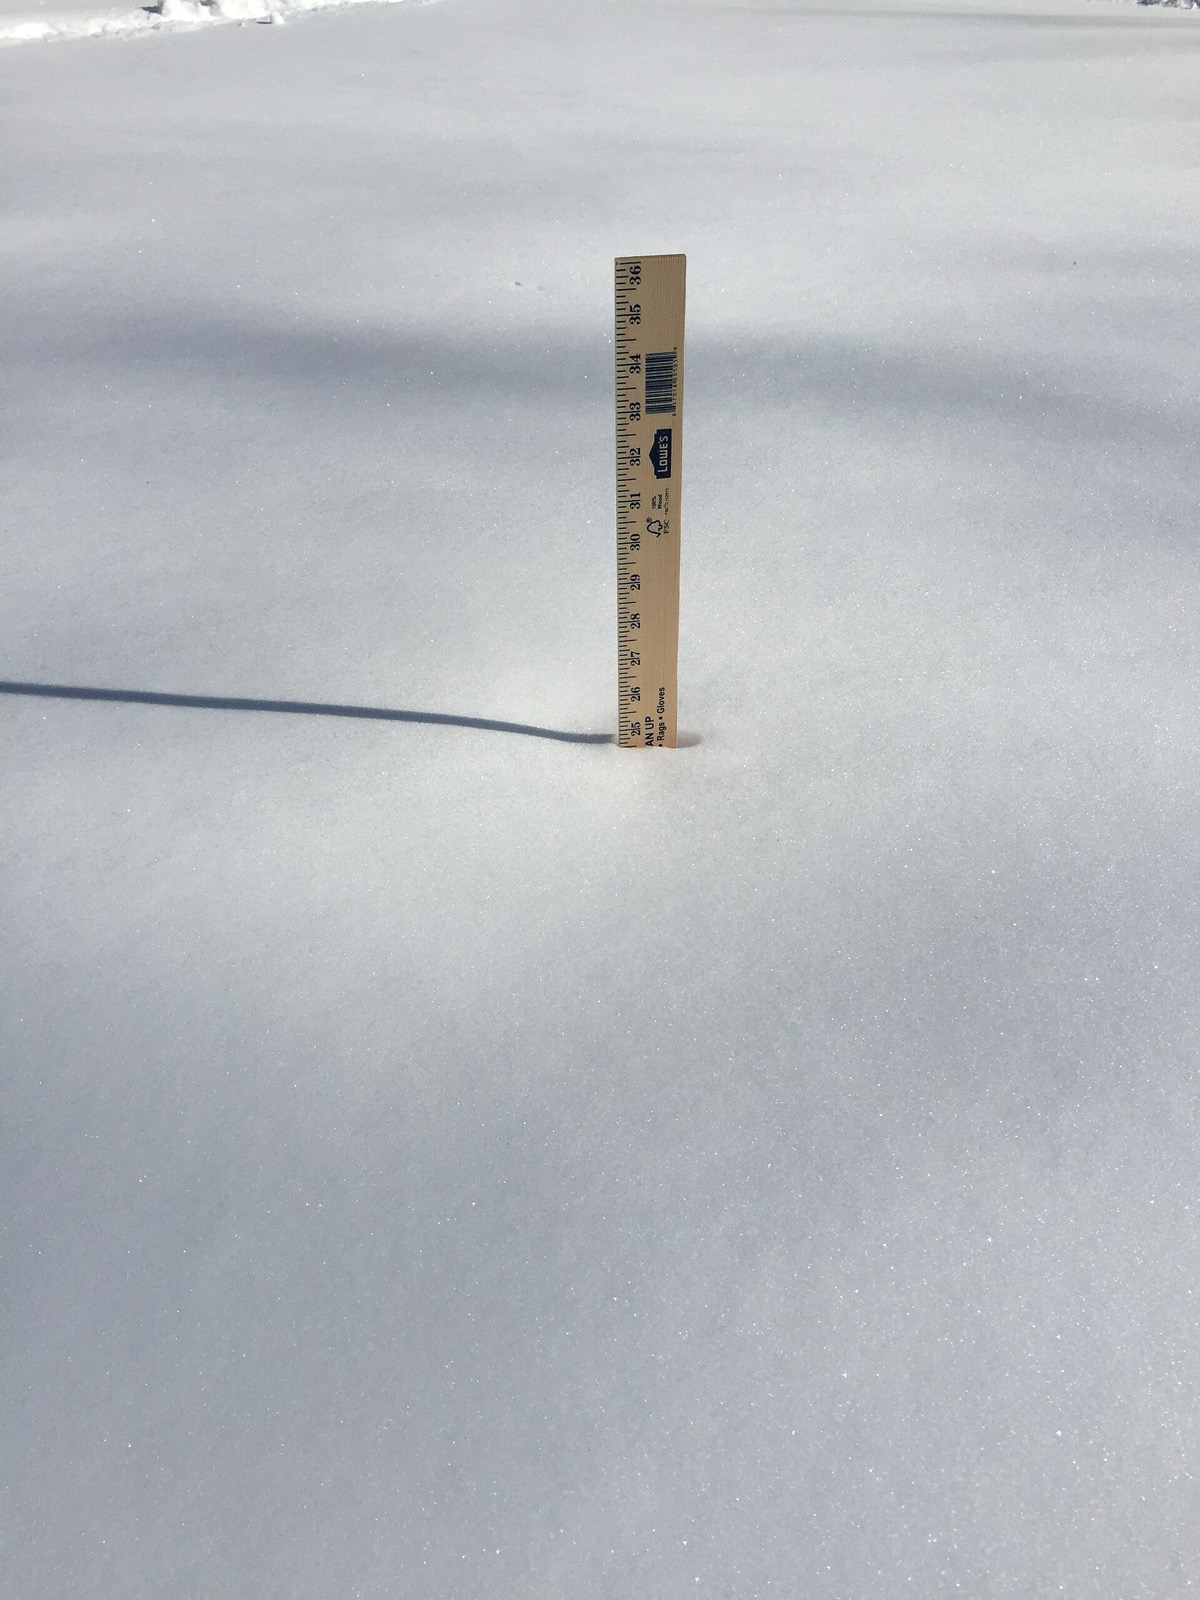
Observers measure new snow on a flat board painted white, set out in an open spot away from trees, roofs and drifts, so the snow lands where wind has not rearranged it.
Every six hours at most
The board is read at least every six hours during a storm, because snow settles under its own weight and melts from the bottom. A single reading at the end of a long storm runs low.
Clear it, then add them up
After each reading the board is swept clean, and the storm total is the sum of the readings. Depth on the ground is a different number: it holds older snow and has settled.
Why two reports a few miles apart can differ
- Wind moves snow, so a drift and a bare patch can sit ten feet apart.
- Two observers a few miles apart can differ by inches in a band of heavy snow.
- Elevation matters: the same storm can be rain at the bottom of a hill and a foot of snow at the top.
- A reading at 7 am and one at noon see different amounts of settling and melt.
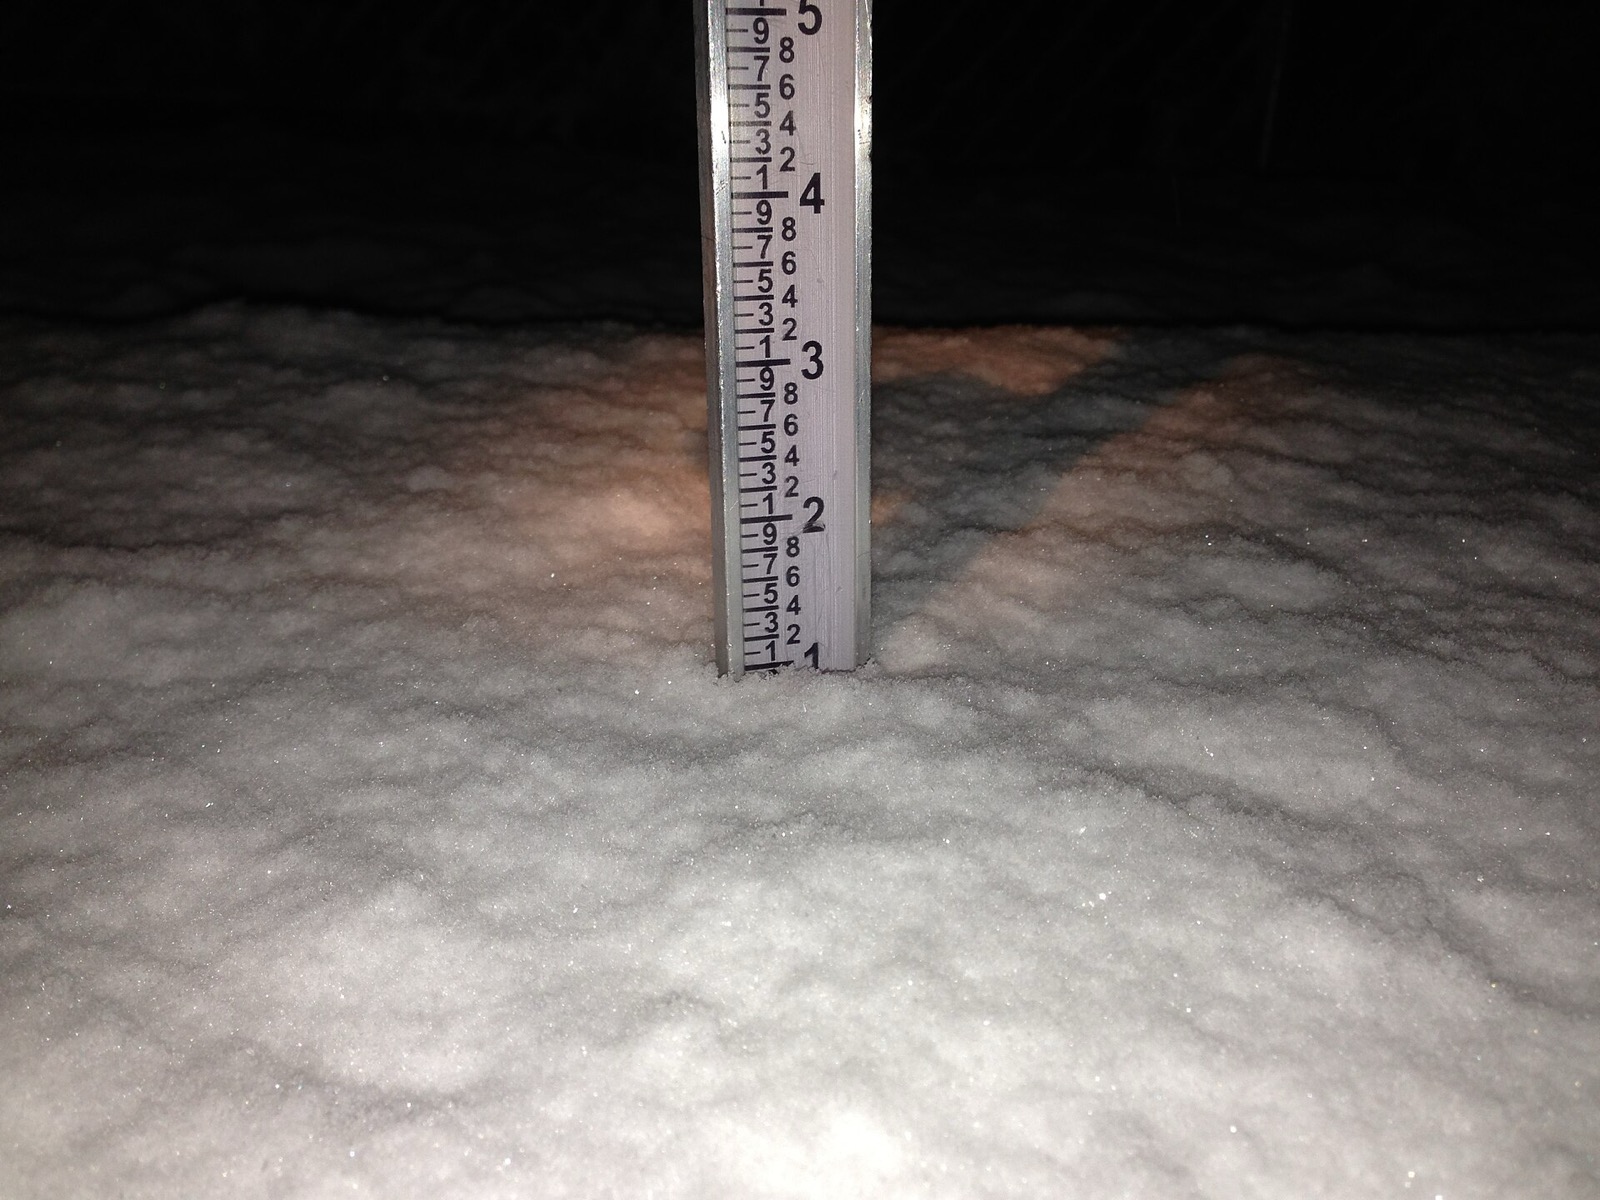
- A report is one place, one time, one person with a ruler or a stick.
Snow total questions, answered
Snow totals by state
More for the snow season
Sources. Storm reports: National Weather Service Local Storm Reports, through the Iowa Environmental Mesonet archive (archive). Seasons, records and station observations: the Regional Climate Centers ACIS (GHCN-Daily station observations), read October 10, 2026. Normals: NOAA NCEI 1991-2020 U.S. Climate Normals. Measuring: the National Weather Service.
Reports are unofficial, filed by spotters and observers, and are corrected or added to as a storm is reviewed. Station records count only seasons with nearly complete observations.
Hero photograph: a street in Washington, D.C., during the 2010 blizzard. “Dupont Circle - 19th Street, N.W. - Blizzard of 2010” by AgnosticPreachersKid, CC BY-SA 3.0