
Avalanche Forecasts, Zone by Zone
Find the avalanche forecast for where you are going. Enter a ZIP to get the centre that covers it, see today's danger rating for every US forecast zone, and read what the five levels mean.
Loading today's ratings.Find the forecast for where you are going
Avalanche forecasts are issued by zone, and the zone that matters is the one you will be travelling in rather than the one you live in. Enter a ZIP and this finds the nearest forecast zones and the centre that covers them.
Finds the nearest of the 83 US forecast zones and shows what each one’s centre has published right now. Each rating applies to the named zone, an area typically tens of miles across, never to the ZIP itself or to a specific slope.
What the five danger levels mean
Every avalanche centre in the United States and Canada uses the same five level scale, so a rating from Utah means what a rating from Mount Washington means. Each forecast explains what its level means for the terrain it covers, which is the part worth reading before you go.
- 1Low#50B848
- 2Moderate#FFF200
- 3Considerable#F7941E
- 4High#ED1C24
- 5Extreme#231F20
- –No ratingnot a level
Those are the five levels of the North American Public Avalanche Danger Scale, with the official colours from the National Avalanche Center’s own colour table. The scale was published in 2010 and updated in 2022, and is maintained by a working group of United States and Canadian organisations rather than by a single agency. What each level means, and what the scale says about travelling in it, is published beside the forecast that applies it, on the issuing centre’s page. The grey chip marks a zone whose centre has published no rating; it is not a sixth level.
Danger ratings by zone
Avalanche deaths in the United States
CAIC accident archive, 1950-51 to 2024-25Those are the Colorado Avalanche Information Center’s numbers from the national accident archive. A death count records what happened, and says nothing about how dangerous a state is today. Please cite the CAIC 2024 for all use.
When and where avalanche deaths happen
The Forest Service puts the national figure plainly, and the Colorado Avalanche Information Center keeps the archive behind it.
USDA Forest Service, Avalanche Safety overview“Each winter, 25-30 people are killed by avalanches in the United States.”
Colorado Avalanche Information Center“The CAIC is the central archive for avalanche accidents in the United States and maintains detailed records going back to 1950, and sparse records back to the 1860s.”
By month, last ten seasons
- Oct1
- Nov3
- Dec29
- Jan56
- Feb74
- Mar46
- Apr16
- May9
- Jun2
- Jul1
- Aug0
- Sep0
237 avalanche deaths in the United States across the 10 seasons 2015-16 to 2024-25, by month, from the Colorado Avalanche Information Center accident archive. Please cite the CAIC 2024 for all use. These are deaths in the national accident archive, not avalanches and not a danger rating. A month or a state with a low count is not a safe one: most of the difference between them is how many people are out in avalanche terrain.
The shape of that chart is the useful part. Feb is the worst month with 74 deaths in ten seasons, and Feb, Jan, Mar together take 74 percent of the total. But the tail runs from October to July, and the long tail is where people are most often caught out: spring corn skiing, summer snow climbing, and early-season storms falling on a thin, weak base.
By season
- 302015-16
- 122016-17
- 252017-18
- 252018-19
- 232019-20
- 372020-21
- 172021-22
- 302022-23
- 162023-24
- 222024-25
US avalanche deaths by season, 2015-16 to 2024-25. The ten-season total is 237, an average of 23.7 a season, against the 1,255 in the archive since 1950-51. A quiet season is not a safe season; it is one season.
By what people were doing
- Backcountry Tourer87
- Snowmobiler73
- Sidecountry Rider19
- Climber13
- Resident10
- Inbounds Rider8
- Hiker7
- Mechanized Guided Client6
Deaths by the archive’s own primary activity label, 2015-16 to 2024-25. The categories are the CAIC’s.
The Forest Service has the sharpest one-line framing of what that list means:
USDA Forest Service, Avalanche Safety overview“Avalanches are the only natural hazard humans can cause while moving through the landscape.”
By state
| State | Since 1950-51 | Last 10 seasons | Most recent | Forecast zones |
|---|---|---|---|---|
| CO | 328 | 58 | 2024-25 | yes |
| AK | 177 | 32 | 2024-25 | yes |
| WA | 139 | 23 | 2024-25 | yes |
| UT | 138 | 24 | 2024-25 | yes |
| MT | 130 | 22 | 2023-24 | yes |
| WY | 101 | 24 | 2024-25 | yes |
| ID | 96 | 25 | 2024-25 | yes |
| CA | 74 | 12 | 2024-25 | yes |
| OR | 25 | 9 | 2024-25 | yes |
| NH | 17 | 2 | 2020-21 | yes |
| NV | 15 | 4 | 2024-25 | none filed |
| NM | 6 | 2 | 2018-19 | yes |
| NY | 4 | 0 | 1999-00 | yes |
| ME | 2 | 0 | 1983-84 | none filed |
| AZ | 1 | 0 | 1994-95 | yes |
| ND | 1 | 0 | 2007-08 | none filed |
| VT | 1 | 0 | 2004-05 | none filed |
Who forecasts avalanches in the United States
There is no single national avalanche service. There are 31 organisations in the national registry, 13 of them USDA Forest Service programmes, 2 state agency programmes, and 16 nonprofits or observation exchanges. The Forest Service is the lead federal agency and says why:
USDA Forest Service, Avalanche Safety overview“Because nearly all avalanche accidents involve recreation on National Forests and avalanches typically kill more people on National Forests than any other natural hazard, the Forest Service is the primary federal agency in this field.”
Even the federal centres are not federally funded in the way that phrase suggests. The Forest Service is direct about it, and it is the reason almost every Forest Service avalanche centre has a “Friends of” nonprofit beside it raising money:
USDA Forest Service, Avalanche Safety overview“FS avalanche forecasts and education are used by millions of people each winter and have directly reduced the US avalanche fatality rate. More than half of the total funding comes from non-federal sources.”
Two of the 31 are not forecast programmes at all. The Eastern Wyoming Avalanche Info Exchange and the Southern Oregon Avalanche Info Exchange are observation exchanges: places where backcountry users share what they saw. They appear on the national map with polygons, which makes them look like forecast zones, and they issue no danger rating. They are marked as exchanges wherever they appear on this site.
Every zone row and centre link on this site goes to the centre’s own forecast, because the bottom line, the hazard discussion and the travel advice belong with the forecaster who wrote them.
| Centre | Register | Zones published | Home state |
|---|---|---|---|
| Alaska Avalanche Information Center | Nonprofit centre | 0 | AK |
| Bridgeport Avalanche Center | Forest Service centre | 1 | CA |
| Bridger-Teton Avalanche Center | Forest Service centre | 4 | WY |
| Central Oregon Avalanche Center | Nonprofit centre | 2 | OR |
| Chugach National Forest Avalanche Center | Forest Service centre | 4 | AK |
| Coastal Alaska Avalanche Center | Nonprofit centre | 2 | AK |
| Colorado Avalanche Information Center | State agency | 1 | CO |
| Cordova Avalanche Center | Nonprofit centre | 1 | AK |
| Crested Butte Avalanche Center | Nonprofit centre | 0 | CO |
| Eastern Alaska Range Avalanche Center | Nonprofit centre | 2 | AK |
| Eastern Sierra Avalanche Center | Nonprofit centre | 1 | CA |
| Eastern Wyoming Avalanche Info Exchangeobservation exchange, no rating issued | Nonprofit centre | 3 | WY |
| Flathead Avalanche Center | Forest Service centre | 3 | MT |
| Gallatin NF Avalanche Center | Forest Service centre | 8 | MT |
| Haines Avalanche Center | Nonprofit centre | 3 | AK |
| Hatcher Pass Avalanche Center | Nonprofit centre | 1 | AK |
| Idaho Panhandle Avalanche Center | Forest Service centre | 5 | ID |
| Kachina Peaks Avalanche Center | Nonprofit centre | 1 | AZ |
| Mount Shasta Avalanche Center | Forest Service centre | 1 | CA |
| Mount Washington Avalanche Center | Forest Service centre | 1 | NH |
| New York State Avalanche Center | State agency | 1 | NY |
| Northwest Avalanche Center | Forest Service centre | 10 | WA |
| Payette Avalanche Center | Forest Service centre | 2 | ID |
| Sawtooth Avalanche Center | Forest Service centre | 4 | ID |
| Sierra Avalanche Center | Forest Service centre | 1 | CA |
| Southern Oregon Avalanche Info Exchangeobservation exchange, no rating issued | Nonprofit centre | 1 | OR |
| Taos Avalanche Center | Nonprofit centre | 1 | NM |
| Utah Avalanche Center | Forest Service centre | 9 | UT |
| Valdez Avalanche Center | Nonprofit centre | 3 | AK |
| Wallowa Avalanche Center | Nonprofit centre | 4 | OR |
| West Central Montana Avalanche Center | Nonprofit centre | 3 | MT |
Each organisation’s forecast is published on its own site, linked above. Register assignments follow the registry’s own classification of each centre; two untyped centres and two exchanges were classified from their own published descriptions.
USDA Forest Service, Forecasting avalanches“The Bridgeport Avalanche Center is one of 14 Forest Service avalanche centers.”
Centre details on this page were checked one by one on 2026-09-03.
The 37 states with no forecast zone
13 states had at least one forecast zone filed under them on 2026-09-03; the other 37 did not. Zones are filed by the centre that publishes them, so that is a statement about where zones are filed rather than where avalanches happen, and each state below carries its own reason from the record.
Partly inside a forecast area, with no zone of its own
- NevadaNevada has no forecast zone filed under it, though part of the state sits inside a forecast area. The Sierra Avalanche Center’s only polygon is filed under California, but the centre’s registry entry lists National Weather Service public zones on both sides of the state line, NVZ002 Greater Lake Tahoe and CAZ072 Greater Lake Tahoe (CA), and the polygon’s eastern edge sits east of the 120 degree line in the Carson Range. Terrain on the Nevada side of Tahoe is inside that forecast; terrain in the Ruby Mountains, the Santa Rosas and the rest of the Great Basin is not inside any. The Sierra Avalanche Center is the centre to read for the Tahoe side, and the CAIC archive records 15 avalanche deaths in Nevada since 1950, 2024-25 being the most recent.
Avalanche deaths on record, no forecast centre
- MaineNo avalanche centre forecasts Maine, yet the CAIC archive records 2 avalanche deaths in the state since 1950, the most recent in 1983-84. Unforecast is not the same as safe: it means nobody is publishing a rating for the terrain.
- North DakotaNo avalanche centre forecasts North Dakota, yet the CAIC archive records 1 avalanche death in the state since 1950, the most recent in 2007-08. Unforecast is not the same as safe: it means nobody is publishing a rating for the terrain.
- VermontNo avalanche centre forecasts Vermont, yet the CAIC archive records 1 avalanche death in the state since 1950, the most recent in 2004-05. Unforecast is not the same as safe: it means nobody is publishing a rating for the terrain.
No forecast zone and no death in the archive
Alabama, Arkansas, Connecticut, Delaware, Florida, Georgia, Hawaii, Illinois, Indiana, Iowa, Kansas, Kentucky, Louisiana, Maryland, Massachusetts, Michigan, Minnesota, Mississippi, Missouri, Nebraska, New Jersey, North Carolina, Ohio, Oklahoma, Pennsylvania, Rhode Island, South Carolina, South Dakota, Tennessee, Texas, Virginia, West Virginia, Wisconsin.
No avalanche centre files a forecast zone under any of those 33 states, and the Colorado Avalanche Information Center’s national accident archive records no avalanche death in any of them since 1950. That is a statement about the record and not a guarantee: the archive counts deaths, not avalanches, and small slides on steep snow are possible anywhere snow sits on a slope of about thirty degrees or more.
Avalanche forecast FAQ
Avalanche forecasts by state
Related conditions
The five-level scale this whole system runs on was published in 2010 and updated in 2022, and is maintained by a working group of United States and Canadian organisations rather than by any single agency. Its repository publishes the definition tables, the icons and the official colour specification, and that colour table is where the five colours on this site come from.
Summarised from the National Avalanche Center’s NAPADS repository, linked for the original text.
Live danger ratings on this page come from api.avalanche.org, run by the USDA Forest Service National Avalanche Center with the American Avalanche Association, and are the issuing centres’ own words passed through untouched. Live avalanche watches, warnings and advisories on the state pages come from api.weather.gov, a US Government work in the public domain. Accident figures come from the Colorado Avalanche Information Center.
Structural snapshot of the forecasting system (which centres exist, which zones each publishes, roughly where they are) read from api.avalanche.org on 2026-09-03: 31 centres, 83 zones, 13 states. It holds structure only; ratings are read live at page load. Accident figures are the Colorado Avalanche Information Center’s, read 2026-09-03. Please cite the CAIC 2024 for all use. Dates shown as Sep 3, 2026.
Every rating on this site is the issuing centre’s own and forecast text is read on the centre’s page. Read the centre’s full forecast before you go.
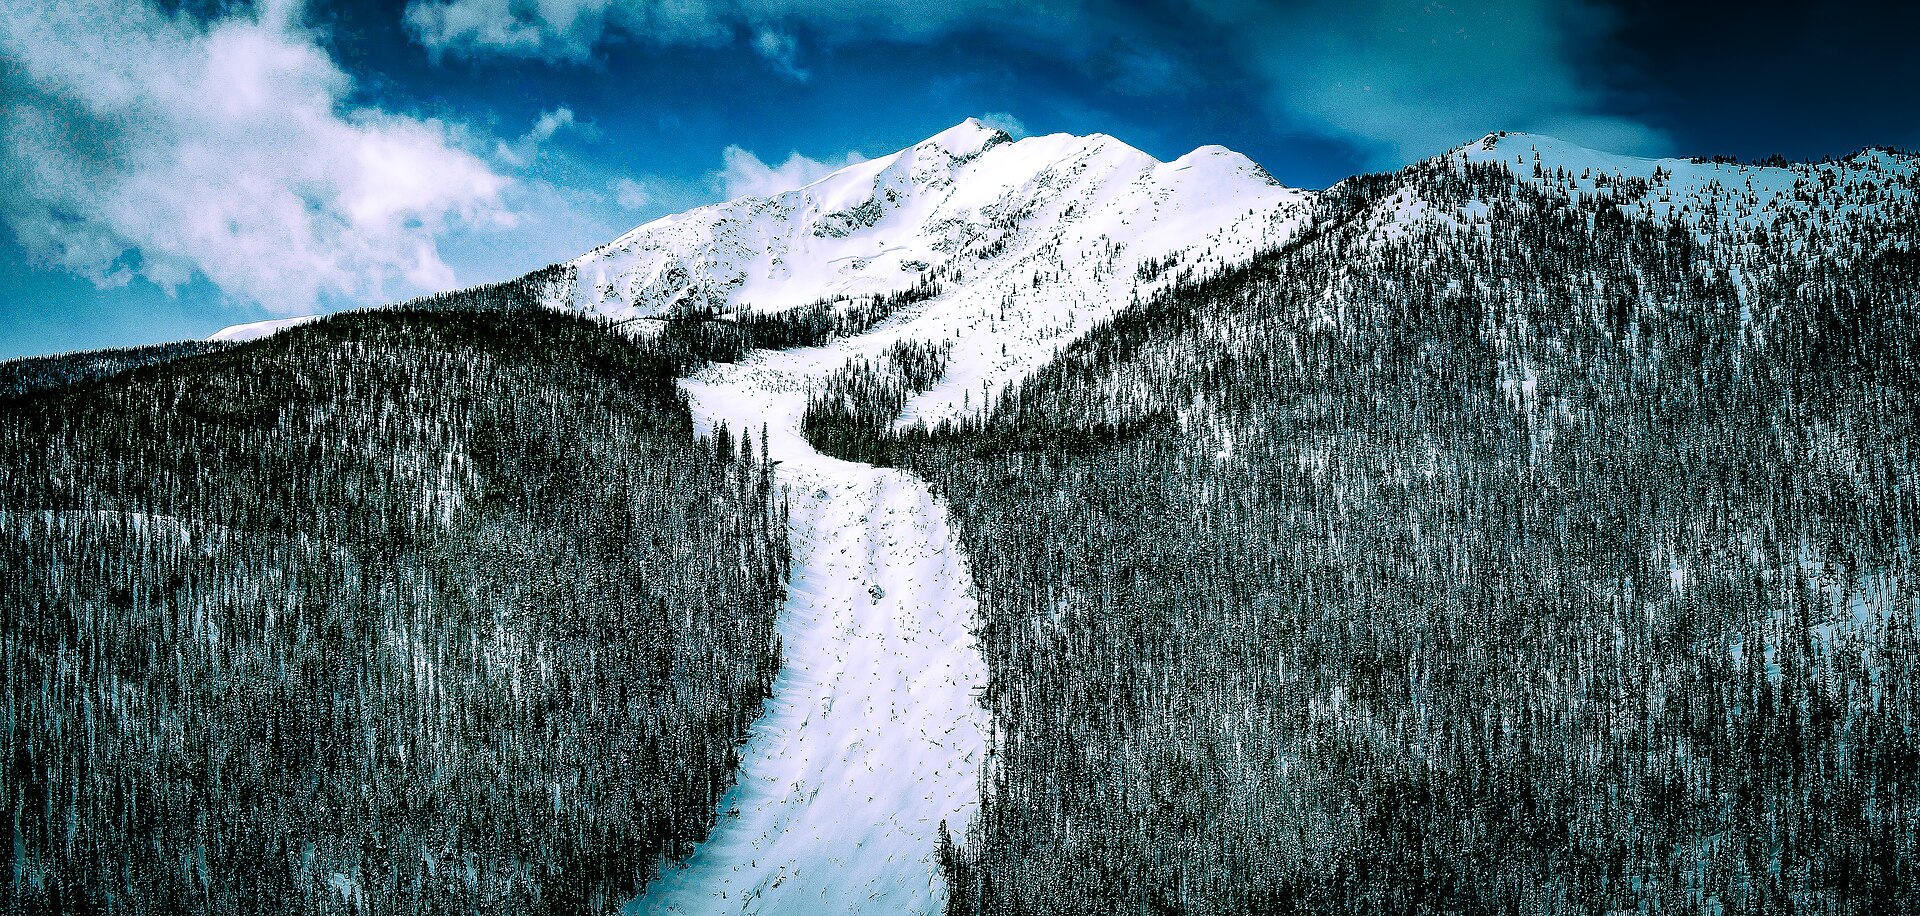
Hero image: “Silent Bob Avalanche” — 420 Photography — CC0