
New Mexico Avalanche Forecast
Today's avalanche danger for every New Mexico forecast zone, with a link to the centre's full forecast, which is the thing to plan on.
Reading the New Mexico forecast zones from api.avalanche.org.New Mexico danger ratings today
Find the forecast zone for where you are going
Finds the nearest of the 83 US forecast zones and shows what each one’s centre has published right now. Each rating applies to the named zone, an area typically tens of miles across, never to the ZIP itself or to a specific slope.
What the five danger levels mean
Taos Avalanche Center publishes on the same five-level North American scale, which is why a rating here means the same thing as a rating in another state. The level, the name and the official colour are below; what a level means and what the scale says about travelling in it is published beside the forecast that applies it, on the centre’s page.
- 1Low#50B848
- 2Moderate#FFF200
- 3Considerable#F7941E
- 4High#ED1C24
- 5Extreme#231F20
- –No ratingnot a level
Those are the five levels of the North American Public Avalanche Danger Scale, with the official colours from the National Avalanche Center’s own colour table. The scale was published in 2010 and updated in 2022, and is maintained by a working group of United States and Canadian organisations rather than by a single agency. What each level means, and what the scale says about travelling in it, is published beside the forecast that applies it, on the issuing centre’s page. The grey chip marks a zone whose centre has published no rating; it is not a sixth level.
National Weather Service avalanche products for New Mexico
Separately from the avalanche centres, the National Weather Service issues three avalanche products of its own: an Avalanche Warning, an Avalanche Watch and an Avalanche Advisory, usually in coordination with the centre that covers the ground. They are US Government works and are reproduced here word for word.
New Mexico in the national accident record
CAIC archive, 1950-51 to 2024-25Colorado Avalanche Information Center numbers, republished with attribution. Please cite the CAIC 2024 for all use. A count of deaths is not a rating and not a ranking of danger: it tracks how many people go into avalanche terrain at least as closely as it tracks the terrain.
When New Mexico avalanche deaths happen
- Oct0
- Nov0
- Dec0
- Jan2
- Feb0
- Mar0
- Apr0
- May0
- Jun0
- Jul0
- Aug0
- Sep0
2 avalanche deaths in New Mexico across the 10 seasons 2015-16 to 2024-25, by month, from the Colorado Avalanche Information Center accident archive. Please cite the CAIC 2024 for all use. These are deaths in the national accident archive, not avalanches and not a danger rating. A month or a state with a low count is not a safe one: most of the difference between them is how many people are out in avalanche terrain.
Nationally, Feb, Jan, Mar account for 74 percent of avalanche deaths across the last ten seasons, and the New Mexico shape above is the state’s own share of that record. It is a small sample by design: these are individual deaths, not a rate, and a month showing zero in ten seasons is a small number rather than a safe month.
New Mexico has 6 recorded avalanche deaths since 1950-51 and 2 in the last ten seasons, with the most recent in 2018-19. Read those beside the other states rather than alone.
| State | Since 1950-51 | Last 10 seasons | Most recent | Forecast zones |
|---|---|---|---|---|
| CO | 328 | 58 | 2024-25 | yes |
| AK | 177 | 32 | 2024-25 | yes |
| WA | 139 | 23 | 2024-25 | yes |
| UT | 138 | 24 | 2024-25 | yes |
| MT | 130 | 22 | 2023-24 | yes |
| WY | 101 | 24 | 2024-25 | yes |
| ID | 96 | 25 | 2024-25 | yes |
| CA | 74 | 12 | 2024-25 | yes |
| OR | 25 | 9 | 2024-25 | yes |
| NH | 17 | 2 | 2020-21 | yes |
| NV | 15 | 4 | 2024-25 | none filed |
| NM | 6 | 2 | 2018-19 | yes |
| NY | 4 | 0 | 1999-00 | yes |
| ME | 2 | 0 | 1983-84 | none filed |
| AZ | 1 | 0 | 1994-95 | yes |
| ND | 1 | 0 | 2007-08 | none filed |
| VT | 1 | 0 | 2004-05 | none filed |
The organisation that covers New Mexico
New Mexico has one forecast zone, Northern New Mexico, published by the Taos Avalanche Center, a nonprofit. The terrain it covers is the southern end of the Sangre de Cristo range, where the Rockies run out, and it holds a thin continental snowpack that is notorious for persistent weak layers: little snow, cold clear nights, and a structure that can stay dangerous for weeks after the storm that built it. The CAIC archive records six avalanche deaths in New Mexico since 1950, two of them in the last ten seasons, most recently in 2018-19.
Where the map stops. One zone in the north. The Jemez, the Sacramentos and everything south of Taos are outside it. Unforecast ground is ground no forecaster is assessing, not ground anybody has found quiet.
The zones filed under New Mexico on 2026-09-03: Northern New Mexico. Zone lists move through the year, so the live board at the top of this page is the one to read; this is the structural snapshot the rest of the page is built on. Zone boundaries do not follow state lines either, so a zone filed under New Mexico may cover ground next door and a neighbour’s zone may cover ground here.
New Mexico avalanche FAQ
Related conditions in New Mexico
Avalanche forecasts by state
Avalanche forecasts across the country, including the danger scale, who runs the centres, the national accident record and the states with no forecast zone at all.
Live danger ratings on this page come from api.avalanche.org, run by the USDA Forest Service National Avalanche Center with the American Avalanche Association, and are the issuing centres’ own words passed through untouched. Live avalanche watches, warnings and advisories come from api.weather.gov, a US Government work in the public domain, reproduced verbatim. New Mexico accident figures come from the Colorado Avalanche Information Center.
Structural snapshot of the forecasting system (which centres exist, which zones each publishes, roughly where they are) read from api.avalanche.org on 2026-09-03: 31 centres, 83 zones, 13 states. It holds structure only; ratings are read live at page load. Accident figures are the Colorado Avalanche Information Center’s, read 2026-09-03. Please cite the CAIC 2024 for all use. Dates shown as Sep 3, 2026.
Every rating on this site is the issuing centre’s own and forecast text is read on the centre’s page. Read the centre’s full forecast before you go.
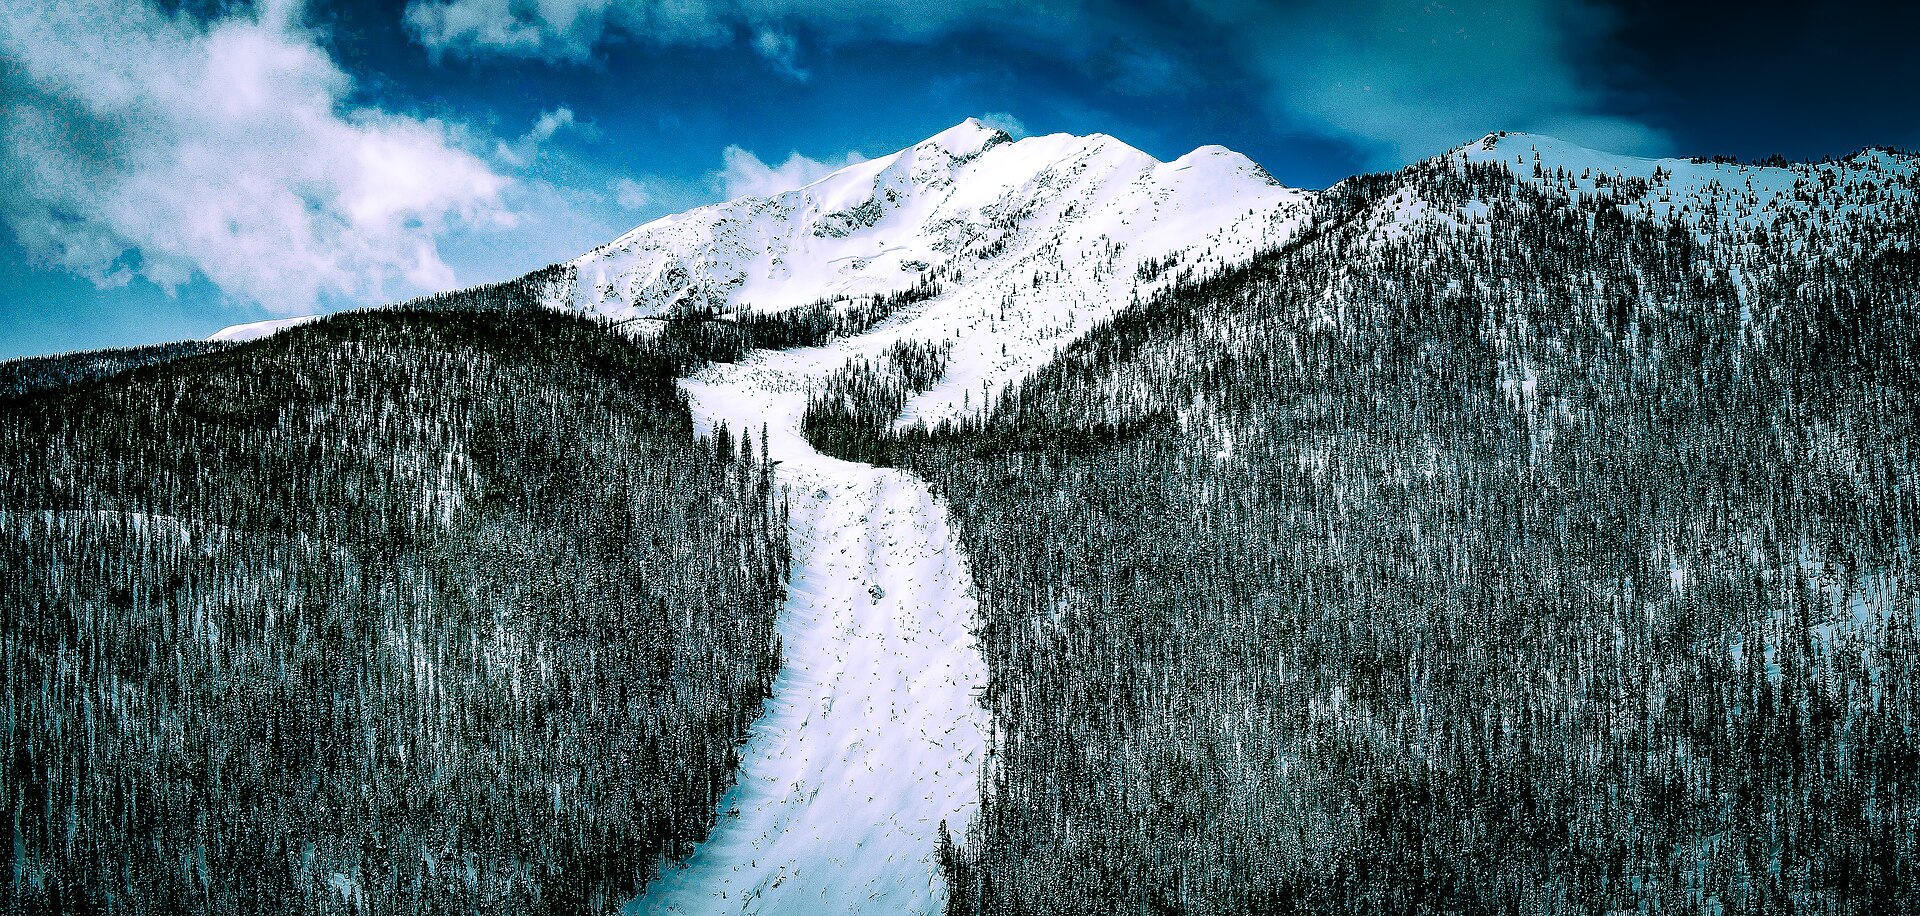
Hero image: “Silent Bob Avalanche” — 420 Photography — CC0