
Fire Danger, State by State
Live National Weather Service fire weather in the issuing office's own words, the federal fire record for every state, and the one page in each state that answers the burn question.
Checking api.weather.gov for active fire weather products in the United States.Where the country stands, in NIFC’s own numbers
National Fire News, September 2, 2026Those are NIFC’s figures as its National Fire News page stood on 2026-09-03. The National Preparedness Level is a statement about how committed national firefighting resources are, not about the weather outside your window. Burn bans are set county by county by each state’s own authority.
Every active fire weather product in the country
These are National Weather Service products, read live from the public alerts API and reproduced word for word. They are issued against fire weather zones rather than counties, and there are 3,535 of those zones across the 50 states, from 4 in New Hampshire to 293 in Texas. A warning almost never covers a whole state.
Everybody calls it fire danger and they mean four things
Most of the confusion on this subject comes from four separate measures sharing one name. They are published by different bodies, on different timescales, and none of them decides whether you are allowed to light a fire.
One. The National Weather Service product. A Red Flag Warning or a Fire Weather Watch, issued for the next day or two against a fire weather zone.
NOAA National Weather Service, Understanding Wildfire Warnings, Watches and Behavior“NWS issues a Red Flag Warning, in conjunction with land management agencies, to alert land managers to an ongoing or imminent critical fire weather pattern. NWS issues a Red Flag Warning when fire conditions are ongoing or expected to occur shortly.”
NOAA National Weather Service, Understanding Wildfire Warnings, Watches and Behavior“A Watch alerts land managers and the public that upcoming weather conditions could result in extensive wildland fire occurrence or extreme fire behavior. A watch means critical fire weather conditions are possible but not imminent or occurring.”
Two. The fire danger class. The Low, Moderate, High, Very High, Extreme scale on the roadside sign. It comes from the National Fire Danger Rating System and is published by land management agencies for their own units, which is why the sign a mile up the road can disagree with the one behind you.
NOAA National Weather Service Glossary, National Fire Danger Rating System“A uniform fire danger rating system used in the United States that focuses on the environmental factors that impact the moisture content of fuels. Fire danger is rated daily over large administrative areas, such as national forests.”
Three. The National Preparedness Level. NIFC’s own measure of how stretched the national firefighting system is, 1 to 5. It was at PL 5 as of July 18, 2026 at 7:30 a.m. MDT. It says nothing about conditions in any particular place. In 2025 alone NIFC moved it 14 times, and the year logged 50 days at PL 4 and none at PL 5.
Four. Drought. The US Drought Monitor’s D0 to D4 categories, published weekly, which describe how much of the landscape is dry enough to carry fire at all. Drought is the slow half and the weather on the day is the fast half. The drought pages carry those numbers for every state.
Permission is separate from all four. Whether you may burn is a legal question answered by a state agency, a county, and on federal land by the managing unit. That answer changes daily and is published by those bodies rather than nationally, so every state page here links the state’s burn authority.
How much of the country burns, and who starts it
NIFC keeps the national series and it starts in 1983. The agency explains why it goes no further back, which is worth reading before trusting any chart that runs to the 1920s.
National Interagency Fire Center, Wildfires and Acres“Prior to 1983, the federal wildland fire agencies did not track official wildfire data using current reporting processes. As a result, there is no official data prior to 1983 posted on this site.”
That is the whole story of American fire in four numbers. People start roughly eight fires for every one lightning starts, and lightning still burns about as many acres, because lightning fires begin in country that takes a day to reach. The pattern flips completely by region: in NICC’s Southern Area, human causes ran 36,040 fires in 2025 against 1,048 lightning ones, while in Alaska it was 217 against 248.
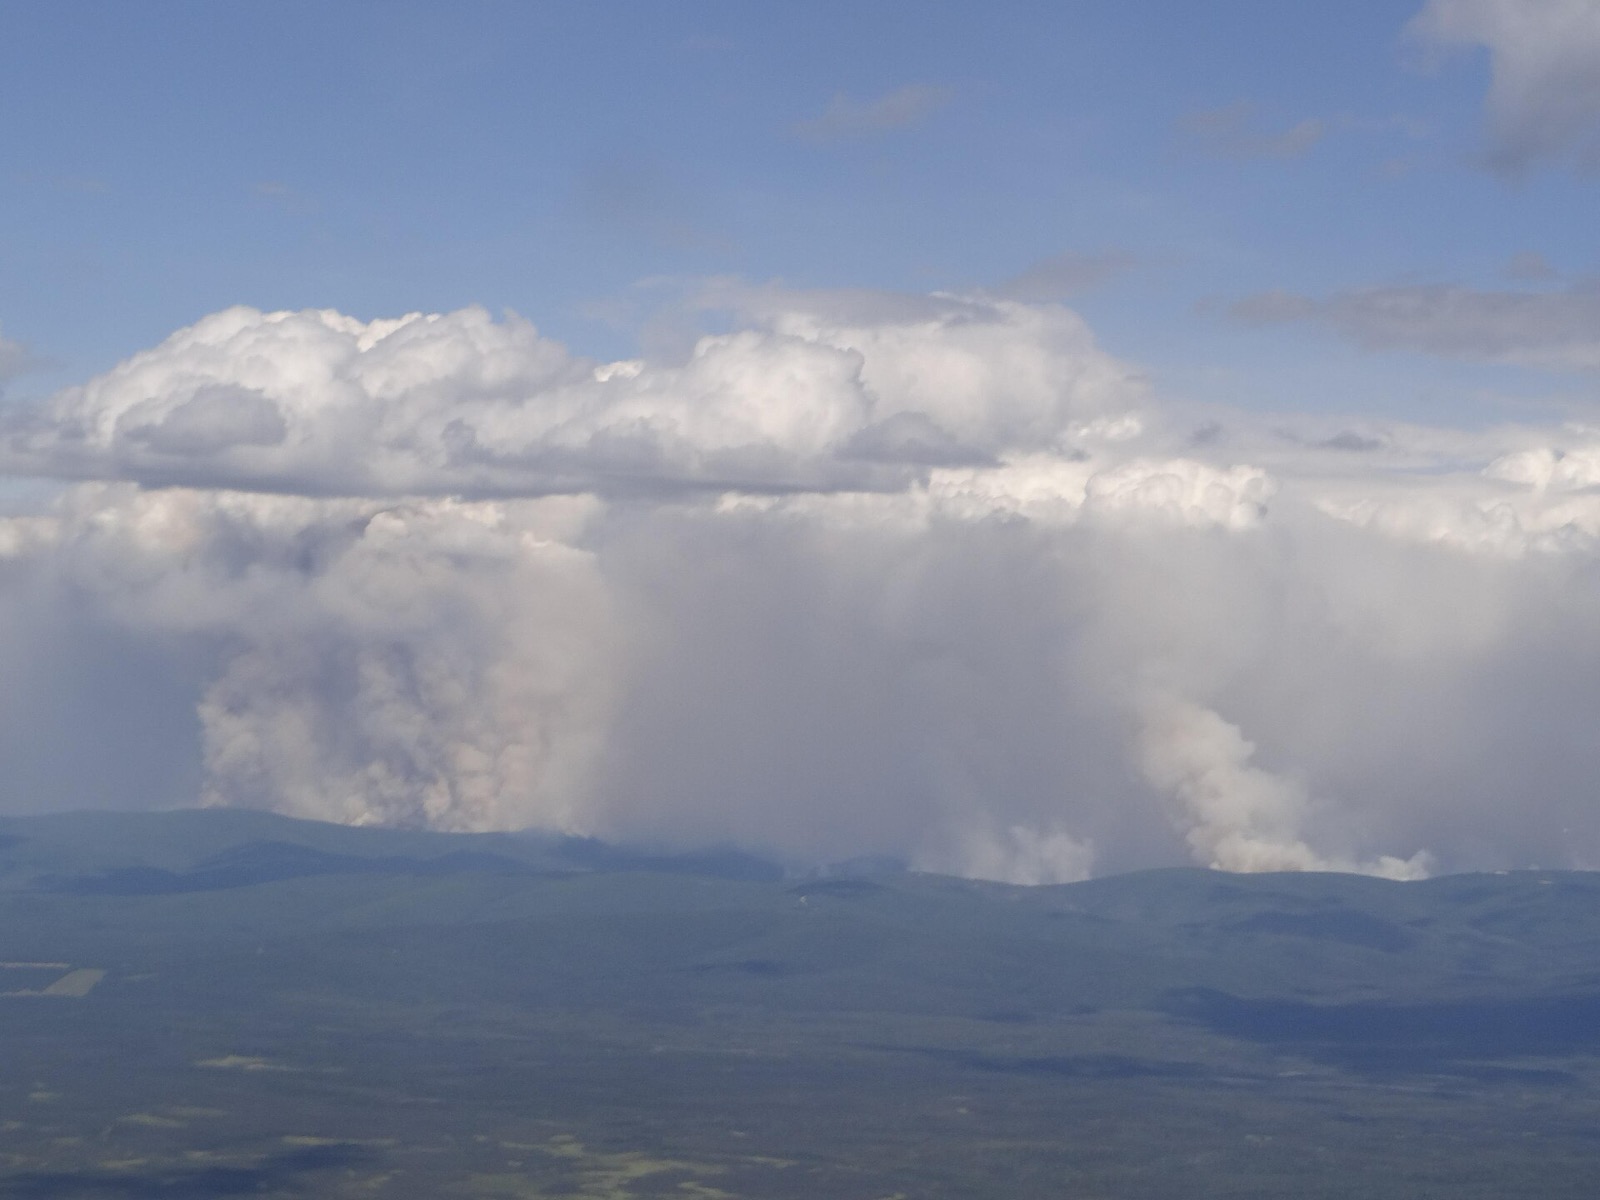
NIFC also publishes the same-date comparison, which is the only fair way to read a season in progress. As of September 2, 2026, 2026 stood at 52,626 fires and 8,265,751 acres. On the same date in 2025 it was 47,183 fires and 4,150,547 acres, and in 2024 34,126 and 6,459,301. Year to year swings of that size are normal and are not a trend.
The cost side of the record lags the acres by two years: NIFC’s federal firefighting cost series ends at 2023, when suppression alone cost $3.17 billion, of which $2.70 billion was the Forest Service.
Why some states appear to have almost no fires
Every per-state number on this site comes from one NICC table, and NICC heads that table with a sentence that does more work than anything else on this page.
NICC Wildland Fire Summary and Statistics Annual Report 2025, Wildland Fires and Acres Burned by State and Agency“Figures are from the SIT/209 Application”
The Situation Report is a reporting stream, not a census. A fire a volunteer department puts out in an afternoon and never reports through it is not counted. In five states no state agency reports into it at all, so those states’ figures describe federal and tribal land only: Arkansas, Hawaii, Kansas, Kentucky, South Carolina.
Kansas is the clearest case. The 2025 table shows 37 fires for the whole state, in a state that runs the Flint Hills prescribed burning season every spring and has thousands of grass fires a year. The 37 is not wrong; it is a complete count of something much smaller than Kansas. Read every low number on this site that way, and check the state agency’s own figures if the answer matters.
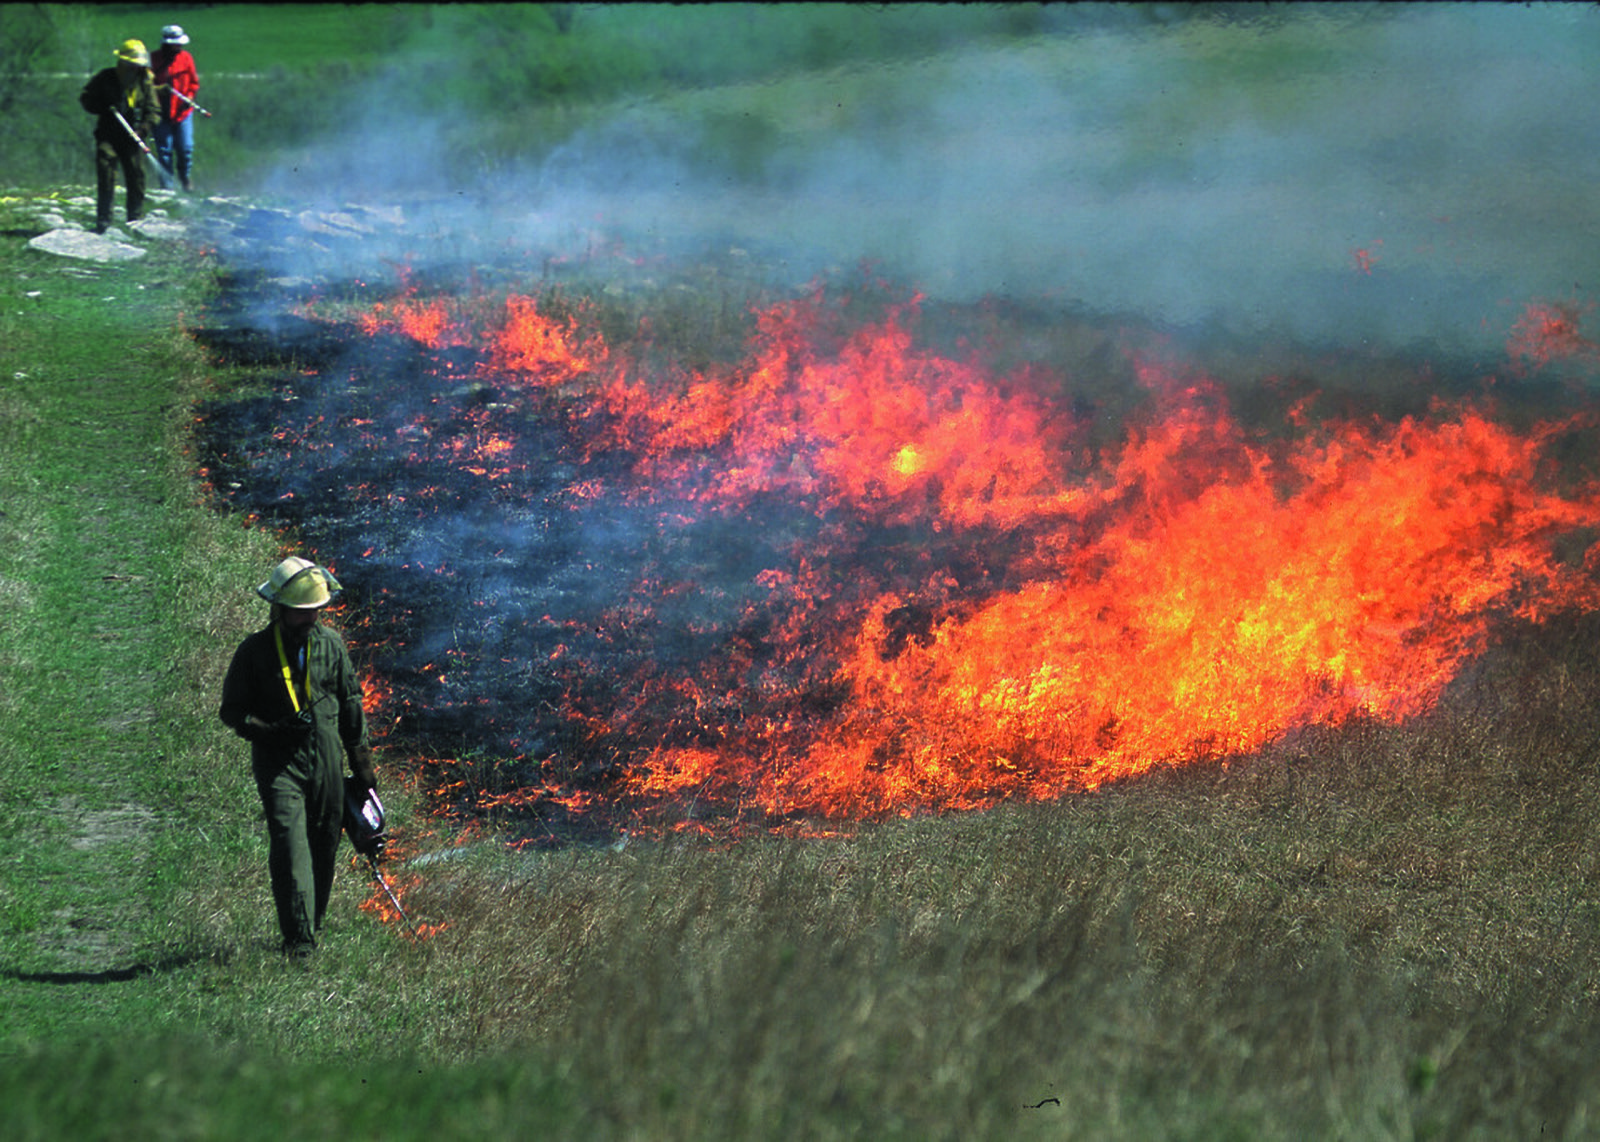
The Southeast burns more on purpose than the West burns by accident
That claim holds on both readings against federal data, and the arithmetic is here in full. The Forest Service publishes the Southeast figure:
USDA Forest Service, Prescribed fire versus raging wildfire“Each year, the Southeast burns nearly 6.5 million acres for forest management and 3.8 million acres for agriculture across federal, tribal, state, and private lands.”
Against that, NICC’s own ten year average wildfire acres for the western Geographic Areas come to about 6.31 million acres a year including Alaska, and about 4.94 million without it, since a great deal of Alaska is not what people mean by the West. So nearly 6.5 million acres of deliberate forest management burning in the Southeast exceeds the western wildfire average either way, comfortably so once Alaska is set aside.
USDA Forest Service, Prescribed fire versus raging wildfire“The Forest Service’s Southern Region is home to the largest hazardous fuels reduction program in the country with more than 60% of all prescribed fire occurring in the Southeast.”
Two caveats travel with that comparison. The two figures come from different programmes: the wildfire acres are NICC’s reported totals through the Situation Report, and the Southeast prescribed fire figure is a Forest Service estimate across all land ownerships. And “the West” has no single definition; this one is NICC’s Geographic Areas, stated so it can be checked.
NIFC published national prescribed fire totals by agency from 1998 to 2019, when 6,058,508 acres were treated nationally, and the series stops there on NIFC’s own page, so the most recent national prescribed fire figure in that series is now several years old.
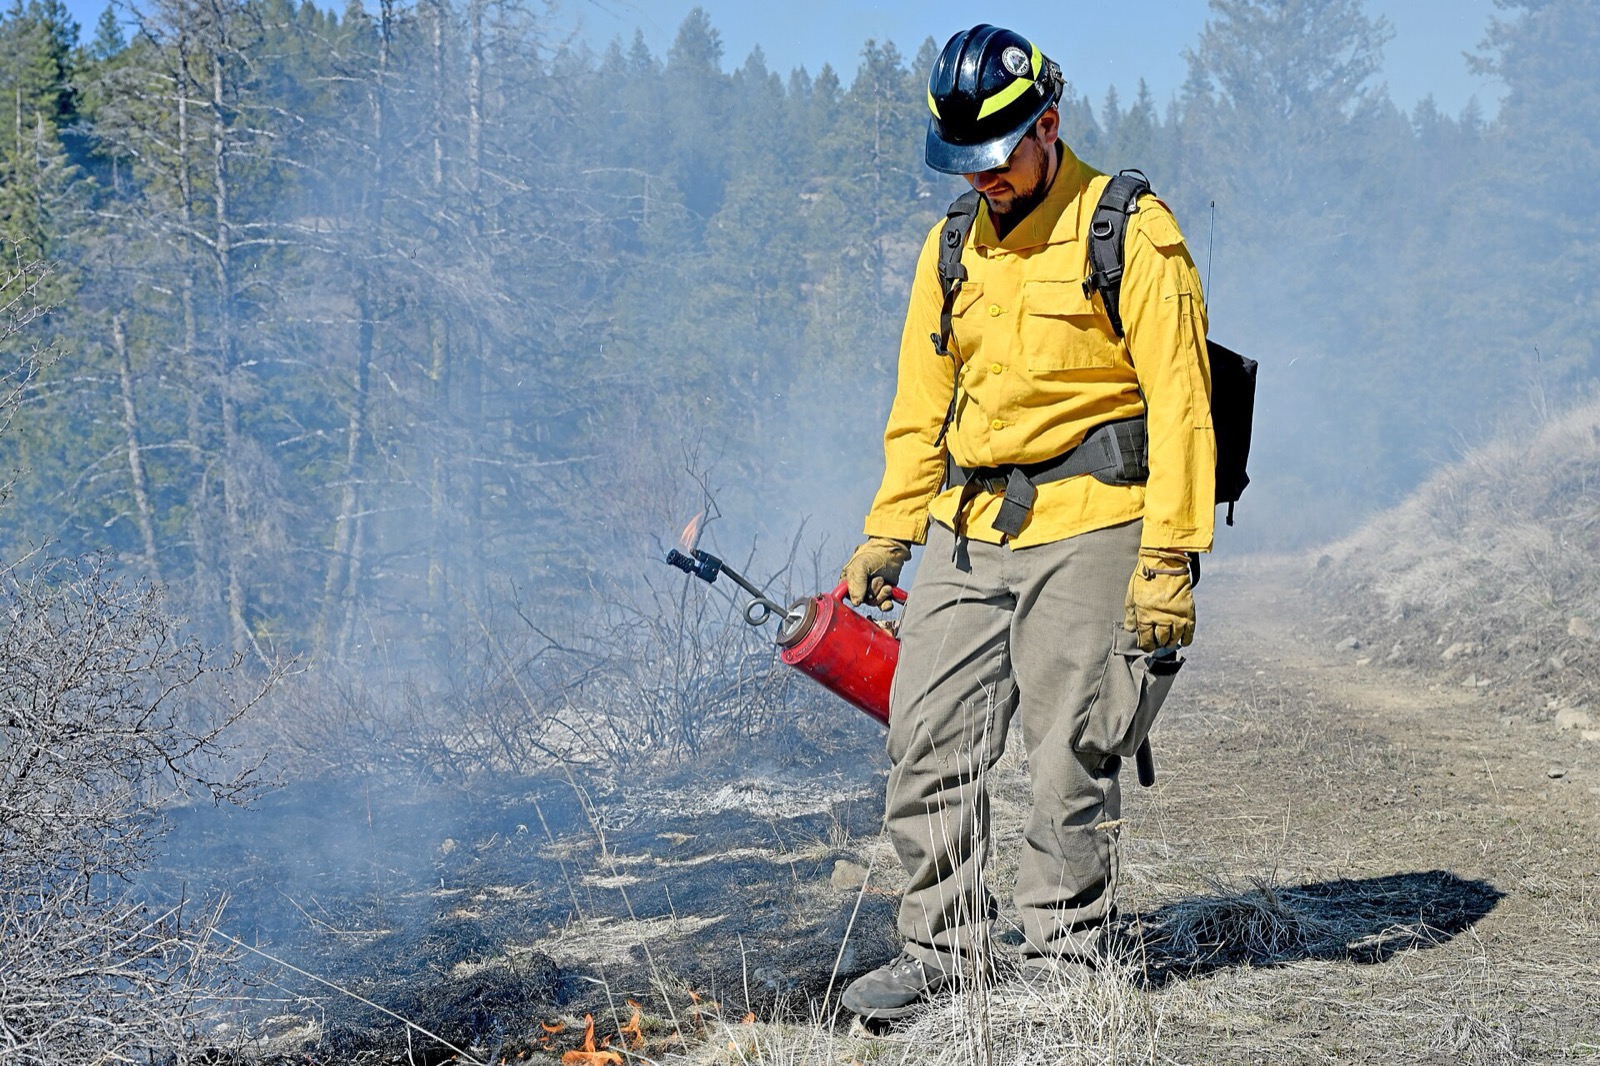
NOAA National Weather Service Glossary, Prescribed Fire“A management ignited or natural wildland fire that burns under specified conditions where the fire is confined to a predetermined area and produces the fire behavior and fire characteristics required to attain planned fire treatment and resource management objectives.”
The federal record, state by state
Ordered by acres, which measures scale rather than danger. 11 states are lightning led, where lightning takes at least half the acres burned. 30 are human led, where lightning is effectively absent from both of NICC’s columns. 9 sit in between. The dagger marks the five states where no state agency reports into the federal stream at all.
| State | Fires | Acres | Human share | Acres by lightning | NWS fire zones | Pattern |
|---|---|---|---|---|---|---|
| Alaska | 465 | 1,006,158 | 47% | 100% | 120 | Lightning takes at least half the acres |
| California | 8,951 | 505,006 | 86% | 26% | 170 | Lightning is a real but minority source |
| Arizona | 1,626 | 331,638 | 70% | 84% | 29 | Lightning takes at least half the acres |
| Oregon | 2,734 | 324,106 | 52% | 51% | 43 | Lightning takes at least half the acres |
| Oklahoma | 2,530 | 304,120 | 100% | 0% | 82 | Almost every fire starts with a person |
| Colorado | 1,123 | 255,970 | 51% | 82% | 55 | Lightning takes at least half the acres |
| Nevada | 616 | 253,614 | 55% | 87% | 20 | Lightning takes at least half the acres |
| Washington | 1,874 | 247,068 | 80% | 65% | 39 | Lightning takes at least half the acres |
| Florida | 3,704 | 233,645 | 79% | 61% | 132 | Lightning takes at least half the acres |
| Wyoming | 584 | 199,290 | 52% | 86% | 43 | Lightning takes at least half the acres |
| Idaho | 1,498 | 182,005 | 59% | 57% | 20 | Lightning takes at least half the acres |
| New Mexico | 903 | 179,384 | 60% | 80% | 20 | Lightning takes at least half the acres |
| Utah | 1,093 | 159,306 | 66% | 33% | 21 | Lightning is a real but minority source |
| Texas | 5,829 | 146,165 | 97% | 3% | 293 | Almost every fire starts with a person |
| Missouri | 1,671 | 98,737 | 100% | 0% | 115 | Almost every fire starts with a person |
| Nebraska | 511 | 96,682 | 94% | 4% | 69 | Lightning is a real but minority source |
| Montana | 2,432 | 75,830 | 65% | 70% | 32 | Lightning takes at least half the acres |
| Mississippi | 1,812 | 69,724 | 100% | 1% | 82 | Almost every fire starts with a person |
| Virginia | 7,709 | 59,661 | 100% | 0% | 115 | Almost every fire starts with a person |
| South Dakota | 458 | 52,797 | 80% | 2% | 67 | Lightning is a real but minority source |
| Minnesota | 1,381 | 51,416 | 100% | 1% | 98 | Almost every fire starts with a person |
| North Carolina | 6,872 | 42,011 | 100% | 9% | 117 | Almost every fire starts with a person |
| Alabama | 1,860 | 35,258 | 100% | 0% | 71 | Almost every fire starts with a person |
| North Dakota | 430 | 32,471 | 87% | 1% | 54 | Lightning is a real but minority source |
| Georgia | 4,048 | 30,688 | 100% | 0% | 168 | Almost every fire starts with a person |
| New Jersey | 1,323 | 27,328 | 100% | 0% | 30 | Almost every fire starts with a person |
| Iowa | 3,173 | 26,023 | 100% | 0% | 99 | Almost every fire starts with a person |
| Kansas † | 37 | 17,175 | 95% | 6% | 105 | Almost every fire starts with a person |
| West Virginia | 854 | 13,930 | 100% | 0% | 68 | Almost every fire starts with a person |
| Louisiana | 861 | 13,229 | 99% | 19% | 88 | Lightning is a real but minority source |
| Kentucky † | 758 | 12,937 | 100% | 0% | 120 | Almost every fire starts with a person |
| Tennessee | 842 | 12,642 | 98% | 0% | 102 | Almost every fire starts with a person |
| Maryland | 176 | 8,168 | 94% | 0% | 30 | Lightning is a real but minority source |
| Arkansas † | 192 | 6,686 | 97% | 19% | 92 | Lightning is a real but minority source |
| Pennsylvania | 1,546 | 5,509 | 100% | 0% | 78 | Almost every fire starts with a person |
| Hawaii † | 9 | 3,299 | 89% | 0% | 43 | Lightning is a real but minority source |
| Wisconsin | 1,284 | 3,098 | 99% | 1% | 74 | Almost every fire starts with a person |
| Michigan | 516 | 1,295 | 98% | 7% | 91 | Almost every fire starts with a person |
| Illinois | 40 | 1,284 | 100% | 0% | 102 | Almost every fire starts with a person |
| Ohio | 560 | 1,134 | 99% | 0% | 89 | Almost every fire starts with a person |
| Massachusetts | 1,158 | 928 | 99% | 1% | 26 | Almost every fire starts with a person |
| New York | 203 | 841 | 96% | 1% | 14 | Almost every fire starts with a person |
| South Carolina † | 71 | 760 | 100% | 0% | 60 | Almost every fire starts with a person |
| Connecticut | 256 | 548 | 100% | 0% | 13 | Almost every fire starts with a person |
| Maine | 856 | 515 | 100% | 0% | 14 | Almost every fire starts with a person |
| New Hampshire | 157 | 146 | 97% | 1% | 6 | Almost every fire starts with a person |
| Delaware | 15 | 82 | 100% | 0% | 4 | Almost every fire starts with a person |
| Vermont | 106 | 70 | 96% | 1% | 9 | Almost every fire starts with a person |
| Rhode Island | 62 | 66 | 100% | 0% | 8 | Almost every fire starts with a person |
| Indiana | 30 | 38 | 100% | 0% | 95 | Almost every fire starts with a person |
Fire danger by state
Six agencies, and the three that answer the burn question
NOAA National Weather Service
Issues Red Flag Warnings, Fire Weather Watches and Extreme Fire Danger products against fire weather zones, in conjunction with land management agencies. It does not decide whether anything may be burned, and it does not publish the Low to Extreme class on the roadside sign.
NOAA Storm Prediction Center
Publishes the national Fire Weather Outlook a day to eight days ahead, which is the map local offices work from when they decide whether to issue a warning. A forecast product, not an order.
National Interagency Fire Center and NICC
Runs the national coordination system, sets the National Preparedness Level on a 1 to 5 scale, and publishes the fire statistics every number on this page comes from. It does not issue local restrictions.
Your state forestry or fire agency
Publishes the state fire danger class, runs the burn permit system where the state has one, and declares statewide bans where the state has that power. This is one of only two bodies with a current answer about burning. Every state page here links its page directly.
Your county, city or fire district
The other body with a current answer, and in most of the country the one that actually issues the order. County burn bans are declared and lifted by commissions and sheriffs, sometimes inside a day, and there is no national register of them.
The federal unit next door
A national forest, national park, BLM district or wildlife refuge issues its own fire restrictions, separately from the state and often differing from it. If your ground touches federal land, that unit is a third authority.
New York is a useful illustration of how specific a state rule can get.
New York State Department of Environmental Conservation“The burning of brush is prohibited from March 16 through May 14 due to the increased risk of wildfires.”
Fire danger FAQ
Related conditions
Live products come from api.weather.gov and are reproduced in the issuing office’s own words. The fire record comes from the National Interagency Fire Center statistics pages, National Fire News and the NICC Wildland Fire Summary and Statistics Annual Report, read 2026-09-03. Prescribed fire context is the USDA Forest Service’s. Drought percentages are the US Drought Monitor’s. Every state burn authority link was checked in a browser on 2026-09-02. Permission to burn is issued by the state and county authorities linked above, and by them only.
NIFC licensing, verified from DOI’s own notice: “Generally, materials produced by federal agencies are in the public domain and may be reproduced without permission. However, not all materials appearing on this web site are in the public domain. Some materials have been donated or obtained from individuals or organizations and may be subject to restrictions on use.” No photograph on this site is taken from nifc.gov, because that notice warns that donated material there may be restricted.
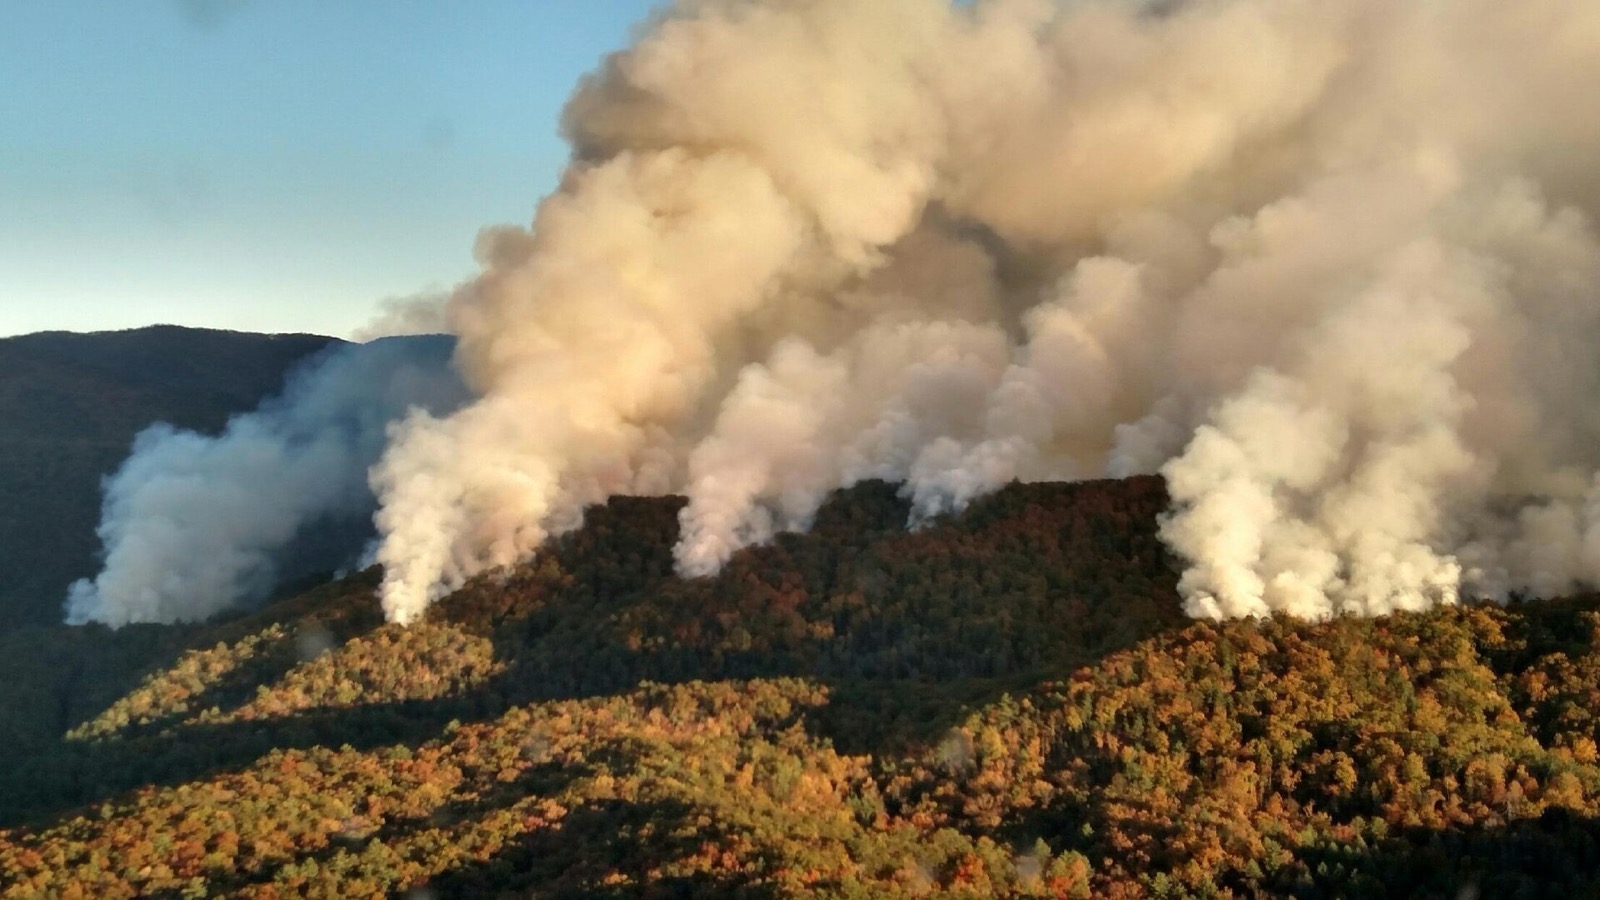
Hero image: “Rough Ridge Fire Smoke Columns” — National Wildfire Coordinating Group — Public domain It shows the Rough Ridge Fire burning through autumn hardwood in the southern Appalachians in November 2016.
Fire danger hub