
North Carolina Fire Danger
Live National Weather Service fire weather for North Carolina, the federal record of what fire actually looks like here, and the page where North Carolina Forest Service publishes burn bans and permits.
Checking api.weather.gov for active fire weather products in North Carolina.North Carolina in the federal fire record
NICC 2025, reported through SIT/209North Carolina is a state where essentially every fire starts with a person. Every figure here is NICC’s, from the interagency Situation Report for calendar 2025. Those are last year’s totals, not today’s conditions.
What the National Weather Service has out in North Carolina
The National Weather Service divides North Carolina into 117 fire weather zones, counted from api.weather.gov on 2026-09-02. Red Flag Warnings and Fire Weather Watches are issued against those zones rather than against counties or states, which is why a warning almost never covers the whole state and why the zone named in the product matters more than the state named on this page.
Who decides whether you may burn in North Carolina
North Carolina reported 6,872 fires in 2025, the third highest count in the country, but only 42,011 acres, about six acres each. That combination means a very large number of small fires reported by a state agency that reports thoroughly, which is the mirror image of neighbouring South Carolina in the same table. North Carolina requires a burning permit for open burning near woodland.
How fire starts in North Carolina Who to Ask Before You Burn
NICC publishes two cause columns for every state, human and lightning, for both ignitions and acres. Reading them together is the useful move, because the two rarely agree: a state can have almost every fire started by a person and still have most of its acreage burned by lightning, because lightning fires start in country nobody can reach quickly.
NICC Wildland Fire Summary and Statistics Annual Report 2025, Wildland Fires and Acres Burned by State and Agency. NICC’s counts and NICC’s cause attribution, reported through the interagency Situation Report, so fires that never entered that stream are not here.
Where these numbers come from, and what is missing. Every North Carolina figure here is from NICC’s state table, which NICC heads “Figures are from the SIT/209 Application”. That is the interagency Situation Report. A fire a local department handles and never reports through it is not counted.
Agencies that filed a North Carolina row for 2025: BIA, FS, FWS, NPS, ST. ST is the state agency row, so North Carolina's figures include state protected land as well as federal and tribal.
North Carolina is one of 30 states where lightning is effectively absent from both of NICC’s columns. The blunt reading is that essentially every fire in this state was preventable by somebody, and that debris burning, equipment sparks and roadside ignitions are what the record is actually made of. That is also why the burn rules here tend to be calendar rules and permit rules rather than restriction stages.
NICC counts North Carolina in the Southern Area Geographic Area. That boundary follows the state line here, so the Geographic Area totals include this state whole.
How dry North Carolina is, in the Drought Monitor’s own categories
Those are the US Drought Monitor’s categories and its percentages, republished as numbers with attribution and not recomputed here. Drought is the slow half of fire danger: it decides how much of the landscape is available to burn and how deep a fire can get into the duff. The fast half is the weather on the day, which is what a Red Flag Warning describes. A wet spring followed by a hot dry August is the combination that catches states out, because the spring grew the fuel and the August cured it.
The full weekly picture for this state, including the worst week on record since 2000, is on the North Carolina drought page.
What a warning and a rating actually mean
Two different things get called fire danger and they come from different places. One is a National Weather Service product about the next day or two of weather. The other is a fire danger class, the Low to Extreme scale on the roadside sign, which comes from the National Fire Danger Rating System and is published by land management agencies including North Carolina Forest Service.
NOAA National Weather Service, Understanding Wildfire Warnings, Watches and Behavior“NWS issues a Red Flag Warning, in conjunction with land management agencies, to alert land managers to an ongoing or imminent critical fire weather pattern. NWS issues a Red Flag Warning when fire conditions are ongoing or expected to occur shortly.”
NOAA National Weather Service, Understanding Wildfire Warnings, Watches and Behavior“A Watch alerts land managers and the public that upcoming weather conditions could result in extensive wildland fire occurrence or extreme fire behavior. A watch means critical fire weather conditions are possible but not imminent or occurring.”
Neither is a law. Many states suspend burning permits automatically while a Red Flag Warning is in force, and where that happens it is the state’s rule rather than the warning’s. North Carolina Forest Service publishes what North Carolina does.
NOAA National Weather Service Glossary, National Fire Danger Rating System“A uniform fire danger rating system used in the United States that focuses on the environmental factors that impact the moisture content of fuels. Fire danger is rated daily over large administrative areas, such as national forests.”
Two further things worth knowing before you read a product for North Carolina. First, the thresholds are local: a Red Flag Warning is issued against criteria agreed for each fire weather zone with the land management agencies, so 25 percent relative humidity is unremarkable in the Great Basin and alarming on the Gulf Coast. Second, a fire weather product and a Fire Warning are entirely different things.
NOAA National Weather Service Glossary, Red Flag Warning“Red Flag criteria occurs whenever a geographical area has been in a dry spell for a week or two, or for a shorter period , if before spring green-up or after fall color, and the National Fire Danger Rating System (NFDRS) is high to extreme and the following forecast weather parameters are forecasted to be met: 1) a sustained wind average 15 mph or greater 2) relative humidity less than or equal to 25 percent and 3) a temperature of greater than 75 degrees F.”
The double space and the floating comma after "a shorter period" are in the published glossary entry and are left as found.
NOAA National Weather Service, Understanding Wildfire Warnings, Watches and Behavior“This alert implies a wildfire likely to rage of out of control. If is often hard to predict these fires because such they behave erratically, sometimes dangerously.”
Transcribed exactly as published, typographical errors included, because this is the quote register and correcting an agency’s sentence is editing it.
North Carolina against the other 49 states
Ordered by acres, which measures scale rather than danger: a state near the top may simply be large and remote, and a state near the bottom may have almost no agency reporting its fires. The dagger marks the five states in that second position.
| State | Fires | Acres | Human share | Acres by lightning | NWS fire zones | Pattern |
|---|---|---|---|---|---|---|
| Alaska | 465 | 1,006,158 | 47% | 100% | 120 | Lightning takes at least half the acres |
| California | 8,951 | 505,006 | 86% | 26% | 170 | Lightning is a real but minority source |
| Arizona | 1,626 | 331,638 | 70% | 84% | 29 | Lightning takes at least half the acres |
| Oregon | 2,734 | 324,106 | 52% | 51% | 43 | Lightning takes at least half the acres |
| Oklahoma | 2,530 | 304,120 | 100% | 0% | 82 | Almost every fire starts with a person |
| Colorado | 1,123 | 255,970 | 51% | 82% | 55 | Lightning takes at least half the acres |
| Nevada | 616 | 253,614 | 55% | 87% | 20 | Lightning takes at least half the acres |
| Washington | 1,874 | 247,068 | 80% | 65% | 39 | Lightning takes at least half the acres |
| Florida | 3,704 | 233,645 | 79% | 61% | 132 | Lightning takes at least half the acres |
| Wyoming | 584 | 199,290 | 52% | 86% | 43 | Lightning takes at least half the acres |
| Idaho | 1,498 | 182,005 | 59% | 57% | 20 | Lightning takes at least half the acres |
| New Mexico | 903 | 179,384 | 60% | 80% | 20 | Lightning takes at least half the acres |
| Utah | 1,093 | 159,306 | 66% | 33% | 21 | Lightning is a real but minority source |
| Texas | 5,829 | 146,165 | 97% | 3% | 293 | Almost every fire starts with a person |
| Missouri | 1,671 | 98,737 | 100% | 0% | 115 | Almost every fire starts with a person |
| Nebraska | 511 | 96,682 | 94% | 4% | 69 | Lightning is a real but minority source |
| Montana | 2,432 | 75,830 | 65% | 70% | 32 | Lightning takes at least half the acres |
| Mississippi | 1,812 | 69,724 | 100% | 1% | 82 | Almost every fire starts with a person |
| Virginia | 7,709 | 59,661 | 100% | 0% | 115 | Almost every fire starts with a person |
| South Dakota | 458 | 52,797 | 80% | 2% | 67 | Lightning is a real but minority source |
| Minnesota | 1,381 | 51,416 | 100% | 1% | 98 | Almost every fire starts with a person |
| North Carolina | 6,872 | 42,011 | 100% | 9% | 117 | Almost every fire starts with a person |
| Alabama | 1,860 | 35,258 | 100% | 0% | 71 | Almost every fire starts with a person |
| North Dakota | 430 | 32,471 | 87% | 1% | 54 | Lightning is a real but minority source |
| Georgia | 4,048 | 30,688 | 100% | 0% | 168 | Almost every fire starts with a person |
| New Jersey | 1,323 | 27,328 | 100% | 0% | 30 | Almost every fire starts with a person |
| Iowa | 3,173 | 26,023 | 100% | 0% | 99 | Almost every fire starts with a person |
| Kansas † | 37 | 17,175 | 95% | 6% | 105 | Almost every fire starts with a person |
| West Virginia | 854 | 13,930 | 100% | 0% | 68 | Almost every fire starts with a person |
| Louisiana | 861 | 13,229 | 99% | 19% | 88 | Lightning is a real but minority source |
| Kentucky † | 758 | 12,937 | 100% | 0% | 120 | Almost every fire starts with a person |
| Tennessee | 842 | 12,642 | 98% | 0% | 102 | Almost every fire starts with a person |
| Maryland | 176 | 8,168 | 94% | 0% | 30 | Lightning is a real but minority source |
| Arkansas † | 192 | 6,686 | 97% | 19% | 92 | Lightning is a real but minority source |
| Pennsylvania | 1,546 | 5,509 | 100% | 0% | 78 | Almost every fire starts with a person |
| Hawaii † | 9 | 3,299 | 89% | 0% | 43 | Lightning is a real but minority source |
| Wisconsin | 1,284 | 3,098 | 99% | 1% | 74 | Almost every fire starts with a person |
| Michigan | 516 | 1,295 | 98% | 7% | 91 | Almost every fire starts with a person |
| Illinois | 40 | 1,284 | 100% | 0% | 102 | Almost every fire starts with a person |
| Ohio | 560 | 1,134 | 99% | 0% | 89 | Almost every fire starts with a person |
| Massachusetts | 1,158 | 928 | 99% | 1% | 26 | Almost every fire starts with a person |
| New York | 203 | 841 | 96% | 1% | 14 | Almost every fire starts with a person |
| South Carolina † | 71 | 760 | 100% | 0% | 60 | Almost every fire starts with a person |
| Connecticut | 256 | 548 | 100% | 0% | 13 | Almost every fire starts with a person |
| Maine | 856 | 515 | 100% | 0% | 14 | Almost every fire starts with a person |
| New Hampshire | 157 | 146 | 97% | 1% | 6 | Almost every fire starts with a person |
| Delaware | 15 | 82 | 100% | 0% | 4 | Almost every fire starts with a person |
| Vermont | 106 | 70 | 96% | 1% | 9 | Almost every fire starts with a person |
| Rhode Island | 62 | 66 | 100% | 0% | 8 | Almost every fire starts with a person |
| Indiana | 30 | 38 | 100% | 0% | 95 | Almost every fire starts with a person |
North Carolina fire danger FAQ
Related conditions in North Carolina
Fire danger by state
Fire danger across the country, including what the National Preparedness Level is, why some states report almost no fires, and how much of the country burns on purpose every year.
Live products on this page come from api.weather.gov and are reproduced in the issuing office’s own words. The North Carolina fire record comes from the NICC Wildland Fire Summary and Statistics Annual Report and the National Interagency Fire Center statistics pages, read 2026-09-03. Drought percentages are the US Drought Monitor’s. NICC counts North Carolina in the Southern Area Geographic Area. The North Carolina Forest Service link was checked on 2026-09-02. All figures are the agencies’ own. Check the state authority above for current burn bans and permits before you light anything.
NIFC licensing, verified from DOI’s own notice: “Generally, materials produced by federal agencies are in the public domain and may be reproduced without permission. However, not all materials appearing on this web site are in the public domain. Some materials have been donated or obtained from individuals or organizations and may be subject to restrictions on use.”
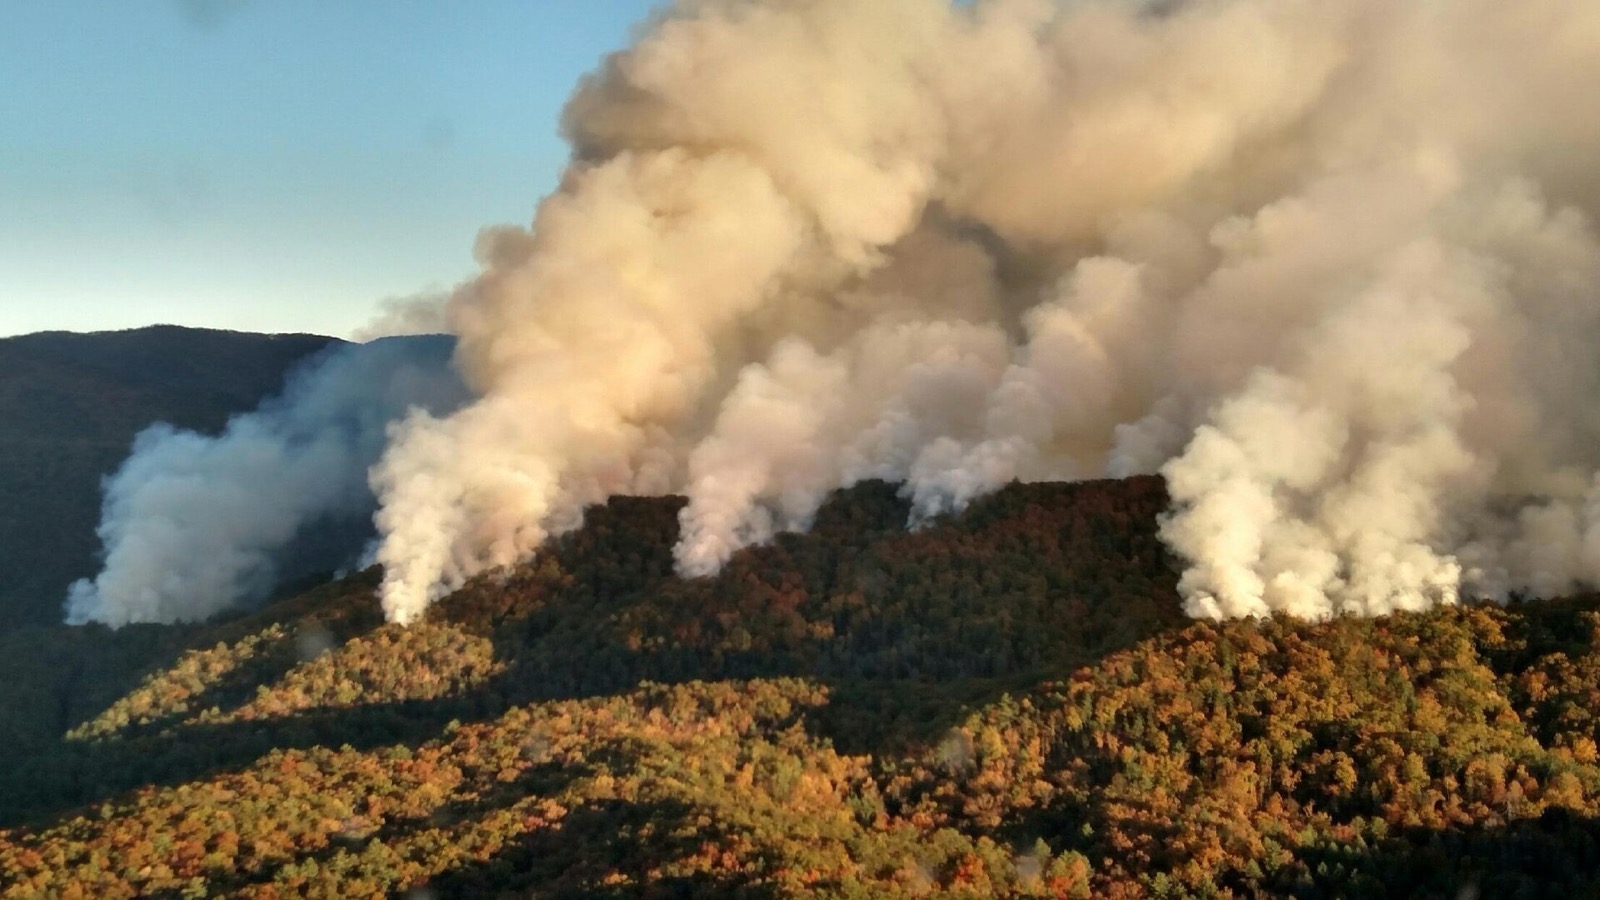
Hero image: “Rough Ridge Fire Smoke Columns” — National Wildfire Coordinating Group — Public domain