
UV Index Forecast: Live, Hourly, and by Month
The NOAA/EPA UV index forecast for 57 American cities, read live in your browser and reproduced as issued, with ten years of agency climatology behind every page.
Reading today's NOAA/EPA UV forecast across the country…Today’s UV index across the country
Every afternoon the NWS Climate Prediction Center issues a UV index forecast for 58 named cities, valid the next day at solar noon, and EPA republishes it through the Envirofacts API. The cards below read that feed live for nine cities chosen to show the spread: on the same summer day, Honolulu and Phoenix can sit in the Extreme category while Anchorage sits at Low. The full list is in the city grid further down.
UV is a curve, not a number
The number a weather app prints is the day’s maximum, forecast for solar noon. The planning question is different: what does 9 AM look like, and when does the afternoon become reasonable again? The chart below is today’s full hourly forecast for Denver, as published. Every city page on this site carries the same curve for its own city.
Reading the NOAA/EPA hourly UV forecast for Denver…
Two practical readings of a curve like this one. First, the morning shoulder is real: a run that ends by mid morning happens at a fraction of the midday index. Second, the afternoon shoulder is longer than people think, and EPA’s protection window of late morning through mid afternoon exists precisely because the top of the curve is flat, not a spike.
Typical UV by month, on NOAA’s own maps
The Climate Prediction Center publishes long-term monthly mean UV index maps for the United States over the base period 2006 to 2024. They are reproduced here as published. Watch two things move through the year: the north to south gradient collapsing in summer, and the mountain West running a category hotter than its latitude, which is altitude at work.
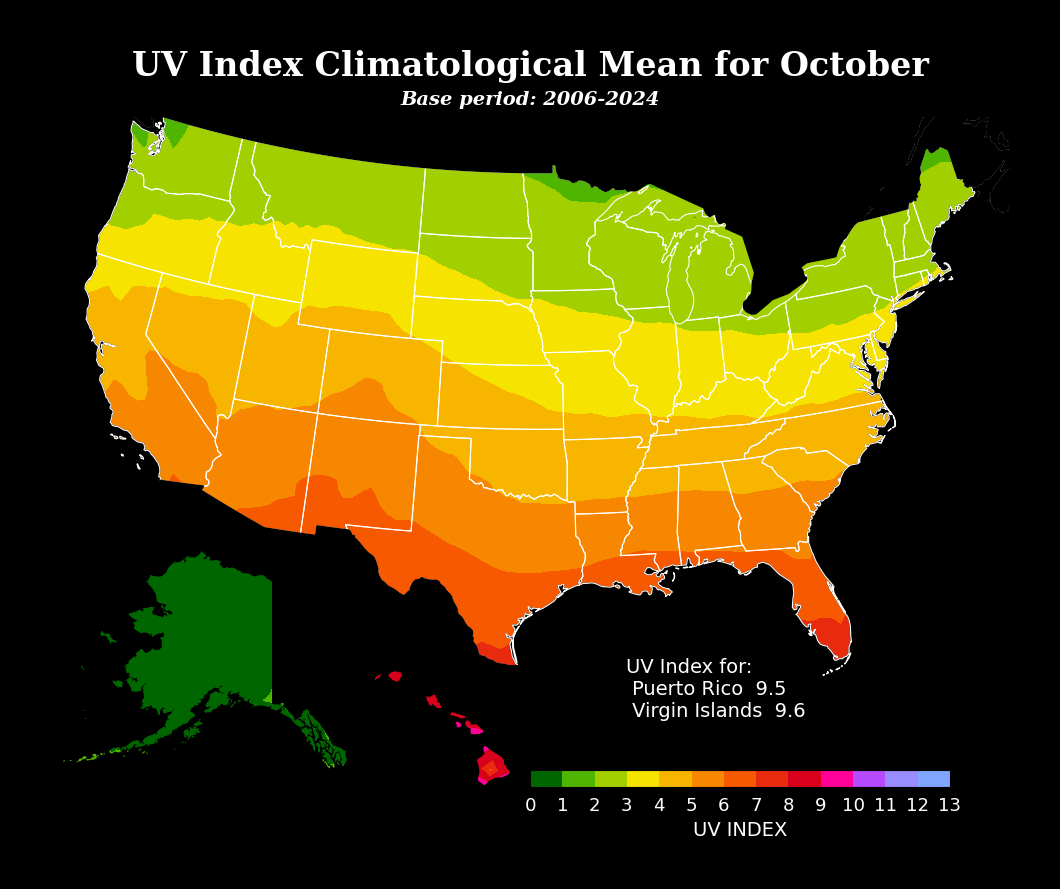
For per-city numbers behind maps like these, every state and city page on this site carries a monthly table computed from ten years of CPC’s archived daily bulletins: typical midday UV, the share of days reaching the High, Very High and Extreme categories, and the highest value on record for each month.
The scale, in the agencies’ words
The UV index used in the United States is the WHO Global Solar UV Index, adopted by EPA and NWS in May 2004. WHO’s one-line summary: “Sun protection is recommended when the ultraviolet index is 3 and above.” EPA’s category messages, verbatim:
“Wear sunglasses on bright days. In winter, reflection off snow can nearly double UV strength. If you burn easily, cover up and use sunscreen.”
“Take precautions, such as covering up and using sunscreen, if you will be outside. Stay in shade near midday when the sun is strongest.”
“Protection against sunburn is needed. Reduce time in the sun between 11 a.m. and 4 p.m. Cover up, wear a hat and sunglasses, and use sunscreen.”
“Take extra precautions. Unprotected skin will be damaged and can burn quickly. Try to avoid the sun between 11 a.m. and 4 p.m. Otherwise, seek shade, cover up, wear a hat and sunglasses, and use sunscreen.”
“Take all precautions. Unprotected skin can burn in minutes. Beachgoers should know that white sand and other bright surfaces reflect UV and will increase UV exposure. Avoid the sun between 11 a.m. and 4 p.m. Seek shade, cover up, wear a hat and sunglasses, and use sunscreen.”
Quoted verbatim from EPA, A Guide to the UV Index (EPA430-F-04-020, May 2004).
EPA’s current condensed guidance
1-2: Low
“No protection needed. You can safely stay outside using minimal sun protection.”
3-7: Moderate to High
“Protection needed. Seek shade during late morning through mid-afternoon. When outside, generously apply broad-spectrum SPF-15 or higher sunscreen on exposed skin, and wear protective clothing, a wide-brimmed hat, and sunglasses.”
8+: Very High to Extreme
“Extra protection needed. Be careful outside, especially during late morning through mid-afternoon. If your shadow is shorter than you, seek shade and wear protective clothing, a wide-brimmed hat, and sunglasses, and generously apply a minimum of SPF-15, broad-spectrum sunscreen on exposed skin.”
Quoted verbatim from EPA, UV Index Scale, epa.gov/sunsafety/uv-index-scale-0 (last updated June 15, 2026).
The categories and the curve, in place of a burn-time table
These pages give you the official categories, the official messages and the hourly curve rather than a “minutes to sunburn by skin type” grid, because EPA considered that practice in its guide to the index and rejected it: “Relating UV Index values to "time to burn" or "safe tanning time" sends an incorrect and potentially harmful message to the general public. The UV Index should not be used to suggest that unprotected exposure is risk-free.” What EPA does say about skin type: “Skin type affects the degree to which some people burn and the time it takes them to burn. The Food and Drug Administration (FDA) classifies skin type on a scale from 1 to 6. Individuals with lower-number skin types (1 and 2) have fair skin and tend to burn rapidly and more severely. Individuals with higher-number skin types (5 and 6), although capable of burning, have darker skin and do not burn as easily.” On the low end of the scale, WHO adds: “UVR in small amounts is essential to good health as it leads to the production of vitamin D in the body.”
What moves the index, quantified by the agencies
Altitude
EPA: “UV increases about 2% for every 1,000-foot increase in elevation due to thinner mountain air.” WHO: “With every 1000 m in altitude, UV levels increase by approximately 10 per cent.” This is why Denver and Albuquerque outrun sea-level cities on their own parallels.
Snow, sand, water
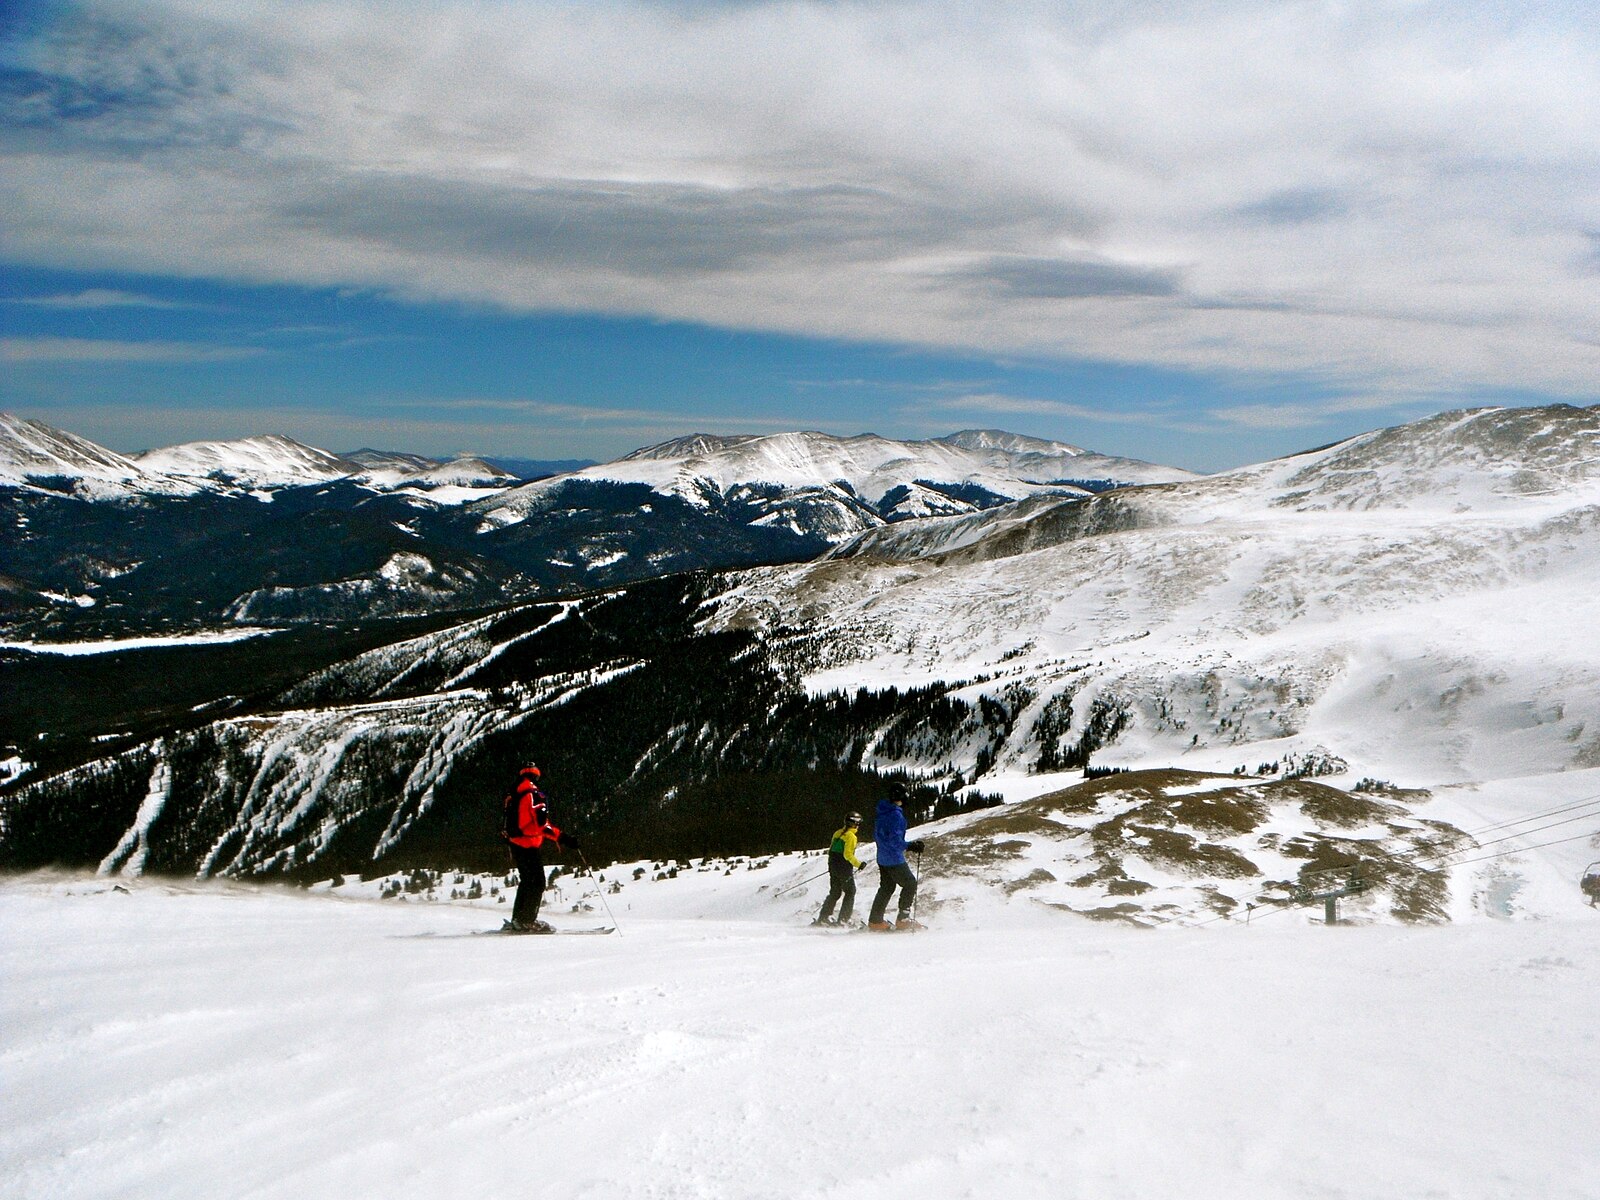
EPA: “Snow may reflect as much as 80% of UV, sand 15%, and water 10%.” WHO: “Fresh snow is a particularly good reflector and almost doubles a person's UV exposure.” A spring ski day is sun from above and below at once.
Cloud
EPA: “Sunburn is possible on a cloudy day. Up to 80% of solar UV radiation can penetrate light cloud cover.” WHO: “UV levels are highest under cloudless skies, and cloud cover generally reduces a person's exposure. However, light or thin clouds have little effect and may even enhance UV levels because of scattering.” Seattle’s overcast-day sunburns are this line in action.
Shade
WHO: “Even a long stay in open shade, for example between buildings, may give a sensitive person a sunburn on a day with high UV levels.” EPA: “UV radiation is generally lower in winter, but snow reflection can double overall exposure - especially at high altitudes - leading to sunburn and snowblindness.”

UV index by state
All 50 states have a page, because all 50 have at least one city in the NOAA bulletin. Each page carries the live forecast for its bulletin city or cities, the hourly curve, and the ten year monthly climatology.
UV index by city
These are the 57 cities NOAA names in its daily bulletin, Washington DC included. Each page leads with the hourly curve for that city.
UV index FAQ
More outdoor planning
Live values on this page and every UV page here are the NOAA/EPA UV index forecast, issued daily by the NWS Climate Prediction Center, read in your browser from EPA Envirofacts and reproduced as published with the forecast date shown. Monthly maps are CPC’s long-term means, 2006 to 2024, reproduced as published. City and state monthly tables are computed from CPC’s archived daily bulletins, 2015 to 2024. Scale categories and protection messages are the WHO Global Solar UV Index as adopted and worded by EPA; quotes are attributed where they appear. NOAA, EPA and WHO are the authorities; we compute averages of their published numbers and nothing else.
Hero image: “White Cumulus Clouds against Blue Sky with Sun Shining” by Vanlewen, CC BY-SA 4.0