
Montana UV Index: Today's Forecast and Climatology
The NOAA/EPA UV index forecast for Billings, read live and reproduced as issued, with a ten year monthly climatology behind it.
Reading today's NOAA/EPA UV forecast for Montana…Montana UV at a glance
NOAA/EPA forecast + CPC climatologyMontana reads moderate from Billings but lives big and high: long midsummer days, treeless alpine miles in Glacier country, and rivers that hold anglers in open sun through the whole midday window.
Today’s UV index in Montana
The values below are the NOAA/EPA UV index forecast, issued each afternoon by the NWS Climate Prediction Center for the following day and republished by EPA. Each number is the forecast maximum for the day, which lands at solar noon, roughly midday on the clock. It is shown here with the forecast date EPA published it under.
Hour by hour in Billings
A single daily number hides the fact that UV is a curve: near zero at breakfast, peaking through the middle of the day, gone by dinner. The hours around solar noon carry most of the dose, which is why EPA’s guidance keeps naming the late morning to mid afternoon window. This is the full hourly forecast, as published.
Reading the NOAA/EPA hourly UV forecast for Billings…
Montana UV climatology, 2015 to 2024
NOAA CPC has issued a daily UV index forecast for Billings for decades and archives every bulletin. The table below aggregates ten years of those published values, which answers the questions a single today number cannot: when the season starts, how deep it runs, and how often the top categories actually show up here.
| Month | Typical midday UV | Days 6+ (High) | Days 8+ (Very High) | Days 11+ (Extreme) | Highest seen |
|---|---|---|---|---|---|
| Jan | 1.2 | 0% | 0% | 0% | 2 |
| Feb | 2 | 0% | 0% | 0% | 4 |
| Mar | 3.3 | 1% | 0% | 0% | 6 |
| Apr | 4.9 | 40% | 3% | 0% | 8 |
| May | 6.4 | 72% | 32% | 0% | 10 |
| Jun | 7.9 | 89% | 68% | 0% | 11 |
| Jul | 8.6 | 96% | 88% | 1% | 11 |
| Aug | 7.1 | 91% | 44% | 0% | 9 |
| Sep | 4.9 | 35% | 0% | 0% | 7 |
| Oct (now) | 2.7 | 0% | 0% | 0% | 5 |
| Nov | 1.4 | 0% | 0% | 0% | 2 |
| Dec | 1 | 0% | 0% | 0% | 2 |
Computed from NOAA Climate Prediction Center daily UV index bulletins for Billings, 2015 to 2024. “Typical midday UV” is the mean of the daily solar noon forecasts; the day-share columns are the percentage of archived days at or above each WHO category threshold; “highest seen” is the highest value CPC published for the city in the period. Simple aggregation of the agency’s numbers, nothing modeled.
What each UV index value means
The scale is the WHO Global Solar UV Index, adopted by EPA and NWS in 2004. The messages below are EPA’s own, word for word. WHO’s summary line for the whole scale: “Sun protection is recommended when the ultraviolet index is 3 and above.”
“Wear sunglasses on bright days. In winter, reflection off snow can nearly double UV strength. If you burn easily, cover up and use sunscreen.”
“Take precautions, such as covering up and using sunscreen, if you will be outside. Stay in shade near midday when the sun is strongest.”
“Protection against sunburn is needed. Reduce time in the sun between 11 a.m. and 4 p.m. Cover up, wear a hat and sunglasses, and use sunscreen.”
“Take extra precautions. Unprotected skin will be damaged and can burn quickly. Try to avoid the sun between 11 a.m. and 4 p.m. Otherwise, seek shade, cover up, wear a hat and sunglasses, and use sunscreen.”
“Take all precautions. Unprotected skin can burn in minutes. Beachgoers should know that white sand and other bright surfaces reflect UV and will increase UV exposure. Avoid the sun between 11 a.m. and 4 p.m. Seek shade, cover up, wear a hat and sunglasses, and use sunscreen.”
Quoted verbatim from EPA, A Guide to the UV Index (EPA430-F-04-020, May 2004).
The categories and EPA’s messages, in place of a burn-time table
This page gives the official categories and EPA’s messages rather than a burn-time countdown by skin type, because EPA addressed that practice directly in its guide to the index: “Relating UV Index values to "time to burn" or "safe tanning time" sends an incorrect and potentially harmful message to the general public. The UV Index should not be used to suggest that unprotected exposure is risk-free.” On skin type itself, the same document says: “Skin type affects the degree to which some people burn and the time it takes them to burn. The Food and Drug Administration (FDA) classifies skin type on a scale from 1 to 6. Individuals with lower-number skin types (1 and 2) have fair skin and tend to burn rapidly and more severely. Individuals with higher-number skin types (5 and 6), although capable of burning, have darker skin and do not burn as easily.”
What moves the UV index in Montana
Latitude and season set the baseline, and three local factors move it from there, each quantified by EPA and WHO rather than by us. Altitude: “UV increases about 2% for every 1,000-foot increase in elevation due to thinner mountain air.” (EPA), and “With every 1000 m in altitude, UV levels increase by approximately 10 per cent.” (WHO). Surfaces: “Snow may reflect as much as 80% of UV, sand 15%, and water 10%.” (EPA). Cloud: “UV levels are highest under cloudless skies, and cloud cover generally reduces a person's exposure. However, light or thin clouds have little effect and may even enhance UV levels because of scattering.” (WHO).
Snow in Montana
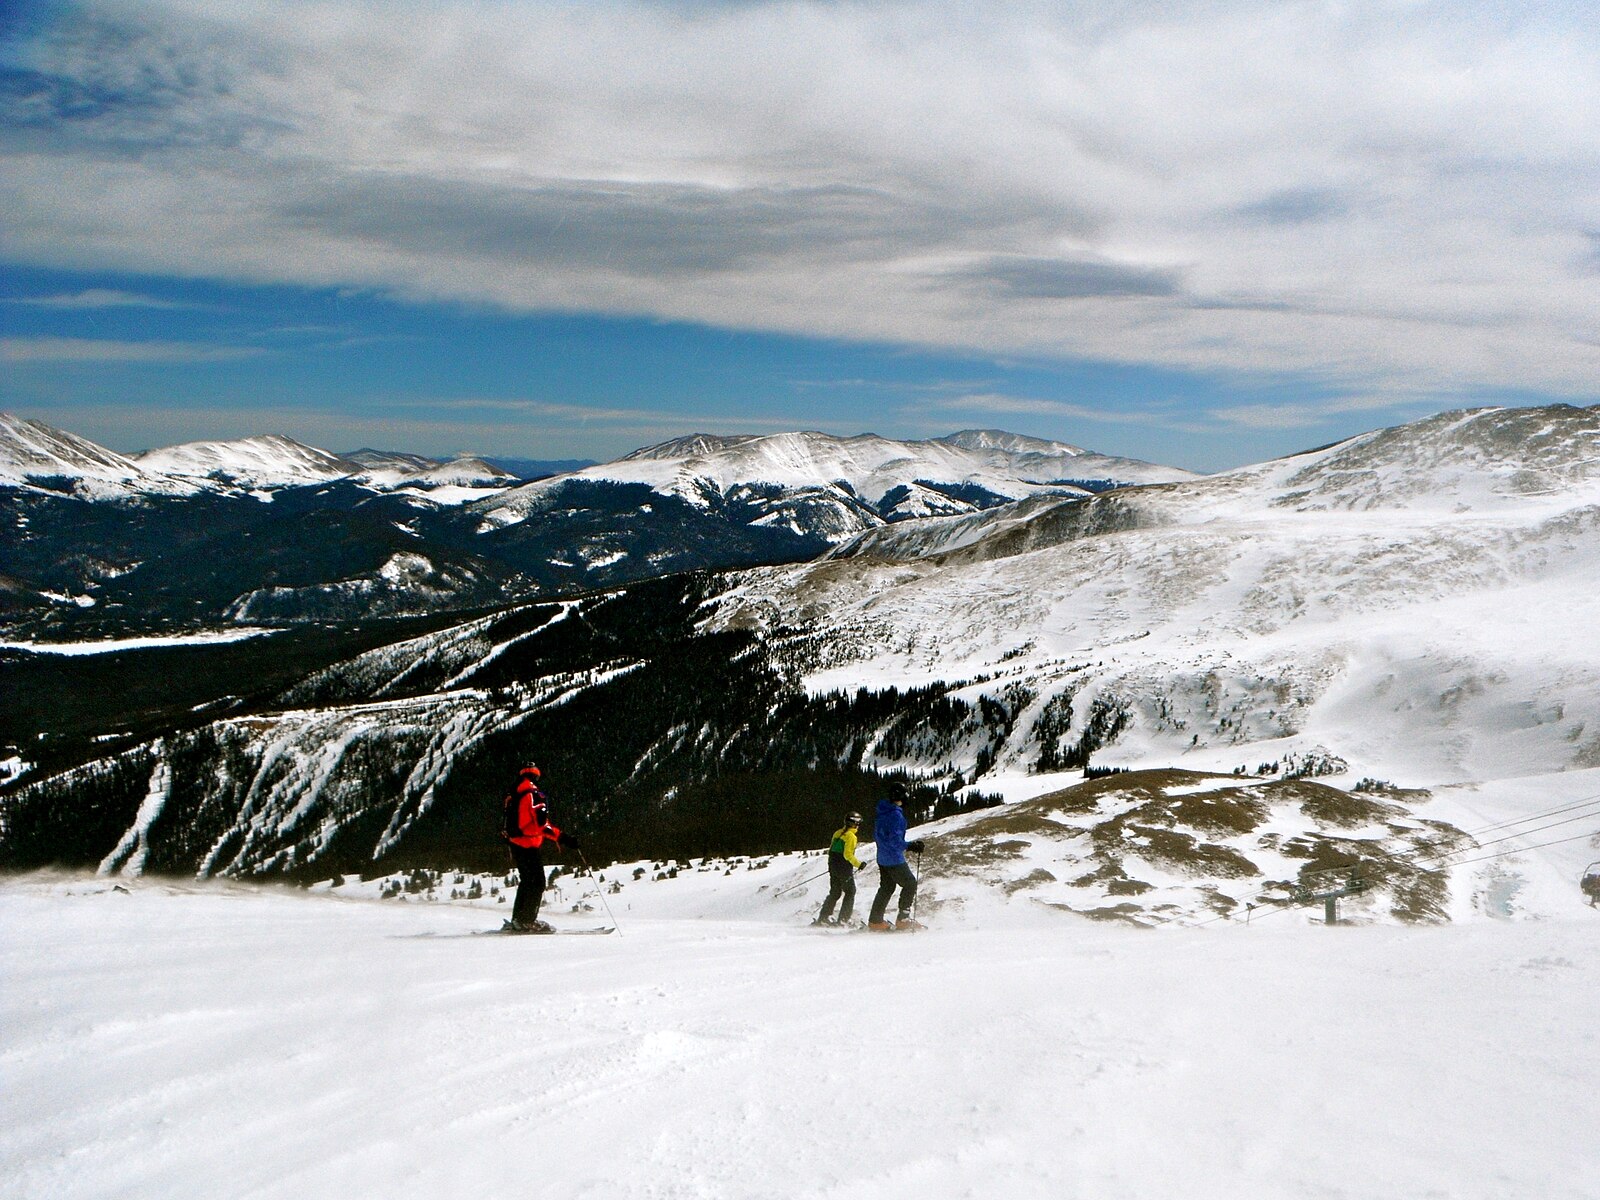
Snow lingers on Montana's high trails into early summer, and a bright June day over old snowfields reflects UV from below as well as above. EPA’s wording: “UV radiation is generally lower in winter, but snow reflection can double overall exposure - especially at high altitudes - leading to sunburn and snowblindness.”
Montana UV index FAQ
More for a Montana day outside
UV index in other states
City pages
Every city in the NOAA bulletin has its own hourly page: Billings. Or start from the national UV index page.
Live values on this page are the NOAA/EPA UV index forecast read from EPA Envirofacts in your browser and reproduced as published, with the forecast date shown. Climatology is computed from NOAA CPC’s archived daily bulletins, 2015 to 2024. Protection guidance is quoted verbatim from EPA and WHO. Category definitions and protection messages belong to the agencies named.
Hero image: “White Cumulus Clouds against Blue Sky with Sun Shining” by Vanlewen, CC BY-SA 4.0