
Hail Season: When and Where Large Hail Falls
Severe hail days a year, the peak week, the hour of the afternoon it arrives and the biggest stones on record, for 46 states. Thirty years of NOAA Storm Prediction Center reports, plus live National Weather Service warnings read the moment you open the page.
Thirty years of NOAA Storm Prediction Center reports, plus live National Weather Service warningsActive severe thunderstorm warnings, with their hail tags
Read live from api.weather.gov when this page loads and shown exactly as the issuing office wrote it. There is no National Weather Service hail product and there never has been: hail is warned inside the Severe Thunderstorm Warning, which carries the office's own maximum hail size tag and a field saying whether the hail was observed or inferred from radar. Roughly a third of severe thunderstorm warnings carry no hail tag at all, because they were issued on wind.
Checking api.weather.gov for active severe thunderstorm products.
The National Weather Service issues no hail specific product. Hail is warned inside the Severe Thunderstorm Warning, and the hail size above is the office's own maxHailSize tag shown exactly as issued, with its hailThreat field saying whether the hail was observed or inferred from radar. Roughly a third of severe thunderstorm warnings carry no hail tag because they were issued on wind. Source: api.weather.gov
How much severe hail each state gets, and when
Sorted by severe hail days a year, which is the fastest way to see that this is not one national story but at least three. Every figure counts reports of 1 inch or larger over 1996 to 2025, and every figure counts DAYS: a day on which forty people called in the same storm counts once. Read the leaders with one caveat in mind, though. A state day count records a day when severe hail fell anywhere inside the state, so a large state accumulates more days than a small one for reasons that have nothing to do with the weather. NOAA, counting hail storms at a point rather than by state, names a different three.
| State | Severe hail days a year | Days a year at 2 in or more | Season, middle 80 percent | Busiest month | Largest stone since 1996 | Page shape |
|---|---|---|---|---|---|---|
| Texas | 85 | 34 | Mar 18 to Sep 28 | May | 7.02 in | Frequent |
| Kansas | 64 | 21 | Apr 15 to Sep 9 | Jun | 7.75 in | Frequent |
| Nebraska | 61 | 19 | May 1 to Sep 2 | Jun | 7 in | Frequent |
| Oklahoma | 50 | 16 | Mar 25 to Sep 17 | May | 6 in | Frequent |
| South Dakota | 48 | 14 | May 20 to Aug 26 | Jul | 8 in | Frequent |
| Colorado | 45 | 12 | May 16 to Aug 25 | Jun | 5.25 in | Frequent |
| Missouri | 42 | 9.7 | Mar 25 to Sep 15 | May | 6 in | Frequent |
| Minnesota | 34 | 9.2 | May 16 to Sep 5 | Jul | 6 in | Frequent |
| Iowa | 33 | 8.3 | Apr 14 to Sep 6 | Jun | 5.5 in | Frequent |
| Arkansas | 32 | 5.6 | Mar 7 to Sep 27 | May | 5 in | Frequent |
| North Dakota | 32 | 8.2 | May 29 to Aug 28 | Jul | 5 in | Frequent |
| Illinois | 31 | 6.3 | Mar 30 to Sep 1 | May | 4.75 in | Frequent |
| North Carolina | 30 | 3.3 | Apr 9 to Aug 20 | Jun | 4.5 in | Seasonal |
| Georgia | 30 | 3.2 | Mar 20 to Aug 19 | Jun | 4.25 in | Seasonal |
| Montana | 29 | 6.3 | May 28 to Aug 17 | Jul | 4.5 in | Seasonal |
| Mississippi | 28 | 4.2 | Feb 23 to Sep 4 | Apr | 4.88 in | Seasonal |
| Wyoming | 28 | 5.1 | May 22 to Aug 17 | Jun | 4.5 in | Seasonal |
| Florida | 27 | 2.3 | Mar 17 to Aug 5 | May | 4.5 in | Seasonal |
| New Mexico | 27 | 5.2 | May 6 to Sep 20 | Jun | 4.5 in | Seasonal |
| Alabama | 24 | 3.9 | Mar 9 to Aug 24 | May | 5.38 in | Seasonal |
| Tennessee | 24 | 2.9 | Mar 15 to Aug 25 | May | 4.5 in | Seasonal |
| Virginia | 23 | 2.6 | Apr 14 to Aug 19 | May | 4.75 in | Seasonal |
| South Carolina | 23 | 2.1 | Apr 7 to Aug 18 | Jun | 4.5 in | Seasonal |
| Wisconsin | 23 | 4.9 | Apr 28 to Sep 7 | Jul | 5.5 in | Seasonal |
| Ohio | 21 | 3.1 | Apr 9 to Aug 25 | Jun | 5 in | Seasonal |
| Kentucky | 20 | 3.7 | Mar 18 to Aug 10 | May | 4.5 in | Seasonal |
| Louisiana | 20 | 3.2 | Feb 23 to Aug 27 | May | 4.5 in | Seasonal |
| Indiana | 20 | 3.3 | Mar 30 to Aug 24 | May | 4.5 in | Seasonal |
| Michigan | 19 | 3.2 | Apr 24 to Sep 1 | Jun | 4.5 in | Seasonal |
| Pennsylvania | 19 | 1.7 | Apr 26 to Aug 24 | Jun | 4 in | Seasonal |
| New York | 16 | 1.9 | May 16 to Aug 25 | Jul | 4 in | Seasonal |
| West Virginia | 13 | 1.4 | Apr 7 to Aug 27 | May | 4.25 in | Seasonal |
| Arizona | 11 | 0.6 | Jul 4 to Oct 6 | Jul | 3 in | Seasonal |
| Maryland | 9.4 | 1 | Apr 21 to Aug 17 | Jun | 4.5 in | Occasional |
| Idaho | 8 | 0.4 | May 17 to Aug 30 | Jun | 2.75 in | Occasional |
| California | 6.4 | 0.2 | Mar 10 to Oct 4 | Jul | 3 in | Occasional |
| Maine | 6.2 | 0.5 | Jun 1 to Aug 20 | Jul | 2.75 in | Occasional |
| Massachusetts | 6.2 | 0.7 | May 24 to Aug 19 | Jul | 4 in | Occasional |
| Oregon | 6 | 0.4 | May 6 to Aug 18 | Aug | 2.5 in | Occasional |
| New Hampshire | 5.8 | 0.4 | May 30 to Aug 22 | Jul | 3 in | Occasional |
| New Jersey | 5.8 | 0.2 | Apr 21 to Aug 25 | Jul | 2.75 in | Occasional |
| Utah | 4.9 | 0.2 | Jun 5 to Sep 16 | Aug | 2 in | Occasional |
| Vermont | 4.3 | 0.3 | May 21 to Aug 17 | Jul | 3.3 in | Occasional |
| Connecticut | 3.5 | 0.1 | May 24 to Aug 23 | Jun | 2.5 in | Occasional |
| Washington | 3.2 | 0.2 | May 13 to Aug 22 | Jun | 3 in | Occasional |
| Nevada | 2.7 | 0.1 | May 17 to Sep 11 | Jul | 2.75 in | Occasional |
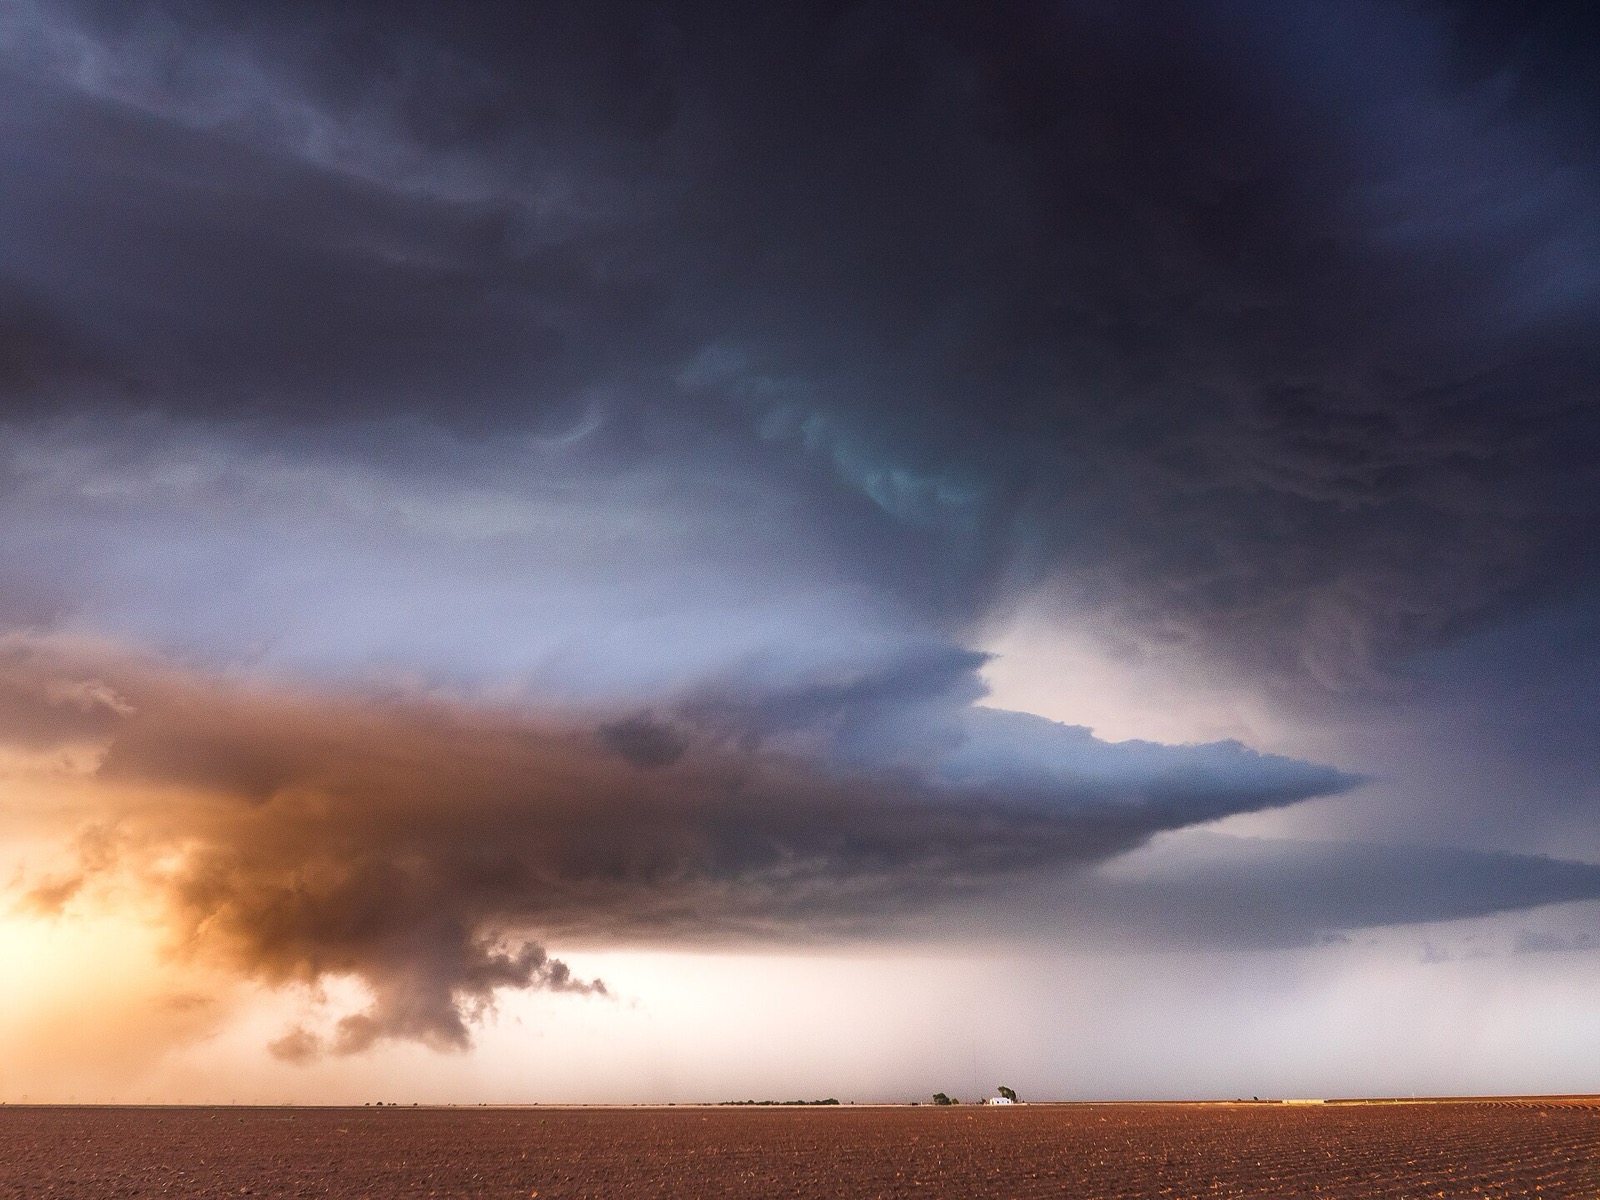
NOAA JetStream, Hazard: Hail“While Florida has the most thunderstorms, New Mexico, Colorado, and Wyoming usually have the most hail storms. Why? The freezing level in the Florida thunderstorms is so high, the hail often melts before reaching the ground.”
Why the last column exists. A severe hail day means something completely different in Texas than in Vermont, so the state pages do not all lead with the same number. Which shape a state gets is decided by its own data.
Frequent
states with 30 or more severe hail days a year AND 5 or more days a year carrying stones of 2 inches or larger. Hail is a feature of the warm season here, so those pages lead with frequency and the peak week rather than with a start date.
Seasonal
states above 10 severe hail days a year that do not clear both frequent bars. Severe hail happens every year on enough days for the season to have a real shape, so those pages lead with the window and the peak month.
Occasional
states under 10 severe hail days a year. At that frequency the busiest week of the calendar holds well under one day a year, so those pages publish no peak week at all and lead with how seldom it happens and how big the stones got.
Hail season sweeps north and west across the year
There is no national hail season, there is a wave. The Gulf states open in late February while the jet stream is still strong and Gulf moisture is already deep. The southern Plains peak in May on the dryline. The corn belt follows in June. The Dakotas, Minnesota, Wisconsin and the northern Rockies peak in July. And then there is Arizona, whose season does not open until July at all, because its hail comes from the North American monsoon rather than from the spring storm track.
Nationally the effect is a plateau rather than a spike: from April to August there is severe hail somewhere in the United States on almost every single day. In July, across the 30 years in this window, 917 of a possible 930 days carried a severe hail report somewhere in the country, which is 99 percent of them.
| Busiest month | States | How many |
|---|---|---|
| April | Mississippi | 1 |
| May | Alabama, Arkansas, Florida, Illinois, Indiana, Kentucky, Louisiana, Missouri, Oklahoma, Tennessee, Texas, Virginia, West Virginia | 13 |
| June | Colorado, Connecticut, Georgia, Idaho, Iowa, Kansas, Maryland, Michigan, Nebraska, New Mexico, North Carolina, Ohio, Pennsylvania, South Carolina, Washington, Wyoming | 16 |
| July | Arizona, California, Maine, Massachusetts, Minnesota, Montana, Nevada, New Hampshire, New Jersey, New York, North Dakota, South Dakota, Vermont, Wisconsin | 14 |
| August | Oregon, Utah | 2 |
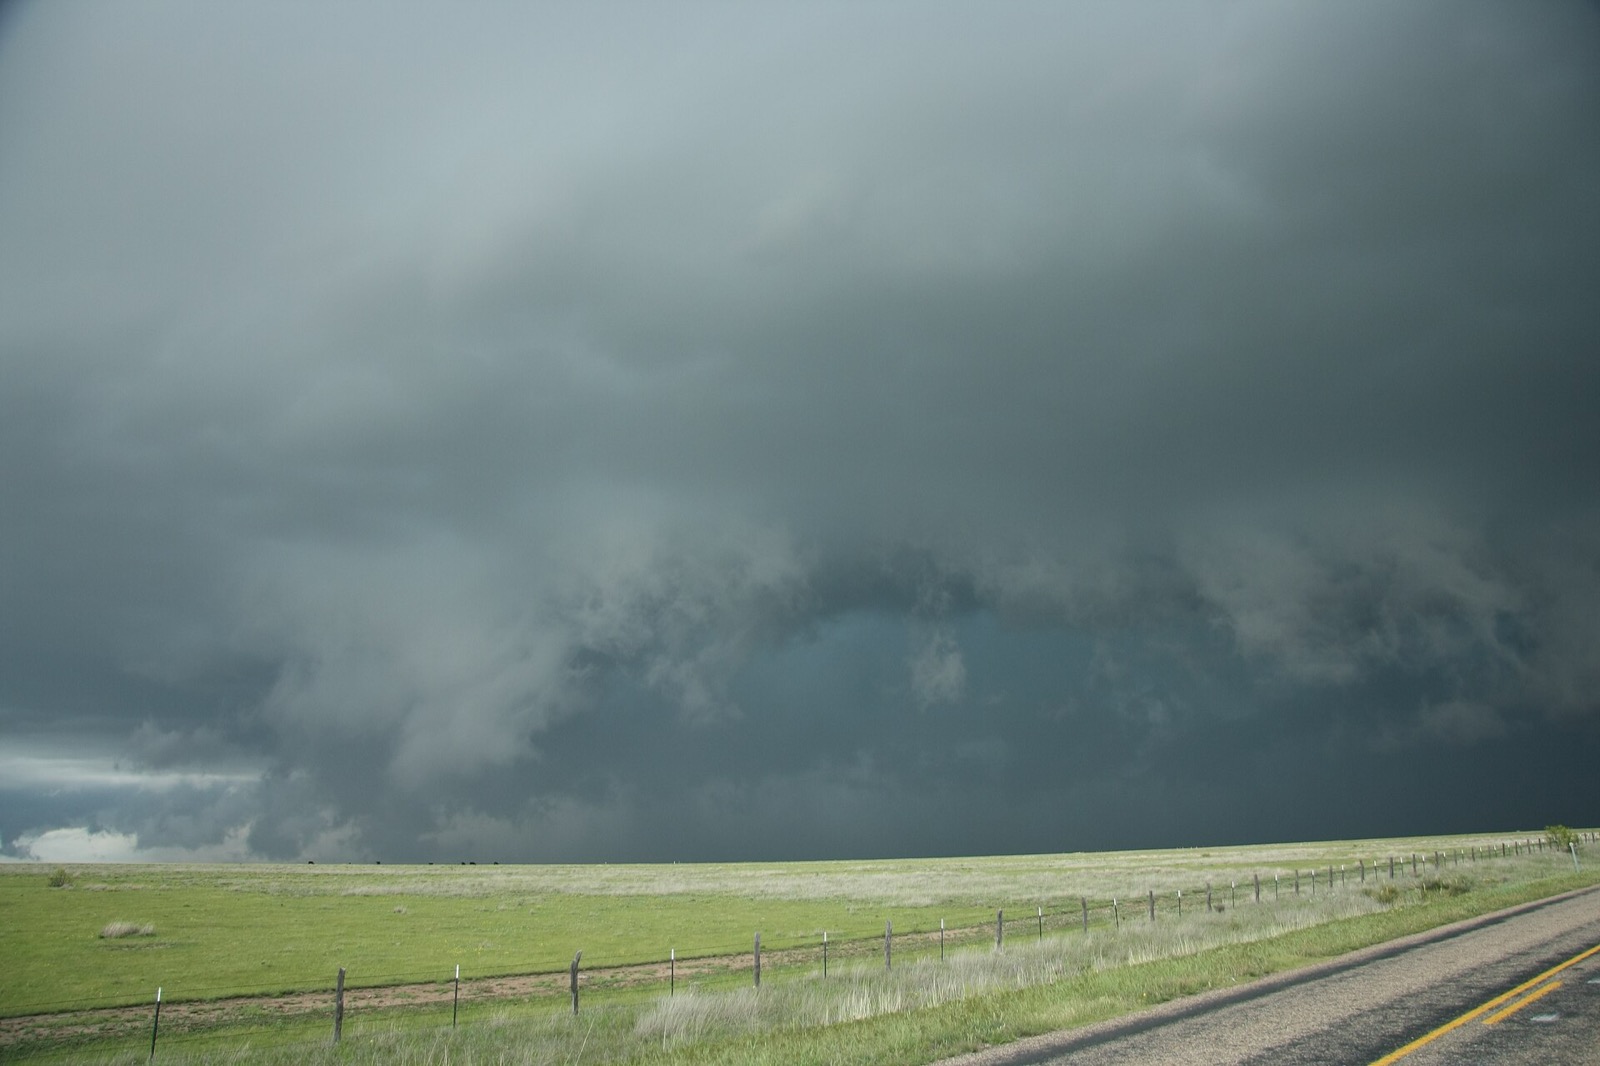
NOAA JetStream, Hazard: Hail“However, the sustained updraft in supercell thunderstorms support large hail formation by repeatedly lifting the hailstones into the very cold air at the top of the thunderstorm cloud.”
Why this site counts hail days and not hail reports
This is the single most important chart on the site, and it is the reason every headline number on these pages is a day count. Between 1996 and 2025, severe hail REPORTS in the United States rose from 4,811 to a peak of 12,451 in 2011, and then fell back. Over the same years, the number of DAYS carrying at least one such report went from 216 to 231. The weather did not double and halve. The number of people watching it changed.
The Storm Prediction Center is unusually candid about the limits of its own database, and the two sentences below are the ones every hail article on the internet should quote and almost none do.
NOAA Storm Prediction Center, Severe Weather Maps, Graphics, and Data Page“Even through the data are smoothed, severe weather reports cluster around population centers.”
NOAA Storm Prediction Center, Severe Weather Maps, Graphics, and Data Page“These are locations where more severe weather is reported because more people live in those areas.”
NOAA Storm Prediction Center, Severe Weather Maps, Graphics, and Data Page“It should also be noted that these data are used by the NWS for verification purposes and may not accurately reflect all storm events.”
Counting days removes most of the reporting inflation but not all of the bias. A day still requires somebody to have been there and picked up the phone, so thinly populated states with violent storms, Montana and Wyoming among them, record fewer hail days than their weather warrants, while metropolitan corridors record more. No correction is applied, because any correction would be a model wearing the clothes of data. Every count on this site is a count of REPORTED severe hail.
Our summary of information published by NOAA SPC Severe Weather Database
Hail size, and the updraft each size implies
A hailstone is a direct readout of the storm that made it. To hold a stone up long enough to grow, an updraft has to be able to carry its weight, and NOAA publishes the pairing. This is the most useful table anyone has written about hail, because it turns a number of inches into a fact about the sky: a baseball on the lawn means an 80 mph column of rising air was overhead.
| Object | Diameter | Updraft needed | Counts as |
|---|---|---|---|
| Pea | 1/4 in | 24 mph | Below severe |
| Marble | 1/2 in | 35 mph | Below severe |
| Dime | 7/10 in | 38 mph | Below severe |
| Penny | 3/4 in | 40 mph | Below severe |
| Nickel | 7/8 in | 46 mph | Below severe |
| Quarter | 1 in | 49 mph | Severe |
| Half dollar | 1 1/4 in | 54 mph | Severe |
| Walnut | 1 1/2 in | 60 mph | Severe |
| Golf ball | 1 3/4 in | 64 mph | Severe |
| Hen egg | 2 in | 69 mph | Significant severe |
| Tennis ball | 2 1/2 in | 77 mph | Significant severe |
| Baseball | 2 3/4 in | 81 mph | Significant severe |
| Tea cup | 3 in | 84 mph | Significant severe |
| Grapefruit | 4 in | 98 mph | Significant severe |
| Softball | 4 1/2 in | 103 mph | Significant severe |
The largest US stone in this window, South Dakota: 8 inches, larger than the softball that is the largest rung NOAA publishes. NOAA quotes no updraft speed above 4 1/2 in, so none is quoted here for a stone that size.
The largest stone anywhere in this 30 year window is the 8 inch stone that fell in Lyman County, South Dakota on 2010-07-23, which is also the recognised United States record. It is larger than a softball, off the top of NOAA's own ladder.
NOAA Storm Prediction Center, SPC Products“The NWS defines a severe thunderstorm as any storm that produces one or more of the following elements: A tornado. Damaging winds or speeds of 58 mph (50 knots) or greater. Hail 1 inch in diameter or larger.”
NOAA Storm Prediction Center, SPC Products“The SPC further defines significant severe thunderstorms as any storm that produce one or more of the following elements: A tornado that produces EF2 or greater damage. Wind speeds of 75 mph (65 knots) or greater. Hail 2 inch in diameter or larger.”
Those two thresholds, 1 inch and 2 inches, are the only lines this site counts against, because they are the lines the reports were collected under. The 1 inch bar is also newer than most people realise: it replaced a three quarter inch bar in 2010, which is why nothing on this site compares a modern count with a pre 2010 one.
NOAA Storm Prediction Center, Severe Weather Maps, Graphics, and Data Page“The NWS changed criteria for severe hail from 0.75 inch minimum to 1.00 inch minimum in 2010. For legacy purposes, 0.75 inch hail reports will continue to be included in the annual hail csv files.”

Forty six states with a hail season
A state has a page here when severe hail was reported in at least 25 of the 30 years, so the page is describing an annual event rather than an occasional one, AND when it recorded at least 60 severe hail days in the window, which is two a year and the floor at which a monthly distribution is shape rather than noise. Four states fall below that line, and here are their real numbers.
| State | Severe hail days, 30 years | Years in 30 with any | What the record shows |
|---|---|---|---|
| Delaware | 45 | 20 | Severe hail in only 20 of the 30 years, so it is an occasional event here rather than an annual one. |
| Rhode Island | 34 | 20 | Severe hail in only 20 of the 30 years, so it is an occasional event here rather than an annual one. |
| Alaska | 9 | 6 | Severe hail in only 6 of the 30 years, so it is an occasional event here rather than an annual one. |
| Hawaii | 6 | 4 | Severe hail in only 4 of the 30 years, so it is an occasional event here rather than an annual one. |
Washington and Nevada sit just above the line and do have pages, with about three severe hail days a year each. Their pages say so in the first sentence.
Two registers, kept apart
Quoted from the agencies: the definitions of severe and significant severe hail, the record of the 2010 criterion change, the limitations of the storm report database, the hail size ladder and its updraft speeds, and all safety text. Every one is a US Government work in the public domain, printed verbatim with the source named and linked.
Counted from the SPC database: every number on this site. Day counts, monthly and hourly distributions, season percentiles, significant hail counts and the largest stones are all arithmetic over the NOAA Storm Prediction Center Severe Weather Database hail file, restricted to the 1996 to 2025 window and to reports of 1.00 inch or larger, and committed as a dated snapshot. 205,939 reports out of 414,481 rows in the file.
Passed through verbatim: National Weather Service Severe Thunderstorm Warnings and Watches, with the issuing office, the areas named, the hail size tag and the times, exactly as issued. Not on these pages: a hail risk score, a forecast, a trend line, or the database's monetary loss columns, which SPC itself says to leave alone.
Sources: NOAA SPC Severe Weather Database, NOAA JetStream, Hazard: Hail, NWS api.weather.gov active alerts, US Census Bureau 2020 county codes. All are US Government works and in the public domain. SPC last updated the database on 24 April 2026; this snapshot was built on 2026-08-28.
Hail season FAQ
Hail season, state by state
The same storm year, other hazards
Counts are ours, from the NOAA Storm Prediction Center Severe Weather Database, restricted to reports of 1.00 inch or larger over 1996 to 2025. Hail size and updraft figures are quoted from NOAA JetStream. Live products come from the National Weather Service and are shown verbatim. For what is going to happen, see the SPC Convective Outlooks and NWS Severe Thunderstorm Safety.