
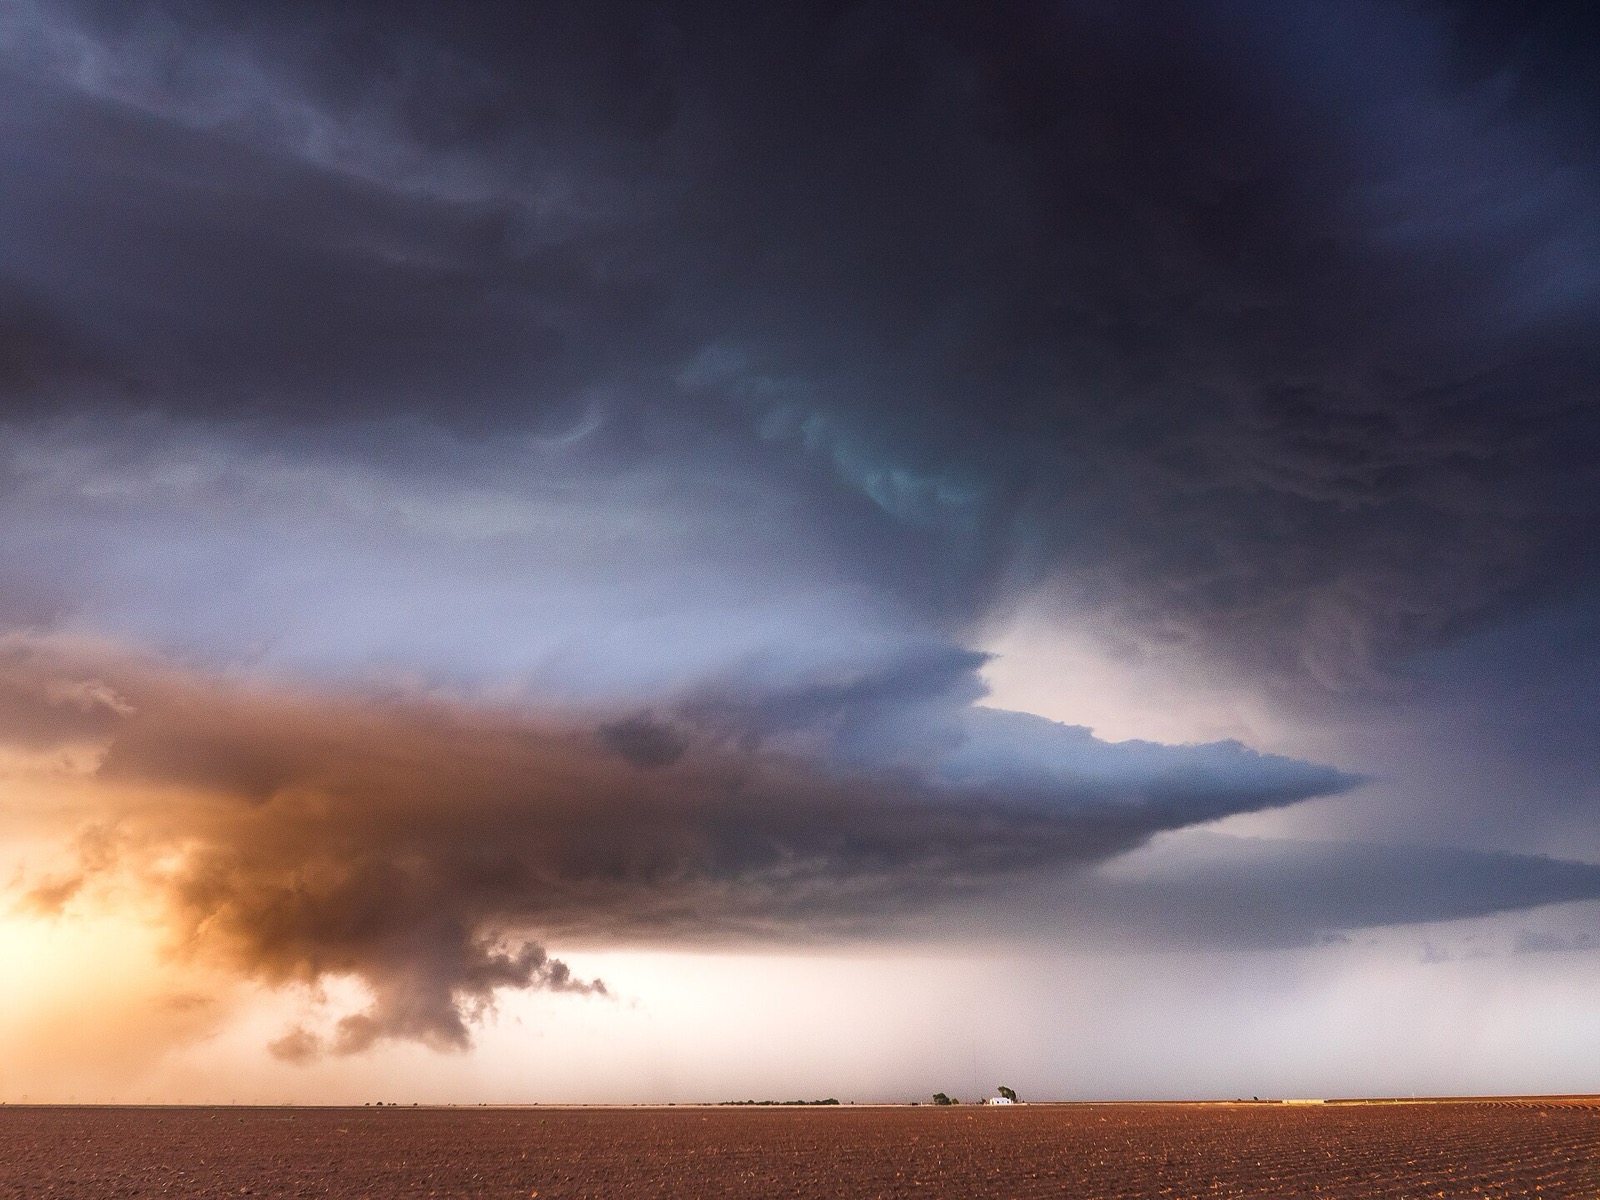
Hail Season in Pennsylvania
Severe hail reaches Pennsylvania every year, on 19 days in an average one. Here is when in the year they fall, what hour of the day they arrive, how big the stones have got, and any live National Weather Service warning.
Typical Pennsylvania hail season: April 26 to August 24, busiest in JunePennsylvania's severe hail season
1996-2025, stones of 1 inch or largerPennsylvania averages about 18 severe hail days a year with a June peak and a very strong afternoon signal. The western counties, closer to the Ohio Valley track, carry more of it than the southeast, and 2 inch stones show up on fewer than two days a year statewide.
When severe hail falls in Pennsylvania
Every bar counts DAYS, not reports. A day on which forty people called in the same storm counts once, exactly like a day on which one farmer called in one stone, because the number of calls is mostly a measure of how many people were outside with a phone. Across the 30 years from 1996 to 2025, Pennsylvania recorded 556 days with a severe hail report and 2465 individual reports, an average of 4.4 reports per hail day. The months carrying at least a twelfth of the year's hail days are May, June, July, August.
| Month | Severe hail days, 30 years | Days a year | Share of the year's hail |
|---|---|---|---|
| January | 4 | 0.1 | 0.7% |
| February | 3 | 0.1 | 0.5% |
| March | 11 | 0.4 | 2% |
| April | 44 | 1.5 | 7.9% |
| May | 112 | 3.7 | 20.1% |
| June | 128 | 4.3 | 23% |
| July | 127 | 4.2 | 22.8% |
| August | 83 | 2.8 | 14.9% |
| September | 29 | 1 | 5.2% |
| October | 9 | 0.3 | 1.6% |
| November | 5 | 0.2 | 0.9% |
| December | 1 | 0 | 0.2% |
Severe hail days a year
Ranked 30 of the 46 states with a page here. Counted from NOAA Storm Prediction Center reports of 1 inch or larger.
Our count of NOAA reportsDays with 2 inch hail
a year, on 51 days in 30 years. Two inches is the Storm Prediction Center's own significant severe threshold, not a line of ours.
SPC thresholdYears with any severe hail
Every year in the window carried at least one severe hail day in Pennsylvania.
Our count of NOAA reportsBusiest single day
severe hail reports across Pennsylvania on 2019-05-28, the most of any day in the window. One day, one storm system, and a great many people picking up the phone.
Our count of NOAA reports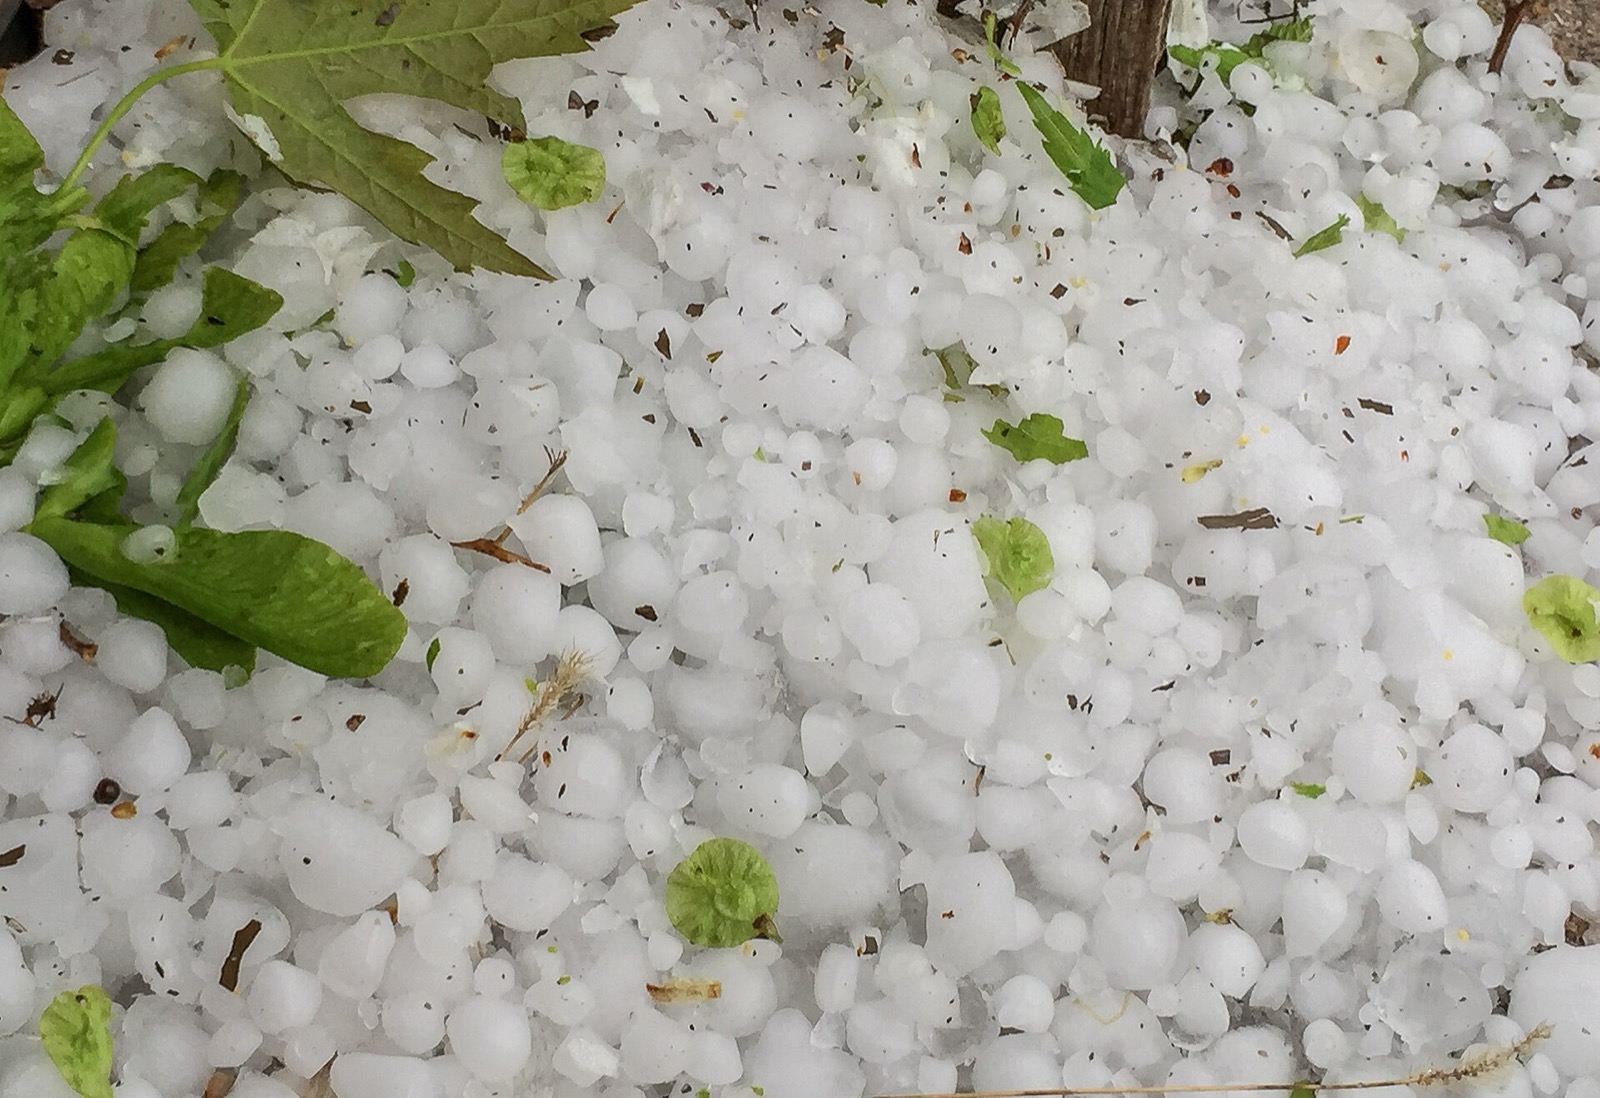
The biggest Pennsylvania hailstones since 1996
Hail size is the whole story, because the damage rises far faster than the diameter does. These are the largest reports in the 1996 to 2025 window, which is not the same thing as the Pennsylvania state record: the older part of the Storm Prediction Center database contains magnitudes that cannot be right, so the 30 year window is the reliable record.
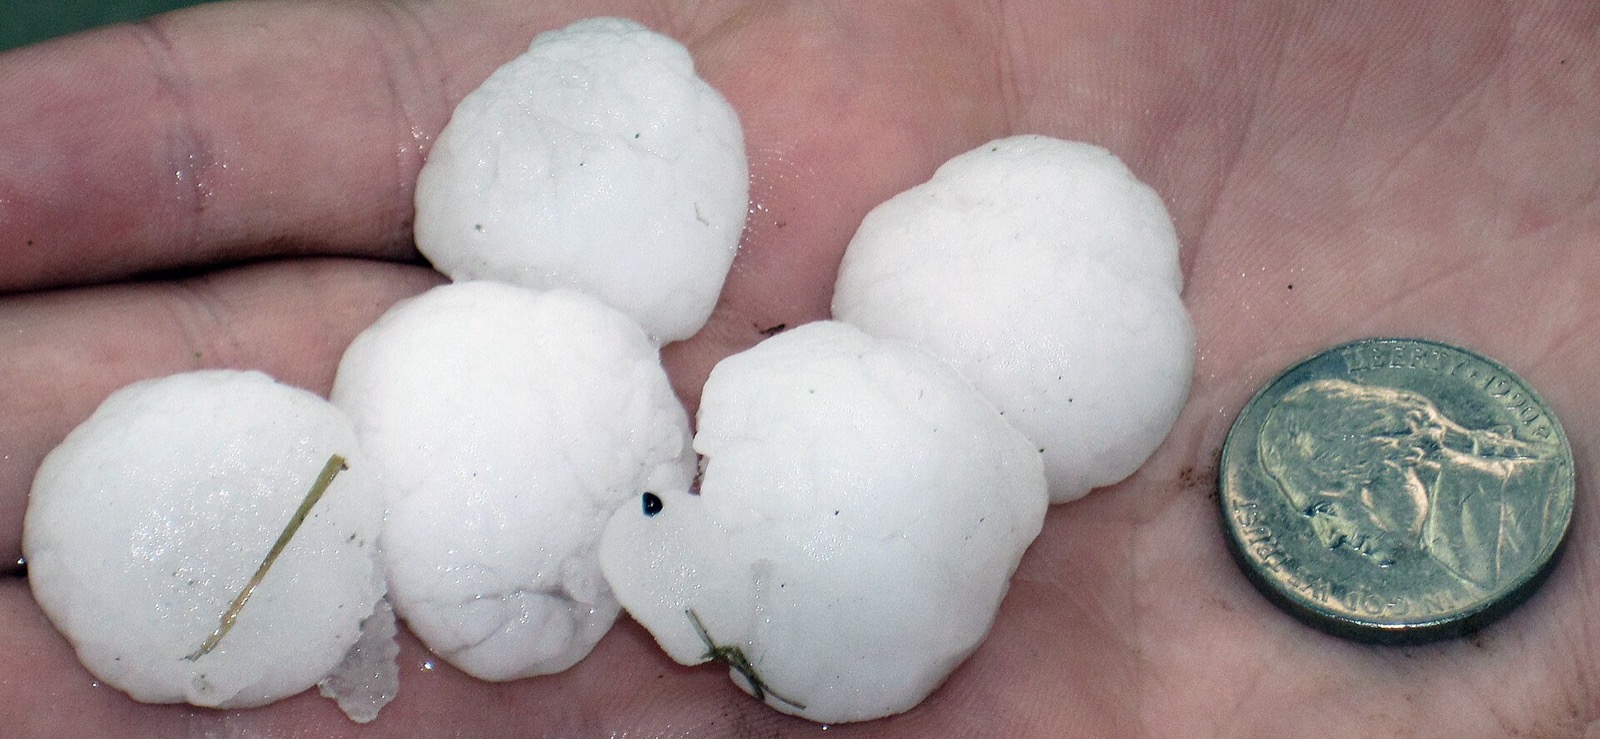
NOAA publishes a table pairing each hail size with the approximate updraft speed needed to hold a stone that size aloft, and it is the most useful thing anyone has written about hail size, because it turns a number of inches into a fact about the storm. Here is the whole ladder, with Pennsylvania's largest stone marked.
| Object | Diameter | Updraft needed | Counts as |
|---|---|---|---|
| Pea | 1/4 in | 24 mph | Below severe |
| Marble | 1/2 in | 35 mph | Below severe |
| Dime | 7/10 in | 38 mph | Below severe |
| Penny | 3/4 in | 40 mph | Below severe |
| Nickel | 7/8 in | 46 mph | Below severe |
| Quarter | 1 in | 49 mph | Severe |
| Half dollar | 1 1/4 in | 54 mph | Severe |
| Walnut | 1 1/2 in | 60 mph | Severe |
| Golf ball | 1 3/4 in | 64 mph | Severe |
| Hen egg | 2 in | 69 mph | Significant severe |
| Tennis ball | 2 1/2 in | 77 mph | Significant severe |
| Baseball | 2 3/4 in | 81 mph | Significant severe |
| Tea cup | 3 in | 84 mph | Significant severe |
| GrapefruitPennsylvania's largest stone | 4 in | 98 mph | Significant severe |
| Softball | 4 1/2 in | 103 mph | Significant severe |
NOAA JetStream, Hazard: Hail“When the hailstone can no longer be supported by the updraft, it falls to the Earth. The stronger the updraft, the larger the hailstones that can be produced by the thunderstorm.”
Severe hail in Pennsylvania is an afternoon event
about 9 in every 10 Pennsylvania severe hail reports arrive between noon and 9 pm local standard time, and the single busiest hour is the one beginning at 4 pm. This is not a coincidence and it is not a local quirk: the sun heats the ground, the ground heats the air above it, and the updraft that can carry a stone high enough to grow is strongest in the afternoon and early evening. It is also the most actionable number on this page, because it is the one that tells you when to bring the car in.
The Storm Prediction Center stores every report in its database with a Central Standard Time stamp, on every row, for every state. Plotting those raw hours would put Arizona's afternoon in the wrong place and Maine's in a different wrong place. So we convert each report to its own approximate local standard time using its own longitude, at one hour per fifteen degrees. That is local mean solar time rounded to the hour, it handles states that straddle a time zone boundary, and it is our arithmetic rather than SPC's. Daylight saving is not applied, so a summer afternoon on the clock outside is an hour later than the hour shown here.
Our summary of information published by NOAA SPC Severe Weather Database
NOAA JetStream, Hazard: Hail“Hail is precipitation that is formed when updrafts in thunderstorms carry raindrops upward into extremely cold areas of the atmosphere. Hail can damage aircraft, homes and cars, and can be deadly to livestock and people.”
What the National Weather Service has out in Pennsylvania
Everything below is read live from api.weather.gov when this page loads and shown exactly as the issuing forecast office wrote it. There is no NWS hail product: hail is warned inside the Severe Thunderstorm Warning, and each warning carries the office's own maximum hail size tag.
Checking api.weather.gov for active severe thunderstorm products.
The National Weather Service issues no hail specific product. Hail is warned inside the Severe Thunderstorm Warning, and the hail size above is the office's own maxHailSize tag shown exactly as issued, with its hailThreat field saying whether the hail was observed or inferred from radar. Roughly a third of severe thunderstorm warnings carry no hail tag because they were issued on wind. Source: api.weather.gov
Severe thunderstorms, in the agency's own words
Severe thunderstorm safety guidance is the National Weather Service's. Here it is verbatim, starting with the definition that every number on this page is counted against.
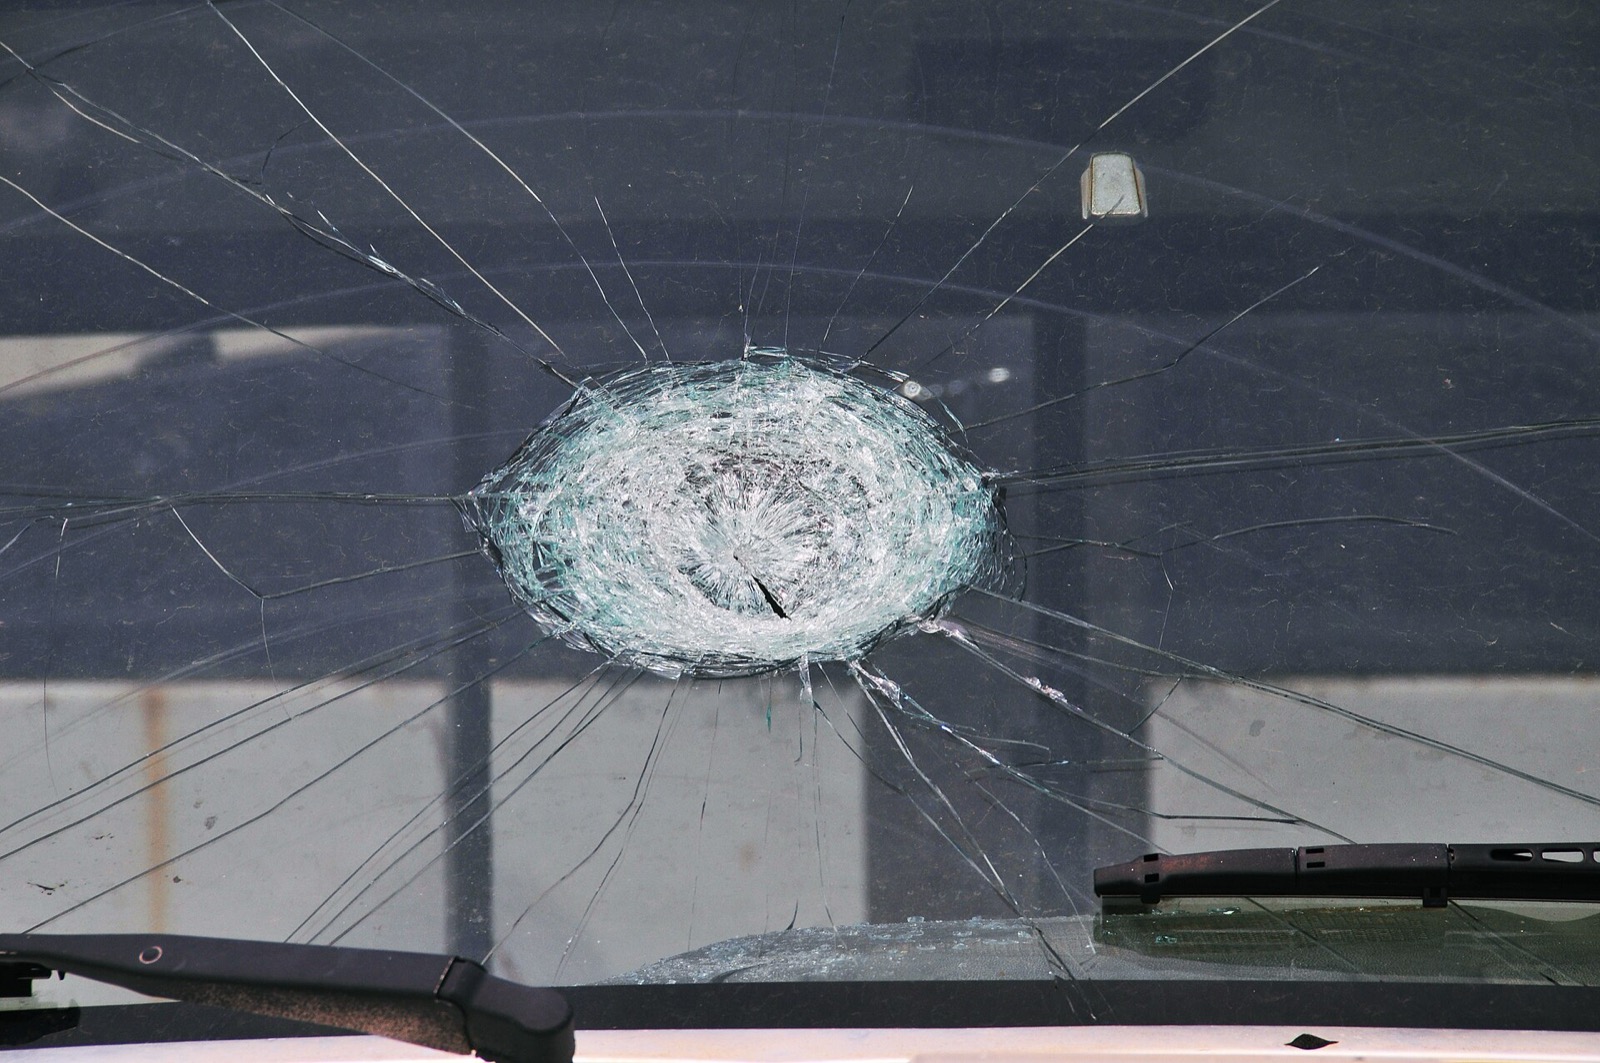
National Weather Service, Severe Thunderstorm Safety“Severe thunderstorms are officially defined as storms that are capable of producing hail that is an inch or larger or wind gusts over 58 mph. Hail this size can damage property such as plants, roofs and vehicles.”
National Weather Service, Severe Thunderstorm Safety“Some severe thunderstorms can produce hail larger than softballs or winds over 100 mph, so please pay attention to the weather so you know when severe storms are possible.”
National Weather Service, What to Do During Severe Weather“Go to your secure location if you hear a severe thunderstorm warning. Damaging wind or large hail may be approaching. Take your pets with you if time allows.”
National Weather Service, What to Do During Severe Weather“Stay away from windows if you are in a severe thunderstorm warning and damaging wind or large hail is approaching. Do not go to large open rooms such as cafeterias, gymnasiums or auditoriums.”
National Weather Service, What to Do During Severe Weather“Being in a vehicle during severe thunderstorms is safer than being outside; however, drive to closest secure shelter if there is sufficient time.”
Hail rarely kills anyone in the United States, and the exception is worth knowing about, because it is the reason the guidance above is about going indoors rather than about watching:
NOAA JetStream, Hazard: Hail“One of the people killed during the March 28, 2000, tornado in Fort Worth was killed when struck by grapefruit-size hail.”
Full guidance is at NWS Severe Thunderstorm Safety, and the Storm Prediction Center publishes the forward looking SPC Convective Outlooks for the next several days. Both are the right place to look for what is going to happen. This page is only the record of what has.
How the Pennsylvania figures are calculated
The source. Every count on this page comes from the NOAA Storm Prediction Center Severe Weather Database, the National Weather Service's own record of severe weather reports, which is a US Government work in the public domain. The hail file holds 414,481 rows going back to 1955. These pages use 205,939 of them.
Three decisions, and why. First, a one inch floor on everything. The National Weather Service moved its severe hail criterion from three quarters of an inch to one inch on 5 January 2010, so sub one inch reports were actively collected before that date and are incidental after it. Any statistic spanning that change is not comparable with itself. Second, days rather than reports. Third, no all time maximum: the window here is 1996 to 2025 and the largest stone shown is the largest in that window, because the older record contains magnitudes larger than the recognised United States record, and they are not reprinted here.
That second change is worth seeing in the original, because almost every hail article on the internet compares counts across it without noticing. The National Weather Service announced it in Service Change Notice 09-52, issued in December 2008 and effective at the start of 2010:
What the counts leave alone. Nothing is normalised by population or by area, because a day count is a day count and dividing days by square miles produces a number that looks meaningful and is not. The database's loss columns are unused, on SPC's own advice, and there is no risk score, index or forecast here.
National Weather Service, Service Change Notice 09-52“EFFECTIVE TUESDAY JANUARY 5 2010 AT 0001 COORDINATED UNIVERSAL TIME /UTC/...ALL NWS WEATHER FORECAST OFFICES /WFOS/ WILL OPERATIONALLY CHANGE THE MINIMUM HAIL SIZE CRITERION USED TO ISSUE SEVERE THUNDERSTORM WARNING /SVR/ AND SEVERE WEATHER STATEMENT /SVS/ PRODUCTS FROM 3/4 INCH /PENNY/ DIAMETER OR LARGER HAIL TO 1 INCH /QUARTER/ DIAMETER OR LARGER HAIL.”
NOAA Storm Prediction Center, Severe Weather Maps, Graphics, and Data Page“Monetary loss information is highly suspect and should be used with caution, if at all.”
NOAA Storm Prediction Center, Severe Weather Maps, Graphics, and Data Page“It should also be noted that these data are used by the NWS for verification purposes and may not accurately reflect all storm events.”
The single biggest limitation of any storm report dataset is that a report requires somebody to be there. The Storm Prediction Center says so itself, in the two quotes above and in the population clustering note quoted on the hub. That bias runs in a very specific direction for hail: thinly populated states with violent storms, Montana and Wyoming among them, record fewer hail days than their weather warrants, while metropolitan corridors record more. The counts here are counts of REPORTED severe hail, uncorrected for that bias: any correction would be a model dressed as data.
Our summary of information published by NOAA SPC Severe Weather Database
Page shape follows the data. A state clearing 30 severe hail days a year AND 5 days a year with 2 inch stones leads with frequency; a state above 10 days a year leads with the season window; below that the page leads with how seldom hail arrives. Pennsylvania is on the seasonal shape. The busiest week is a separate test, and a stricter one: it gets printed only where that seven day window holds at least one severe hail day in a typical year, which is why it appears above. Sources: NOAA SPC Severe Weather Database, US Census Bureau 2020 county codes, NWS api.weather.gov active alerts. All are US Government works in the public domain. SPC last updated the database on 24 April 2026; this snapshot was built on 2026-08-28.
Pennsylvania hail season FAQ
The rest of Pennsylvania's storm season
Hail season in nearby states
Counts are ours, from the NOAA Storm Prediction Center Severe Weather Database, restricted to reports of 1.00 inch or larger over 1996 to 2025. Hail size and updraft figures are quoted from NOAA JetStream. Live products come from the National Weather Service and are shown verbatim. National picture: hail season in every state