Skip to content
Fall 2026 · four flyways

Duck Migration Report 2026

Duck observations usually reach their fall high around the week of Nov 9, the Mississippi Flyway a week or more ahead of the rest. 11 state and refuge surveys have posted 2026 fall counts; the newest, Summer Lake Wildlife Area Weekly Waterfowl Counts in Oregon, found 31,865 ducks on October 7, 2026.

11
2026 fall counts posted
newest October 7, 2026
33.4 million
Breeding ducks, 2026
6% below the long-term average
Week of Nov 9
Usual national fall high
in observations, 2016 to 2025
14
Freeze watch points
forecast lows on four flyways
This week on the flyways

The newest counts, the freeze line and this week’s observations

11 surveys have posted 2026 fall counts so far, in Oregon, Missouri, Michigan, Iowa, Illinois and Kansas. Each flyway below leads with its newest one, and the survey list has every count with its date.

Atlantic Flyway

Usual fall high in observations: week of Nov 9

Last published midwinter survey, January 2026
379,600 ducks
63,900 of them mallards
105,800 scaup and 72,300 ruddy ducks; diving ducks (239,100) were higher than the 100,200 counted in 2025 and the 5-year average (145,860)

Midwinter Waterfowl Survey, Maryland Department of Natural Resources (with the U.S. Fish and Wildlife Service); the flyway’s other counts, with their dates, are in the survey list

Freeze watch on the Atlantic Flyway

Reading the seven day forecast lows at Presque Isle, Lake Champlain at Burlington, Watertown.

Observations this week

Duck observations here usually reach their fall high around the week of Nov 9. Counting this week’s research grade observations.

Mississippi Flyway

Usual fall high in observations: week of Nov 2

Counted October 6, 2026
5,872 ducks
No mallards among them
3,932 blue-winged teal and 1,760 northern pintail

Loess Bluffs National Wildlife Refuge Monthly Habitat, Waterfowl and Eagle Survey Report, U.S. Fish and Wildlife Service (Loess Bluffs National Wildlife Refuge, formerly Squaw Creek); 8 more 2026 fall counts on this flyway below

Freeze watch on the Mississippi Flyway

Reading the seven day forecast lows at Bemidji, Fergus Falls, Green Bay, Alpena, Saginaw Bay.

Observations this week

Duck observations here usually reach their fall high around the week of Nov 2. Counting this week’s research grade observations.

Central Flyway

Usual fall high in observations: week of Nov 9

Counted September 18, 2026
18 ducks
One of them a mallard
17 green-winged teal; the reservoir at 1,703.91 feet, near its 20-year low of 1,702.03 feet
Total added up from the published species counts

KDWP Bi-weekly Waterfowl Survey, U.S. Fish and Wildlife Service, Kirwin National Wildlife Refuge (on the Kansas Department of Wildlife and Parks form)

Freeze watch on the Central Flyway

Reading the seven day forecast lows at Devils Lake, Minot, Aberdeen, Valentine.

Observations this week

Duck observations here usually reach their fall high around the week of Nov 9. Counting this week’s research grade observations.

Pacific Flyway

Usual fall high in observations: week of Nov 16

Counted October 7, 2026
31,865 ducks
470 snow and Ross's geese the same week

Summer Lake Wildlife Area Weekly Waterfowl Counts, Oregon Department of Fish and Wildlife (Summer Lake Wildlife Area)

Freeze watch on the Pacific Flyway

Reading the seven day forecast lows at Freezeout Lake, Klamath Falls.

Observations this week

Duck observations here usually reach their fall high around the week of Nov 16. Counting this week’s research grade observations.

Observations are research grade iNaturalist records of fourteen dabbling and diving ducks, as a share of all bird observations so the growth of the app does not read as more ducks. The freeze watch reads National Weather Service seven day forecast lows and marks nights at or below 28°F.

Advertisement
Every count in one place

41 state and refuge waterfowl surveys

Grouped by what they count. Surveys flown through the season come first, newest count first. The January midwinter surveys and the spring breeding surveys answer different questions, so they sit apart with their year on every number. Dates an agency gives as a survey window are shown to the month. The last 10 come from earlier seasons, kept for the record under their year: either the newest published number is more than a year and a half old, or the agency has stopped flying the survey.

Counted through the season

2026 fall count

Summer Lake Wildlife Area Weekly Waterfowl Counts

Oregon Department of Fish and Wildlife (Summer Lake Wildlife Area) · Oregon

Counted October 7, 2026
31,865 ducks
470 snow and Ross's geese the same week
In the agency’s words, and the survey
Summer Lake Wildlife Area Weekly Waterfowl Counts Ducks ... 9/22 - 9/28 33,285 ... 9/29 - 10/5 30,700 ... 10/6 - 10/12 31,865 44,802 50,856 97,073 36,057 60,839 59,687 39,728 42,368 42,785 51,879 57,925
Oregon Department of Fish and Wildlife (Summer Lake Wildlife Area), October 7, 2026. Read it at the source

Ducks, geese, swans and coots on the Summer Lake Wildlife Area in south central Oregon, counted each week of the season and set against past years

How often
Weekly, early September to late January
Season
September to January
The usual peak
10/6 - 10/12, the highest week in the Pre 5-Yr average column (57,925 ducks)
Long term
Pre 5-Yr average for 10/6 - 10/12: 57,925 ducks
Counted at
Summer Lake Wildlife Area
2026 fall count

Loess Bluffs National Wildlife Refuge Monthly Habitat, Waterfowl and Eagle Survey Report

U.S. Fish and Wildlife Service (Loess Bluffs National Wildlife Refuge, formerly Squaw Creek) · Missouri

Counted October 6, 2026
5,872 ducks
No mallards among them
3,932 blue-winged teal and 1,760 northern pintail
In the agency’s words, and the survey
All Ducks 481 661 6,783 5,872 (weeks of 09/15/2026, 09/22/2026, 09/29/2026, 10/06/2026)
U.S. Fish and Wildlife Service (Loess Bluffs National Wildlife Refuge, formerly Squaw Creek), October 6, 2026. Read it at the source

Ducks, geese, swans and bald eagles on the refuge's wetlands in northwest Missouri, by species, with acres flooded and percent frozen

How often
Weekly surveys are completed by refuge staff from fall through spring migration.
Season
September to March
Highest published count
139,386 ducks, November 2025
Counted at
  • Loess Bluffs National Wildlife Refuge, Forest City, MO
2026 fall count

Pointe Mouillee SGA waterfowl counts

Michigan Department of Natural Resources (Wetland Wonders managed waterfowl areas) · Michigan

Week ending October 4, 2026
1,265 ducks
750 of them mallards
In the agency’s words, and the survey
Week Ending: 10/04/2026 | Total ducks: 1265 | Mallard: 750 | Black duck: 20 | Wood duck: 275 | Gadwall: 150 | Northern pintail: 10 | Blue-winged teal: 30 | Green-winged teal: 20 | Total dabblers: 1255 | Scaup: 10 | Total divers: 10
Michigan Department of Natural Resources (Wetland Wonders managed waterfowl areas), the week ending October 4, 2026. Read it at the source

Ducks, geese and swans counted each week on Pointe Mouillee State Game Area, a 4,040 acre Michigan DNR managed waterfowl area on the western shore of Lake Erie, by species; a fall migration count

How often
Weekly, by week ending date; the 2026 table runs from the week ending September 6, 2026 to the week ending January 24, 2027
Season
September to January
Counted at
Pointe Mouillee State Game Area
2026 fall count

Fall Migration Waterfowl Survey (Waterfowl Migration Report)

Iowa Department of Natural Resources · Iowa

Counted October 2, 2026
30,390 ducks
The statewide duck count increased by 33.4% and the Canada goose count increased by 27.2% from last week.
In the agency’s words, and the survey
Fall Migration Waterfowl Survey Week Ending: October 2, 2026 ... Total 30390 22789 12 88 0 6660 5237 100 0. Blue-winged teal were the most abundant duck followed by wood ducks and mallards. At a statewide scale, observers counted 53.4% more ducks and 37.8% fewer Canada geese than during this week last year.
Iowa Department of Natural Resources, October 2, 2026. Read it at the source

Ducks and geese at about 20 survey sites across Iowa, counted each week of the fall migration, with the duck share split into mallard, other dabblers and divers

How often
Weekly each fall (2026 reports dated September 4, 11, 18, 25 and October 2)
Season
September
Counted at
Bays Branch Areas, Big Marsh, Black Hawk Areas, Coralville Areas, Green Island, Ingham Areas, Lake Odessa Areas, Lake Sugema, and 12 more
2026 fall count

Fish Point SWA waterfowl counts

Michigan Department of Natural Resources (Wetland Wonders managed waterfowl areas) · Michigan

Week ending September 27, 2026
4,000 ducks
750 of them mallards
750 green-winged teal and 500 northern pintail; first divers of the fall (350, including 200 ring-necked ducks)
In the agency’s words, and the survey
Week Ending: 09/27/2026 | Total ducks: 4000 | Mallard: 750 | Black duck: 50 | Wood duck: 700 | American wigeon: 250 | Gadwall: 200 | Northern pintail: 500 | Blue-winged teal: 450 | Green-winged teal: 750 | Total dabblers: 3650 | Redhead: 100 | Ring-necked duck: 200 | Scaup: 50 | Total divers: 350
Michigan Department of Natural Resources (Wetland Wonders managed waterfowl areas), the week ending September 27, 2026. Read it at the source

Ducks, geese and swans counted each week on Fish Point State Wildlife Area, a Michigan DNR managed waterfowl area on Saginaw Bay, by species; a fall migration count

How often
Weekly, by week ending date; the 2026 table runs from the week ending September 6, 2026 to the week ending January 24, 2027
Season
September to January
Counted at
Fish Point State Wildlife Area
2026 fall count

Shiawassee River SGA waterfowl counts

Michigan Department of Natural Resources (Wetland Wonders managed waterfowl areas) · Michigan

Week ending September 27, 2026
3,140 ducks
895 of them mallards
1,057 wood ducks and 990 American wigeon
In the agency’s words, and the survey
Week Ending: 09/27/2026 | Total ducks: 3140 | Mallard: 895 | Black duck: 50 | Wood duck: 1057 | American wigeon: 990 | Gadwall: 120 | Blue-winged teal: 11 | Green-winged teal: 17 | Total dabblers: 3140 | Total divers: 0
Michigan Department of Natural Resources (Wetland Wonders managed waterfowl areas), the week ending September 27, 2026. Read it at the source

Ducks, geese and swans counted each week on the Shiawassee River State Game Area, a Michigan DNR managed waterfowl area near Saginaw, by species; a fall migration count

How often
Weekly, by week ending date; the 2026 table runs from the week ending September 6, 2026 to the week ending January 24, 2027
Season
September to January
The usual peak
late November in 2025 (the highest 2025 refuge count was Monday, November 24, the week of Thanksgiving)
Highest published count
19,310 ducks, November 2025
Counted at
  • Prior Rd. refuge, Shiawassee River SGA
2026 fall count

INHS Waterfowl Aerial Inventory, Central Mississippi River

Illinois Natural History Survey (Forbes Biological Station) · Illinois

Counted September 23, 2026
4,275 ducks
395 of them mallards
The 10-year average (2016 to 2025) for this flight is 18,380 ducks
In the agency’s words, and the survey
TOTAL MISSISSIPPI 395 0 945 2,090 650 15 25 155 0 0 0 0 0 0 0 0 0 4,275 ... 10-Year Average 750 0 8,352 3,132 4,708 34 127 1,269 0 7 0 0 0 0 0 0 0 18,380 ... 2016-2025
Illinois Natural History Survey (Forbes Biological Station), September 23, 2026. Read it at the source

Ducks, geese and other waterbirds at 18 sites on the central Mississippi River from Alton to Moline, by species, from the air

How often
Weekly from September through early January
Season
September to January
The usual peak
early December (the highest 10-year average in the 2025 sheets is 585,751 ducks for the 12/05 flight)
Highest published count
642,330 ducks, November 2025
Long term
10-year average for 2016 to 2025, printed under each weekly total (for example 585,751 ducks for December 5, 2025 and 537,271 for December 9, 2025)
Counted at
Keokuk-Nauvoo, Arthur Refuge, Nauvoo-Ft. Madison, Ft. Madison-Dallas, Henderson Creek, Keithsburg Refuge, Louisa Refuge, Swan Lake, and 10 more
2026 fall count

INHS Waterfowl Aerial Inventory, Illinois River

Illinois Natural History Survey (Forbes Biological Station) · Illinois

Counted September 23, 2026
11,915 ducks
810 of them mallards
The 10-year average (2016 to 2025) for this flight is 38,604 ducks
In the agency’s words, and the survey
TOTAL ILLINOIS 810 0 3,575 4,020 2,210 85 45 1,170 0 0 0 0 0 0 0 0 0 11,915 ... 10-Year Average 1,749 0 11,562 7,709 13,051 216 589 3,675 0 0 0 0 20 0 0 0 0 38,604 ... 2016-2025
Illinois Natural History Survey (Forbes Biological Station), September 23, 2026. Read it at the source

Ducks, geese and other waterbirds at 23 sites on the Illinois River from Hennepin to Grafton, by species, from the air

How often
Weekly from September through early January
Season
September to January
The usual peak
mid November (the highest 10-year average in the 2025 sheets is 365,157 ducks for the 11/13 flight)
Highest published count
473,135 ducks, November 2025
Long term
10-year average for 2016 to 2025, printed under each weekly total (for example 365,157 ducks for November 13, 2025 and 270,066 for November 28, 2025)
Counted at
Hennepin/Hopper, Goose Lake, Senachwine Lake, Hitchcock Slough, Douglas Lake, Upper Peoria, Powerton, Rice Lake, and 14 more
2026 fall count

Muskegon County Resource Recovery Center waterfowl counts

Michigan Department of Natural Resources (Wetland Wonders managed waterfowl areas) · Michigan

Week ending September 20, 2026
7,930 ducks
100 of them mallards
4,050 ruddy ducks and 3,700 northern shovelers
In the agency’s words, and the survey
Week Ending: 09/20/2026 | Total ducks: 7930 | Mallard: 100 | Gadwall: 15 | Northern shoveler: 3700 | Blue-winged teal: 65 | Total dabblers: 3880 | Ruddy duck: 4050 | Total divers: 4050
Michigan Department of Natural Resources (Wetland Wonders managed waterfowl areas), the week ending September 20, 2026. Read it at the source

Ducks, geese and swans counted each week at the Muskegon County Resource Recovery Center (wastewater lagoons and fields), a Michigan DNR managed waterfowl area, by species; a fall migration count

How often
Weekly, by week ending date; the 2026 table runs from the week ending September 6, 2026 to the week ending January 24, 2027
Season
September to January
Counted at
Muskegon County Resource Recovery Center
2026 fall count

Nayanquing Point SWA waterfowl counts

Michigan Department of Natural Resources (Wetland Wonders managed waterfowl areas) · Michigan

Week ending September 20, 2026
1,500 ducks
750 of them mallards
In the agency’s words, and the survey
Week Ending: 09/20/2026 | Total ducks: 1500 | Mallard: 750 | Wood duck: 250 | Blue-winged teal: 250 | Green-winged teal: 250 | Total dabblers: 1500 | Total divers: 0
Michigan Department of Natural Resources (Wetland Wonders managed waterfowl areas), the week ending September 20, 2026. Read it at the source

Ducks, geese and swans counted each week on Nayanquing Point State Wildlife Area, a Michigan DNR managed waterfowl area on Saginaw Bay, by species; a fall migration count

How often
Weekly, by week ending date; the 2026 table runs from the week ending September 6, 2026 to the week ending January 24, 2027
Season
September to January
Counted at
Nayanquing Point State Wildlife Area
2026 fall count

KDWP Bi-weekly Waterfowl Survey

U.S. Fish and Wildlife Service, Kirwin National Wildlife Refuge (on the Kansas Department of Wildlife and Parks form) · Kansas

Counted September 18, 2026
18 ducks
One of them a mallard
17 green-winged teal; the reservoir at 1,703.91 feet, near its 20-year low of 1,702.03 feet
Total added up from the published species counts
In the agency’s words, and the survey
Survey Location: Kirwin NWR Date: 9/18/26 ... Mallard 1 ... Green-winged 17 ... Comments: Winds 17 mph. Low reservoir water level (1,703.91 feet). Historic 20-year low – 1,702.03 feet.
U.S. Fish and Wildlife Service, Kirwin National Wildlife Refuge (on the Kansas Department of Wildlife and Parks form), September 18, 2026. Read it at the source

Ducks, geese, swans and coots on Kirwin Reservoir in north central Kansas, by species, from the ground

How often
Bi-weekly
Season
September
Counted at
Kirwin NWR
Counted through the season

Eastern Neck Wildlife Refuge Weekly Waterfowl Survey

U.S. Fish and Wildlife Service, Eastern Neck National Wildlife Refuge · Maryland

Last season’s count, March 25, 2026
No mallards
1,040 scaup and 500 ruddy ducks
In the agency’s words, and the survey
Survey Date 3/4/2026 3/11/2026 3/18/2026 3/25/2026 ... Mallard 18 5 4 0 ... Refuge Total 5630 7282 2982 1586
U.S. Fish and Wildlife Service, Eastern Neck National Wildlife Refuge, March 25, 2026. Read it at the source

Ducks, geese and swans around Eastern Neck Island at the mouth of the Chester River on the Chesapeake Bay, by species

How often
Weekly
Season
November to March
Highest published count
26,703 ducks, January 2026
Counted at
Eastern Neck NWR
Counted through the season

Blackwater National Wildlife Refuge Ground Waterfowl Survey

U.S. Fish and Wildlife Service, Blackwater National Wildlife Refuge · Maryland

Last season’s count, March 19, 2026
469 ducks
62 of them mallards
In the agency’s words, and the survey
Winter 2026 ... 3/19/2026 ... Mallard MALL ... 62 ... total waterfowl ... 621 ... total duck ... 469
U.S. Fish and Wildlife Service, Blackwater National Wildlife Refuge, March 19, 2026. Read it at the source

Ducks, geese, swans and other water birds on Blackwater NWR on Maryland's Eastern Shore, by species, from the ground, plus a January aerial survey

How often
Roughly weekly
Season
November to March
Highest published count
5,613 ducks, January 2026
Counted at
Blackwater, Barren Island, Bishops Head, Smith Island, South Marsh and Bloodsworth Island
Counted through the season

Bi-Weekly Waterfowl Counts (TWRA Waterfowl Refuge Counts)

Tennessee Wildlife Resources Agency · Tennessee

Last season’s count, February 27, 2026
597 ducks
200 of them mallards
Season high on one refuge: 120,000 ducks, 96,000 of them mallards, on White Lake Refuge (Dyer Co.), February 1, 2026
In the agency’s words, and the survey
DateSurveyed: 2026-02-27 | DateRange: Mid February | AreaSurveyed: Cheatham-PP | SurveyType: ground | Mallard: 200 | DuckTotals: 597
Tennessee Wildlife Resources Agency, February 27, 2026. Read it at the source

Ducks, geese and swans on TWRA waterfowl refuges from Reelfoot Lake (Black Bayou) to east Tennessee, by species, by ground and air

How often
Bi-Weekly; the dashboard describes it as waterfowl survey counts for Nov 1 to Feb 15 each year
Season
November to February
The usual peak
early January (highest point of the dashboard's Five Year Average of All Waterfowl, survey week 4)
Highest published count
120,000 ducks, February 2026
Long term
Five year average of all waterfowl per refuge survey, by survey week: week 4 (from about Dec 31) 18,863; week 3 12,361; week 5 16,920
Counted at
  • Black Bayou Refuge, Lake Co.
  • White Lake Refuge, Dyer Co.
  • Maness Swamp Refuge, Weakly Co.
  • Hop-In Refuge, Obion Co.
  • and 13 more
Counted through the season

Wheeler NWR Waterfowl Survey

U.S. Fish and Wildlife Service, Wheeler National Wildlife Refuge · Alabama

Last season’s count, February 17, 2026
11,237 ducks
1,766 of them mallards
In the agency’s words, and the survey
Date: February 17, 2026 ... TOTAL DUCKS: 11,237 ... TOTAL GEESE: 15 ... TOTAL WATERFOWL: 11,252
U.S. Fish and Wildlife Service, Wheeler National Wildlife Refuge, February 17, 2026. Read it at the source

Ducks, geese and cranes on the refuge's units along Wheeler Lake in north Alabama, by species and unit

How often
About every two weeks
Season
November to February
Highest published count
38,062 ducks, January 2026
Counted at
Flint Creek, Penny Bottoms, Rockhouse, White Springs, Garth Slough, Limestone Bay, DeVaney
Counted through the season

Weekly Waterfowl Survey

U.S. Fish and Wildlife Service, Salt Plains National Wildlife Refuge · Oklahoma

Last season’s count, February 3, 2026
8,452 ducks
781 of them mallards
11,155 geese and 6,388 sandhill cranes on the same count; the lake 90% ice
In the agency’s words, and the survey
Weekly Waterfowl Survey 2/3/2026 ... LAKE LEVEL/CONDITIONS: 1125.42' / 90% ice ... Mallard 781 ... Unidentified 6,602 TOTAL DUCKS 8,452
U.S. Fish and Wildlife Service, Salt Plains National Wildlife Refuge, February 3, 2026. Read it at the source

Ducks, geese, cranes and other waterbirds on Salt Plains National Wildlife Refuge and Great Salt Plains Lake, by species, from a ground count

How often
Weekly (the refuge posts each count to the same 'Weekly Waterfowl Survey' page, replacing the last one)
Counted at
Salt Plains National Wildlife Refuge (Great Salt Plains Lake)
Counted through the season

Aerial Waterfowl Survey

Arkansas Game and Fish Commission · Arkansas

Last season’s count, January 2026
694,286 ducks
337,479 of them mallards
In the Delta, mallards ran 343,221 below the 2010 to 2025 late January average
In the agency’s words, and the survey
Biologists conducting transect-based surveys in the Delta estimated 337,479 mallards and 694,286 total ducks (Table 1)
Arkansas Game and Fish Commission, January 2026. Read it at the source

Mallards, total ducks and geese estimated from transect flights over the Arkansas Delta, plus the Arkansas River Valley and a cruise survey in southwest Arkansas

How often
Three to four survey periods a season: late November, mid-December, the early January Midwinter Survey and late January
Season
November to January
The usual peak
early January (the Midwinter Survey)
Highest published count
1,458,354 ducks, December 2025
Long term
2010-2025 late-January long-term average (Delta mallards 343,221 above the January 2026 estimate; total ducks 503,937 above it)
Counted at
Bayou Bartholomew - Bayou Boeuf, Bayou Macon, Bayou Meto - Lower Arkansas, Big Creek, Black - Upper White, Cache, L' Anguille, Lower White - Bayou Des Arc, and 4 more
Counted through the season

MDWFP Aerial Waterfowl Survey

Mississippi Department of Wildlife, Fisheries, and Parks · Mississippi

Last season’s count, January 2026
603,165 ducks
140,042 of them mallards
414,947 dabbling ducks other than mallards, 16% above the early January long-term average and nearly 70% of all duck observations
In the agency’s words, and the survey
Species Group Early Jan 2026 Early Jan LTA % Change from LTA / Mallards 140,042 209,984 -33% / Other Dabblers 414,947 358,284 +16% / Diving Ducks 48,175 90,333 -47% / Total Ducks 603,165 656,868 -8%
Mississippi Department of Wildlife, Fisheries, and Parks, January 2026. Read it at the source

Ducks in the Mississippi Delta, estimated from random east-west aerial transects flown from the Mississippi River to the hill line

How often
Surveys are typically conducted four times a year along randomly selected transects (November, December, early January, late January)
Season
November to January
The usual peak
Mississippi typically experiences peak numbers of wintering waterfowl during the month of January
Long term
Early January average, 2008-2026: Total Ducks 656,868; Mallards 209,984
Counted at
Mississippi Delta
Counted through the season

Waterfowl and Wetland Status Reports

Oklahoma Department of Wildlife Conservation · Oklahoma

Last season’s count, January 15, 2026
Copan: duck numbers improving with every front
In the agency’s words, and the survey
Copan ... Updated: January 15, 2026 ... Elevation: 0.87ft above normal pool, duck numbers improving with every front, flooded all summer long, poor food in lake.
Oklahoma Department of Wildlife Conservation, January 15, 2026. Read it at the source

Written duck and goose conditions and water levels on 25 wildlife management areas and their wetland units, by area, without counts

How often
Updated every other Thursday, beginning on Nov. 12, 2026 through Jan. 21, 2027
Season
November to January
Counted at
Copan, Red Slough, Deep Fork, Drummond Flats, Eufaula, Ft. Cobb, Grassy Slough, Hackberry Flat, and 17 more
Counted through the season

Louisiana Aerial Waterfowl Survey, Coastal Zone and Little River Basin

Louisiana Department of Wildlife and Fisheries · Louisiana

Highest published count, January 2026
2,458,000 ducks
Against the 1969 to 2026 January average of 2.94 million
September 2026 count, which LDWF marks incomplete due to partial data: 89,000
73,000 blue-winged teal, 28% below 2025 and 72% below the 10-year average
In the agency’s words, and the survey
The 2026 January survey estimate of 2.46 million ducks in Louisiana’s coastal region and Little River Basin (Table 1) represents a 48% increase from the 1.66 million estimated in December 2025. ... 16% lower than the long–term (1969 – 2026) average for January (2.94 million).
Louisiana Department of Wildlife and Fisheries, January 2026. Read it at the source
TOTAL DUCKS 50,000* 37,000 2,000 89,000* ... * Estimate incomplete due to partial data.
Louisiana Department of Wildlife and Fisheries, September 2026. Read it at the source

Ducks on 27 coastal marsh transects from the Gulf to U.S. 90 plus the Little River Basin, by species, from the air, with cruise counts of geese and of northwest Louisiana

How often
Aerial surveys across Louisiana during September, November, December, and January
Season
September to January
Counted at
Southwest Louisiana coastal marshes, Southeast Louisiana coastal marshes (transect lines 18 to 27), Little River Basin, Catahoula Lake, Northeast Louisiana, Northwest Louisiana, Lake Maurepas, Lake Pontchartrain, and 1 more
Counted through the season

Mingo NWR Waterfowl Count

U.S. Fish and Wildlife Service, Mingo National Wildlife Refuge · Missouri

Last season’s count, January 8, 2026
25,564 ducks
17,739 of them mallards
In the agency’s words, and the survey
waterfowl count 1/8/26 ... Mallard (MALL) | 17,739 ... Total Ducks | 25,564
U.S. Fish and Wildlife Service, Mingo National Wildlife Refuge, January 8, 2026. Read it at the source

Ducks and geese on Mingo National Wildlife Refuge in southeast Missouri, by species, from the refuge's own fall and winter migration counts

How often
About weekly from October into late January
Highest published count
35,608 ducks, January 2025
Counted at
Mingo National Wildlife Refuge
Counted through the season

Bi-Weekly Waterfowl Survey

Ohio Department of Natural Resources, Division of Wildlife · Ohio

Last season’s count, November 2025
90,197 ducks
26,583 of them mallards
The five year average (2021 to 2025) for the mid November flight is 136,137 ducks, 54,575 of them mallards
In the agency’s words, and the survey
Species Group Dabblers & Divers Species All Year 2025 Zone All Location All | 2025: Early September 3008, Mid September 3239, Early October 19627, Early November 44405, Mid November 90197 | 5 Year Avg 2021-2025 Avg. Value: 6,703 6,234 19,665 118,346 136,137
Ohio Department of Natural Resources, Division of Wildlife, November 2025. Read it at the source

Ducks, geese and swans counted from the air over the Lake Erie marshes of northwestern Ohio (state wildlife areas, Ottawa NWR and Sandusky Bay) plus inland wildlife areas in northern Ohio, by species; a fall and winter migration count

How often
The survey is flown weekly during September and bi-weekly from October through January.
Season
September to January
Long term
5 Year Avg 2021-2025 (ducks, dabblers and divers): 6,703 early September, 6,234 mid September, 19,665 early October, 118,346 early November, 136,137 mid November
Counted at
Sandusky Bay Marshes, Pickerel Creek Wildlife Area, Toussaint Marsh Area, Magee Marsh Wildlife Area, Metzger Marsh Wildlife Area, Maumee Bay, Ottawa National Wildlife Refuge, Cedar Point National Wildlife Refuge, and 11 more
Counted through the season

Missouri Waterfowl and Habitat Survey (Missouri Waterfowl Counts)

Missouri Department of Conservation · Missouri

About the survey

Ducks and geese on state conservation area wetlands and national wildlife refuges across Missouri, counted per area

How often
Updated about every other Wednesday/Thursday from late October through early January.
Season
October to January
The usual peak
North Zone mallards mid to late November; Middle Zone mallards early December; early dabblers early to mid November (2017-2023 short-term average)
Counted at
Columbia Bottom CA, Loess Bluffs NWR, Nodaway Valley CA, Fountain Grove CA, Swan Lake NWR, Ted Shanks CA, Clarence Cannon NWR, BK Leach CA, and 7 more

The last published midwinter survey

Midwinter survey

Aerial Waterfowl Survey

Delaware Department of Natural Resources and Environmental Control, Division of Fish and Wildlife · Delaware

Last published midwinter survey, January 2026
59,709 ducks
18,363 of them mallards
22,649 American black ducks, the most in any January flight in the dataset since 1978, and 24,174 snow geese against 248,322 in 2025
Total added up from the published species counts
In the agency’s words, and the survey
{"year":"2026","sum_atlantic_brant":"74","sum_canada_goose":"84257","sum_snow_goose":"24174",...,"sum_american_black_duck":"22649","sum_mallard":"18363","sum_northern_pintail":"5190"
Delaware Department of Natural Resources and Environmental Control, Division of Fish and Wildlife, January 2026. Read it at the source

Ducks, geese and swans across the eastern half of Delaware from the Pennsylvania line to the Maryland line, by species and survey zone, from the air; the January flight is the statewide Midwinter count and the fall flights cover the bayshore zones only

How often
Fall flights in October, November and December over three bayshore zones (zones 5 to 7), then one statewide January Midwinter flight over every zone
Season
October to January
Counted at
  • Zone 1, Pennsylvania State line south to the Delaware Memorial Bridge
  • Zone 2, Delaware Memorial Bridge to the C&D Canal
  • Zone 3, C&D Canal to Liston Point and Kenton
  • Zone 4, Liston Point to Route 6 Smyrna
  • and 7 more
Midwinter survey

Midwinter Waterfowl Survey

Maryland Department of Natural Resources (with the U.S. Fish and Wildlife Service) · Maryland

Last published midwinter survey, January 2026
379,600 ducks
63,900 of them mallards
105,800 scaup and 72,300 ruddy ducks; diving ducks (239,100) were higher than the 100,200 counted in 2025 and the 5-year average (145,860)
In the agency’s words, and the survey
This year, the survey teams counted about 926,900 waterfowl which was higher than both the 705,300 birds observed in 2025 and the most recent five-year average of 684,280 birds. ... Total Ducks 179,800 289,100 215,400 233,300 379,600
Maryland Department of Natural Resources (with the U.S. Fish and Wildlife Service), January 2026. Read it at the source

Ducks, geese and swans wintering along Maryland's Chesapeake Bay, tidal Potomac River and Atlantic coast shorelines, counted from the air once each January

How often
Once a year, during the first week of January
Season
January to January
Long term
five-year average of 684,280 birds (all waterfowl); mallards 5-year average 56,320; diving ducks 5-year average 145,860
Counted at
Chesapeake Bay, Tidal Potomac River, Atlantic coast shorelines
Midwinter survey

Midwinter Aerial Waterfowl Survey, Mattamuskeet National Wildlife Refuge

U.S. Fish and Wildlife Service, Southeast Region National Wildlife Refuge System (Mattamuskeet National Wildlife Refuge) · North Carolina

Last published midwinter survey, January 2026
217,264 dabbling ducks
45,097 diving ducks
9,474 of them mallards
286,972 total waterfowl, the second highest of 61 Southeast refuges flown, led by an estimated 82,671 American wigeon and 52,298 northern pintail
USFWS estimate, corrected for birds missed from the air
In the agency’s words, and the survey
Mattamuskeet NWR 217,264 45,097 9,663 14,948 0 286,972 286,972
U.S. Fish and Wildlife Service, Southeast Region National Wildlife Refuge System (Mattamuskeet National Wildlife Refuge), January 6, 2026. Read it at the source

A January aerial survey of ducks, geese and swans on Mattamuskeet NWR and Lake Mattamuskeet in eastern North Carolina, reported as visibility corrected estimates by species and by guild, not raw counts

How often
One January aerial survey a year (Midwinter), published as a regional report the following spring
Season
January to January
Counted at
Open water transects (unit GX), Survey unit A, Survey unit B, Survey unit D, Survey unit E
Midwinter survey

Midwinter Aerial Waterfowl Survey of SCDNR Coastal Waterfowl Areas

South Carolina Department of Natural Resources, with the U.S. Fish and Wildlife Service · South Carolina

Last published midwinter survey, January 2026
53,889 ducks
124 of them mallards
38,960 ducks estimated on Santee Coastal Reserve and 13,349 at Yawkey, mostly teal, gadwall, pintail, wigeon and shovelers; up from 34,889 waterfowl on the same six properties in January 2025
Total and mallards added up from the published species counts
USFWS estimate, corrected for birds missed from the air
In the agency’s words, and the survey
Santee Coastal SCDNR | 0 | 15.072960237970458 | 9070.8437826462377 | 3464.9763454089421 | 10165.650204437979 | 6803.8493333340184 | 7762.0437845182396
South Carolina Department of Natural Resources, with the U.S. Fish and Wildlife Service, January 2026. Read it at the source

A January aerial survey of ducks, geese and swans on six SCDNR coastal waterfowl properties (Santee Coastal Reserve, Yawkey, Bear Island and others), flown by USFWS crews with SCDNR, reported as visibility corrected estimates, not raw counts

How often
One January aerial survey a year (Midwinter); SCDNR also runs weekly or biweekly ground counts on lottery hunt areas in December and January but publishes only a season total
Season
January to January
Counted at
Santee Coastal Reserve WMA, Tom Yawkey Wildlife Center, Bear Island WMA, Santee Delta WMA, Samworth WMA, Sandy Beach WMA
Midwinter survey

Kentucky Waterfowl Ground Counts (Periodic Waterfowl Surveys and Ground Counts)

Kentucky Department of Fish and Wildlife Resources · Kentucky

Last published midwinter survey, February 2026
12,441 ducks
9,513 of them mallards
2026 midwinter aerial survey of the Western Kentucky Purchase Region, January 5, 2026: 33,240 ducks, 17,982 of them on Ballard WMA, with 45,000 snow and blue geese there
In the agency’s words, and the survey
Sloughs WMA 02/10/2026 | 12441 total | 9513 Mallard | 1307 Misc Dabblers | 1121 Pintail | 500 GW teal | Mallard 76%
Kentucky Department of Fish and Wildlife Resources, February 10, 2026. Read it at the source

Ducks and geese by species on Kentucky's waterfowl WMAs, counted from the ground each week of the season, plus the January Mid-Winter aerial survey

How often
Weekly reports during the season (Waterfowl Ground Counts, Nov. 21, 2025 - Feb. 13, 2026); Mid-Winter Waterfowl Aerial Survey each January
Season
November to February
Counted at
Ballard WMA, Boatwright WMA, Sloughs WMA, Doug Travis WMA, Duck Island WMA, Peabody WMA, Yellowbank WMA, Barren River Lake WMA, and 7 more

How many ducks were raised up north this spring

Spring breeding survey

Minnesota Breeding Waterfowl Survey

Minnesota Department of Natural Resources · Minnesota

Spring breeding survey, May 2026
678,914 ducks
239,579 of them mallards
205,650 blue-winged teal, more than triple the 2025 estimate; total ducks up 62% from 2025
In the agency’s words, and the survey
Likewise, the estimated total duck population (excluding scaup) increased to 677,868 birds (SE = 154,631; Table 5; Figure 7), a 62% increase from the previous year and above both the 10-year and long-term averages. Including scaup, the estimated statewide breeding duck population reached 678,914 birds
Minnesota Department of Natural Resources, May 2026. Read it at the source

Breeding ducks, Canada geese and trumpeter swans across Minnesota's lake country, estimated from May aerial transects

How often
Conducted annually since 1968; the 2026 aerial survey began on 2 May and concluded on 25 May
Season
May to May
Long term
Total Ducks: 10-year average 602,805; long-term average 669,244 (survey since 1968)
Counted at
Stratum I, Stratum II, Stratum III
Spring breeding survey

Spring breeding duck survey (with the July duck brood survey and fall flight forecast)

North Dakota Game and Fish Department · North Dakota

Spring breeding survey, June 2026
2,400,000 ducks
Fall flight forecast: duck brood numbers up 55% from 2025, fall flight about 9% higher than last year
In the agency’s words, and the survey
The North Dakota Game and Fish Department’s 79th annual spring breeding duck survey conducted in May showed an index of about 2.4 million birds, down 9.5% from 2.66 million birds in 2025 and 2.9 million in 2024.
North Dakota Game and Fish Department, June 2026. Read it at the source

A statewide index of breeding ducks in May and duck broods in July, used to forecast North Dakota's fall flight

How often
Annual, breeding survey in May and brood survey in July
Season
May to July
Long term
The 2026 breeding duck index dipped below the 1948-2025 average for the first time since 1993
Spring breeding survey

California Waterfowl Breeding Population Survey

California Department of Fish and Wildlife, Waterfowl Unit · California

Spring breeding survey, May 2026
435,937 ducks
267,101 of them mallards
Gadwalls (Mareca strepera) decreased 44% from 2025 and are 28% below the long-term average.
In the agency’s words, and the survey
Total breeding ducks in the survey area decreased 10% from 2025 (435,937 ± 42,688) and 18% below LTA (Table 1). The most abundant duck species were mallards (267,101 ± 34,278), gadwall (61,658 ± 17,299), cinnamon teal (39,745 ± 12,979), and northern shoveler (30,335 ± 9,582).
California Department of Fish and Wildlife, Waterfowl Unit, May 2026. Read it at the source

Breeding ducks in the Central Valley and northeastern California, estimated from spring aerial transects; a spring index, not a migration count

How often
Once a year in spring (2026: April 20 to 28 in the Central Valley, May 6 to 7 in northeastern California)
Season
April to May
Long term
Total ducks long-term average 531,886; mallard long-term average 317,819 (long-term average for 1992 to 2025, ducks and coots)

Counts from earlier seasons

Earlier seasons

Klamath Basin refuge aerial waterfowl survey (Lower Klamath and Tule Lake NWR)

U.S. Fish and Wildlife Service, Klamath Basin National Wildlife Refuge Complex · California

High count of the last season flown, March 7, 2025
334,732 ducks
Funding cuts eliminated aerial surveys beginning fall 2025. This marks the end of the nation's longest-running refuge-based aerial waterfowl survey.
U.S. Fish and Wildlife Service, Klamath Basin National Wildlife Refuge Complex. Read it at the source
About the survey

Ducks and geese on Lower Klamath and Tule Lake national wildlife refuges, from the air, during fall and spring migration; ended after the 2024-25 season

How often
Ten aerial surveys between fall 2024 and spring 2025; discontinued from fall 2025
Counted at
Lower Klamath National Wildlife Refuge, Tule Lake National Wildlife Refuge
Earlier seasons

Green Bay Fall survey (Wisconsin Non-Breeding Waterfowl Survey of Green Bay)

Wisconsin Department of Natural Resources · Wisconsin

Newest published count, December 2024
415 mallards
14,581 scaup, greater and lesser, on the three transect groups
In the agency’s words, and the survey
December 9, 2024 Survey ... Scaup (greater, lesser) 1,692 9,178 3,711 14,581 ... Mallard 175 150 90 415 ... Total 3,084 11,965 5,668 20,717
Wisconsin Department of Natural Resources, December 9, 2024. Read it at the source

Diving ducks, dabblers, geese and swans on fixed aerial transects across the bay of Green Bay

How often
One to three flights a fall
Season
October to December
Counted at
  • Green Bay, west transects
  • Green Bay, middle transects
  • Green Bay, east transects
Earlier seasons

Central Valley Midwinter Waterfowl Survey

California Department of Fish and Wildlife, Waterfowl Unit (with USFWS and the Central Valley Joint Venture) · California

Last published midwinter survey, January 2024
6,015,277 ducks, 161,457 mallards
2,581,153 northern pintail, the most abundant duck (39% of total birds)
In the agency’s words, and the survey
An estimate of 6.02 million ducks and 6.620 million total birds (i.e., ducks, coots, and cranes) were estimated across the entire Central Valley Joint Venture planning area. Most waterfowl were observed in the Sacramento Valley (49%), followed by Yolo-Delta (40%)
California Department of Fish and Wildlife, Waterfowl Unit (with USFWS and the Central Valley Joint Venture), January 2024. Read it at the source

Ducks, coots and sandhill cranes wintering in the Central Valley, by species and region, from aerial transects each January

How often
Once a year: conducted in the first or second week of January and continues until complete, or until 30 January
Season
January to January
The usual peak
January: the survey window ensures all waterfowl have arrived from northern latitudes and densities are at their peak
Long term
total waterfowl survey average 4.714 million, from the five standardized years 2016, 2017, 2018, 2020 and 2023
Counted at
Sacramento Valley, Yolo-Delta, Tulare Basin, San Joaquin Valley, Suisun Marsh, Salton Sea, San Francisco Bay
Earlier seasons

Central Flyway Mid-Winter Waterfowl Survey

Colorado Parks and Wildlife with the U.S. Fish and Wildlife Service (Central Flyway Mid-Winter Survey) · Colorado

Last published midwinter survey, January 2024
139,961 ducks, 116,654 mallards
In the agency’s words, and the survey
JANUARY 2024 MID-WINTER WATERFOWL SURVEY - CENTRAL FLYWAY: SPECIES ND MT SD WY CO NE KS OK NM TX TOTAL / Mallard 43,807 66,682 34,308 15,306 116,654 16,115 479,045 64,436 9,065 246,830 1,092,248 / Total Ducks 44,716 66,682 38,990 17,648 139,961 21,402 600,483 123,572 40,874 2,514,143 3,608,471
Colorado Parks and Wildlife with the U.S. Fish and Wildlife Service (Central Flyway Mid-Winter Survey), January 2024. Read it at the source

Ducks and geese counted across Colorado by aerial and ground crews once each January, by species

How often
Once a year, in early January
Season
January to January
Earlier seasons

Central Flyway Mid-Winter Waterfowl Survey

Kansas Department of Wildlife and Parks with the U.S. Fish and Wildlife Service (Central Flyway Mid-Winter Survey) · Kansas

Last published midwinter survey, January 2024
600,483 ducks, 479,045 mallards
31,973 mergansers
In the agency’s words, and the survey
JANUARY 2024 MID-WINTER WATERFOWL SURVEY - CENTRAL FLYWAY: SPECIES ND MT SD WY CO NE KS OK NM TX TOTAL / Mallard 43,807 66,682 34,308 15,306 116,654 16,115 479,045 64,436 9,065 246,830 1,092,248 / Total Ducks 44,716 66,682 38,990 17,648 139,961 21,402 600,483 123,572 40,874 2,514,143 3,608,471
Kansas Department of Wildlife and Parks with the U.S. Fish and Wildlife Service (Central Flyway Mid-Winter Survey), January 2024. Read it at the source

Ducks and geese counted across Kansas by aerial and ground crews once each January, by species

How often
Once a year, in early January
Season
January to January
Earlier seasons

Central Flyway Mid-Winter Waterfowl Survey

Nebraska Game and Parks Commission with the U.S. Fish and Wildlife Service (Central Flyway Mid-Winter Survey) · Nebraska

Last published midwinter survey, January 2024
21,402 ducks, 16,115 mallards
In the agency’s words, and the survey
JANUARY 2024 MID-WINTER WATERFOWL SURVEY - CENTRAL FLYWAY: SPECIES ND MT SD WY CO NE KS OK NM TX TOTAL / Mallard 43,807 66,682 34,308 15,306 116,654 16,115 479,045 64,436 9,065 246,830 1,092,248 / Total Ducks 44,716 66,682 38,990 17,648 139,961 21,402 600,483 123,572 40,874 2,514,143 3,608,471
Nebraska Game and Parks Commission with the U.S. Fish and Wildlife Service (Central Flyway Mid-Winter Survey), January 2024. Read it at the source

Ducks and geese counted across Nebraska by aerial and ground crews once each January, by species

How often
Once a year, in early January
Season
January to January
Earlier seasons

Central Flyway Mid-Winter Waterfowl Survey

New Mexico Department of Game and Fish with the U.S. Fish and Wildlife Service (Central Flyway Mid-Winter Survey) · New Mexico

Last published midwinter survey, January 2024
40,874 ducks, 9,065 mallards
7,788 pintails and 6,925 wigeon
In the agency’s words, and the survey
JANUARY 2024 MID-WINTER WATERFOWL SURVEY - CENTRAL FLYWAY: SPECIES ND MT SD WY CO NE KS OK NM TX TOTAL / Mallard 43,807 66,682 34,308 15,306 116,654 16,115 479,045 64,436 9,065 246,830 1,092,248 / Total Ducks 44,716 66,682 38,990 17,648 139,961 21,402 600,483 123,572 40,874 2,514,143 3,608,471
New Mexico Department of Game and Fish with the U.S. Fish and Wildlife Service (Central Flyway Mid-Winter Survey), January 2024. Read it at the source

Ducks and geese counted across New Mexico by aerial and ground crews once each January, by species

How often
Once a year, in early January
Season
January to January
Earlier seasons

Central Flyway Mid-Winter Waterfowl Survey

South Dakota Game, Fish and Parks with the U.S. Fish and Wildlife Service (Central Flyway Mid-Winter Survey) · South Dakota

Last published midwinter survey, January 2024
38,990 ducks, 34,308 mallards
4,275 mergansers
In the agency’s words, and the survey
JANUARY 2024 MID-WINTER WATERFOWL SURVEY - CENTRAL FLYWAY: SPECIES ND MT SD WY CO NE KS OK NM TX TOTAL / Mallard 43,807 66,682 34,308 15,306 116,654 16,115 479,045 64,436 9,065 246,830 1,092,248 / Total Ducks 44,716 66,682 38,990 17,648 139,961 21,402 600,483 123,572 40,874 2,514,143 3,608,471
South Dakota Game, Fish and Parks with the U.S. Fish and Wildlife Service (Central Flyway Mid-Winter Survey), January 2024. Read it at the source

Ducks and geese counted across South Dakota by aerial and ground crews once each January, by species

How often
Once a year, in early January
Season
January to January
Earlier seasons

Central Flyway Mid-Winter Waterfowl Survey

Texas Parks and Wildlife Department with the U.S. Fish and Wildlife Service (Central Flyway Mid-Winter Survey) · Texas

Last published midwinter survey, January 2024
2,514,143 ducks, 246,830 mallards
400,316 green-winged teal, 334,706 redheads and 303,846 pintails
In the agency’s words, and the survey
JANUARY 2024 MID-WINTER WATERFOWL SURVEY - CENTRAL FLYWAY: SPECIES ND MT SD WY CO NE KS OK NM TX TOTAL / Mallard 43,807 66,682 34,308 15,306 116,654 16,115 479,045 64,436 9,065 246,830 1,092,248 / Total Ducks 44,716 66,682 38,990 17,648 139,961 21,402 600,483 123,572 40,874 2,514,143 3,608,471
Texas Parks and Wildlife Department with the U.S. Fish and Wildlife Service (Central Flyway Mid-Winter Survey), January 2024. Read it at the source

Ducks and geese counted across Texas by aerial and ground crews once each January, by species

How often
Once a year, in early January
Season
January to January
Earlier seasons

Sacramento NWR Complex Waterfowl Survey Summary

U.S. Fish and Wildlife Service, Sacramento National Wildlife Refuge Complex · California

Newest published count, September 2022
103,904 ducks, 5,757 mallards
66,713 northern pintail
In the agency’s words, and the survey
September - Sacramento NWR Complex Waterfowl Survey Summary ... # Mallard 3,730 1,370 536 6 50 65 5,757 # Northern pintail 35,850 15,300 13,738 0 1,800 25 66,713 ... TOTAL # DUCKS 61,430 24,430 15,806 6 2,140 0 103,904
U.S. Fish and Wildlife Service, Sacramento National Wildlife Refuge Complex, September 2022. Read it at the source

Ducks, geese, swans and cranes on the Sacramento Valley refuges and two wildlife management areas, by species and refuge, from monthly ground counts

How often
Once a month, mid-month, on all wetland refuges of the complex
Counted at
Sacramento NWR, Delevan NWR, Colusa NWR, Sutter NWR, Butte Sink Unit of Butte Sink WMA, Llano Seco Unit of Steve Thompson North Central Valley WMA
Who comes when

Duck species by week across the United States

Each row is one species’ share of bird observations by week from August to July, darkest at its high point, from research grade iNaturalist observations 2016 to 2025. Blue-winged teal climb first across the United States, from around the week of Aug 24; common goldeneye come last, from around the week of Nov 16. The last column is the week each species first comes four fifths of the way from its July level to its August to December high. Mallards and wood ducks nest across much of the country, so their rows are already dark in August and show no fall rise.

SpeciesAugSepOctNovDecJanFebMarAprMayJunJulUsual fall high
Mallarddabblingno fall rise; as common in summer
Green-winged tealdabblingweek of Oct 26holds into winter
Blue-winged tealdabblingweek of Sep 7holds into winter
Northern pintaildabblingweek of Nov 9holds into winter
American wigeondabblingweek of Nov 2holds into winter
Gadwalldabblingweek of Nov 2holds into winter
Wood duckdabblingno fall rise; as common in summer
Canvasbackdivingweek of Nov 30holds into winter
Redheaddivingweek of Nov 9holds into winter
Lesser scaupdivingweek of Nov 23holds into winter
Greater scaupdivingweek of Dec 14holds into winter
Ring-necked duckdivingweek of Nov 9holds into winter
Buffleheaddivingweek of Nov 9holds into winter
Common goldeneyedivingweek of Nov 30holds into winter
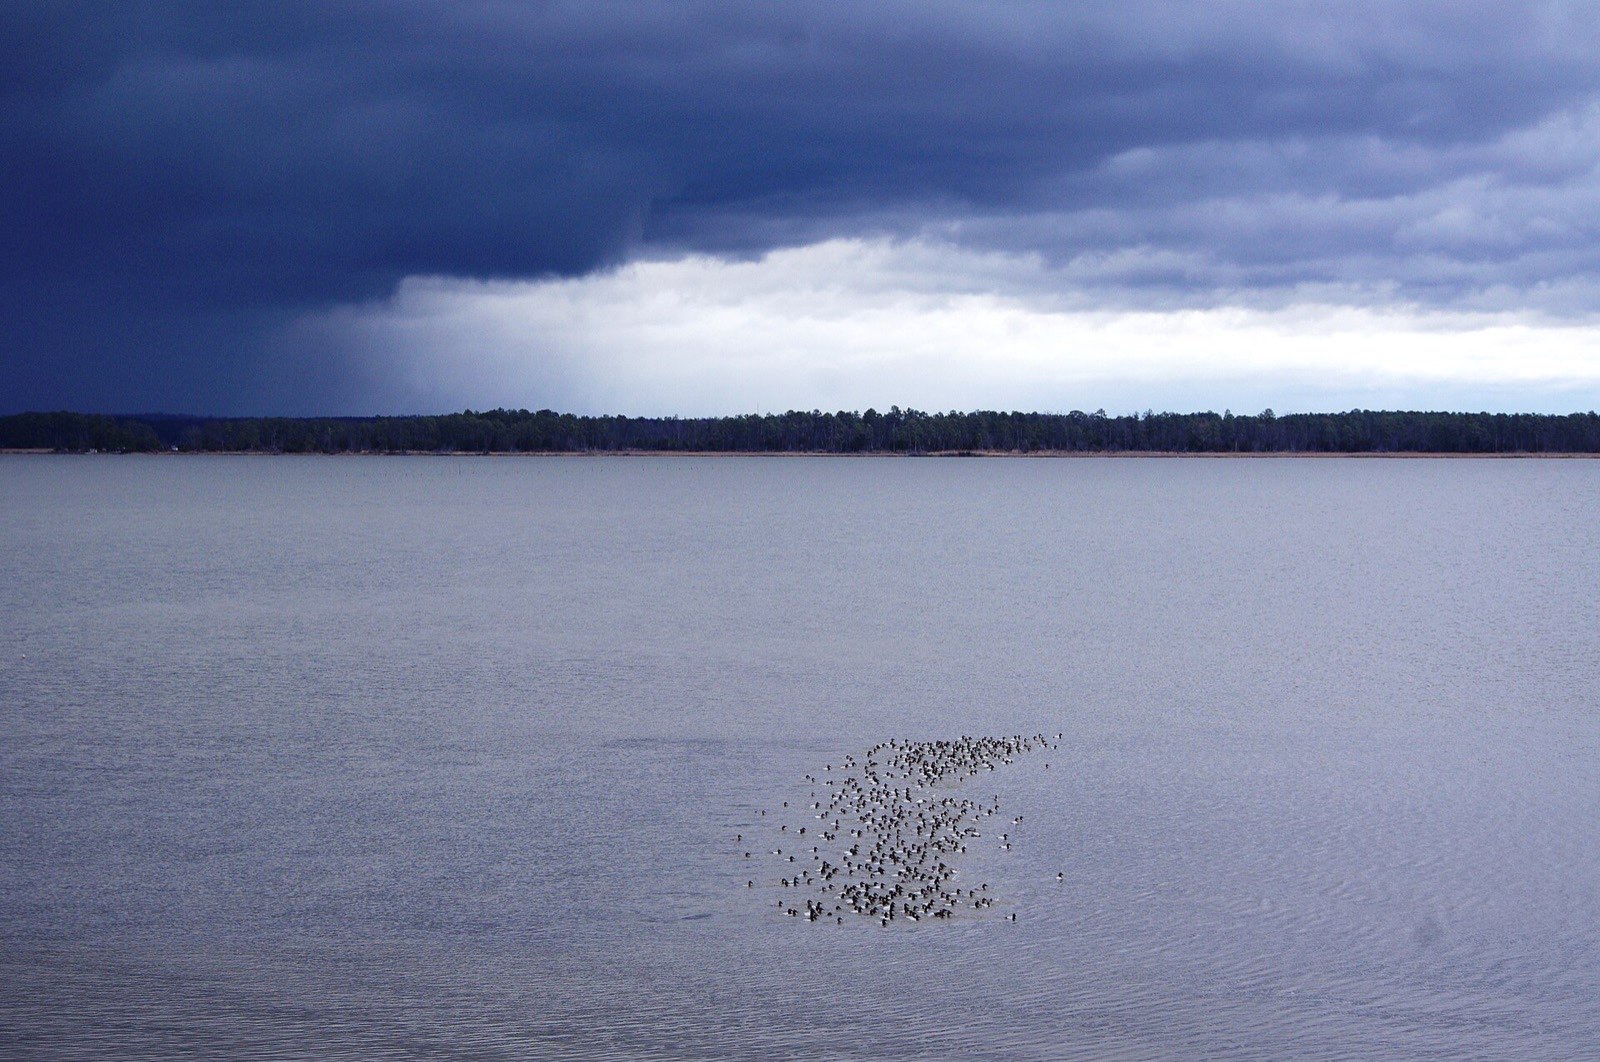
A tight raft of a few hundred canvasbacks on a wide grey river under a dark storm cloud, a line of pines on the far shore
A canvasback raft on the York River in Virginia. Diving ducks come late and gather on big open water, so their counts climb after the dabblers have peaked. “YR Canvasback Raft (15821806304)”, Virginia State Parks, CC BY 2.0 (licence)
The fall flight’s starting point

How many ducks were raised up north this spring

Every May, U.S. Fish and Wildlife Service and Canadian crews fly the breeding grounds from the prairies to Alaska. The estimate is what every state’s fall flight is drawn from.

33.4 million
breeding ducks, 2026: 6% below the long-term average of 35.4 ± 0.09 million
5.9 million
mallards: 26% below the long-term average of 7.9 ± 0.04 million
4.8 million
May ponds in prairie Canada and the north central U.S.
Species2026 estimateAgainst the long term average
Gadwall2.4 ± 0.1 million13% above their long-term average of 2.1 ± 0.02 million
American wigeon2.9 ± 0.2 millionsimilar to the long-term average
Green-winged teal2.3 ± 0.1 millionsimilar to the long-term average
Blue-winged teal4.0 ± 0.2 million22% below the long-term average of 5.1 ± 0.04 million
Northern shoveler3.3 ± 0.2 million24% above their long-term average of 2.6 ± 0.02 million
Northern pintail2.0 ± 0.1 million48% below the long-term average of 3.8 ± 0.03 million
Redhead0.9 ± 0.08 million26% above their long-term average of 0.7 ± 0.01 million
Canvasback0.8 ± 0.07 million32% above their long-term average of 0.6 ± 0.01 million
Scaup (lesser and greater)4.2 ± 0.2 million15% lower than the long-term average of 4.9 ± 0.04 million
the total duck population estimate (excluding scoters ...) was 33.4 ± 0.6 million birds. This estimate was similar to the 2025 estimate and 6% below the long-term average of 35.4 ± 0.09 million.
U.S. Fish and Wildlife Service, Waterfowl Population Status, 2026. Read it at the source
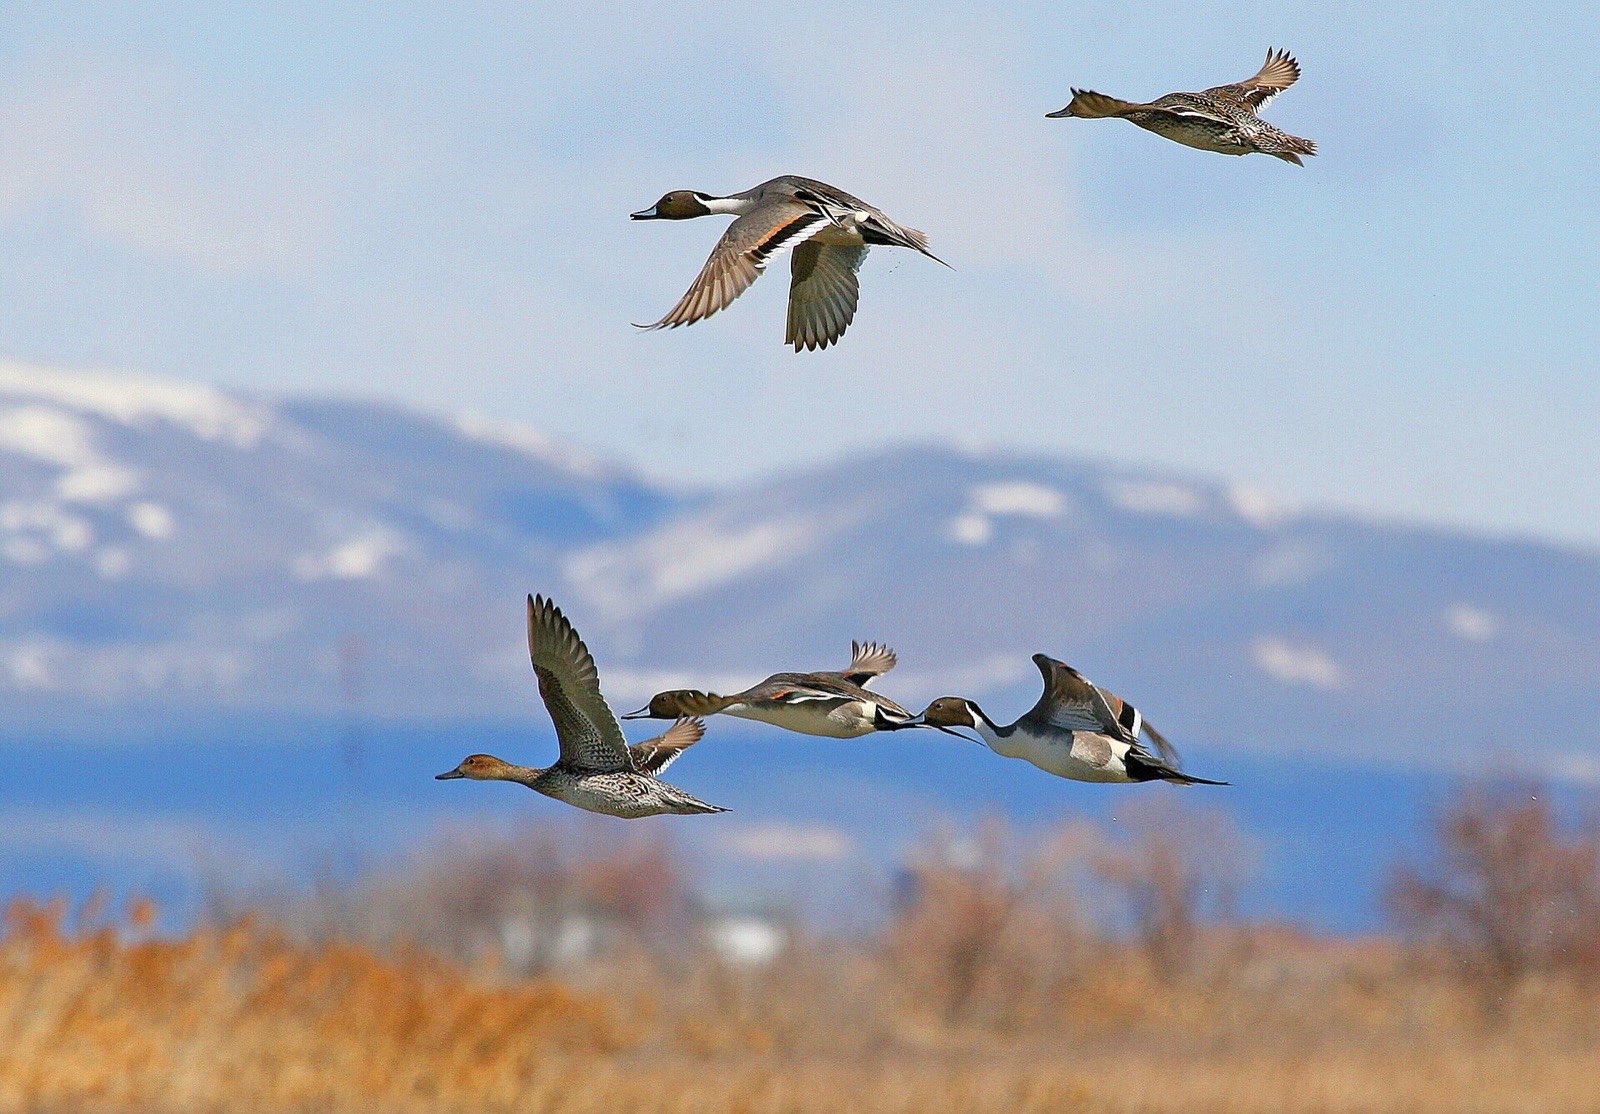
Five northern pintails, drakes and hens, flying low over golden marsh grass with snow streaked mountains behind
Northern pintails over Bear River Migratory Bird Refuge in Utah. The 2026 breeding survey put pintails at 2.0 million, the furthest below its long term average of any species it reports. “Northern Pintails in Flight (5197275166)”, USFWS Mountain-Prairie (J. Kelly), Public domain
What pushes ducks south

Ice on the shallow water

Dabbling ducks feed in shallow marsh and flooded fields, and when those lock up they move to open water further south. A strong cold front with north wind behind it is usually what starts the move, which is why the freeze watch reads the forecast at the staging areas on each flyway: the Atlantic Flyway, the Mississippi Flyway, the Central Flyway and the Pacific Flyway. In the agencies’ own words:

Mallard numbers then begin a decline through mid- to late December as the shallow water habitats on these areas freeze up
Missouri Department of Conservation. Read it at the source
Throughout the season, waterfowl have been widely dispersed across available water rather than concentrated in large numbers, reflecting both limited habitat availability and the lack of sustained cold weather to drive major movements.
Kentucky Department of Fish and Wildlife Resources. Read it at the source
Lake is 0.3 foot above normal, bird numbers currently fair, hunting pressure increasing. With recent cold front, birds numbers are on the rise.
Oklahoma Department of Wildlife Conservation (Hugo WMA status report, Dec 31 2025). Read it at the source
Overall, higher Canada goose and diving duck numbers likely reflect the cold weather experienced by the northeast and mid-Atlantic regions during December and January.
Maryland Department of Natural Resources (2026 midwinter waterfowl survey). Read it at the source
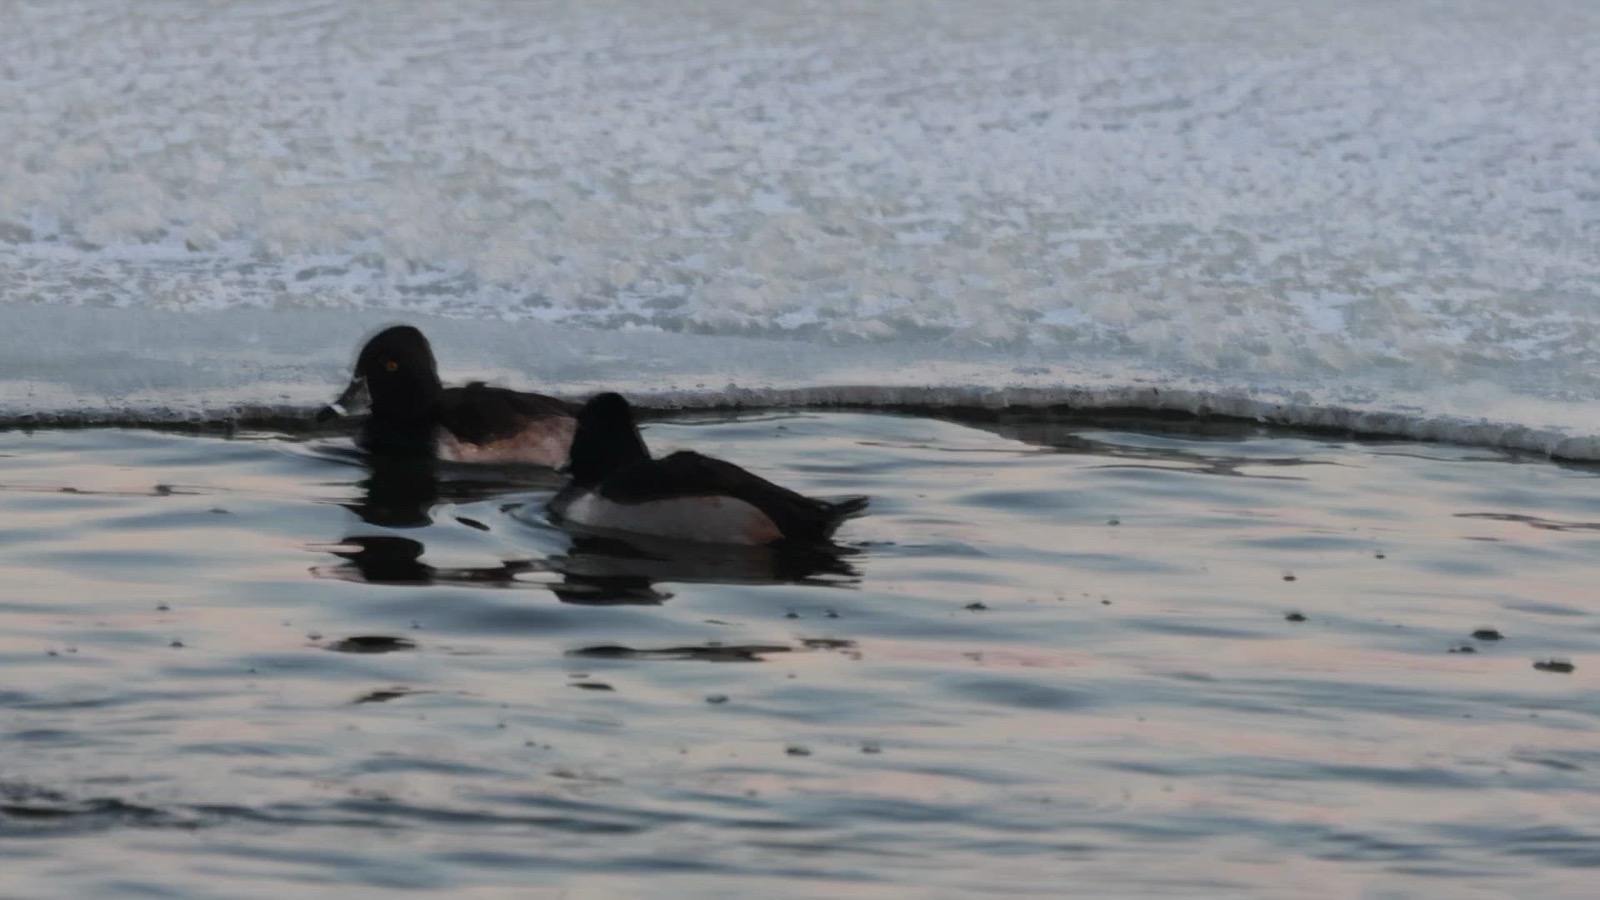
Two ring-necked ducks swimming in dark open water along the edge of a sheet of ice
Ring-necked ducks on the open water left at the ice edge, Lake Andes National Wildlife Refuge, South Dakota. When the shallow pools lock up, the birds that feed in them have to move. “Ring-Necked Duck in Winter Lake Andes National Wildlife Refuge South Dakota (54202161621)”, USFWS Mountain-Prairie (Liz Julian), Public domain
By state

Duck migration in every state

StateFlywayUsual fall high in observationsNewest agency count
AlabamaMississippiWeek of Nov 911,237 ducks, 1,766 mallards, February 17, 2026
AlaskaPacificWeek of Sep 21Nearest counts on the Alaska page
ArizonaPacificWeek of Nov 16Nearest counts on the Arizona page
ArkansasMississippiWeek of Nov 16694,286 ducks, 337,479 mallards, January 2026
CaliforniaPacificWeek of Nov 166,015,277 ducks, 161,457 mallards, January 2024
ColoradoCentralWeek of Nov 9139,961 ducks, 116,654 mallards, January 2024
ConnecticutAtlanticWeek of Dec 14Nearest, in Maryland (about 280 miles): 469 ducks, 62 mallards, March 19, 2026
DelawareAtlanticWeek of Nov 259,709 ducks, 18,363 mallards, added up from the published species counts, January 2026
FloridaAtlanticWeek of Nov 23Nearest counts on the Florida page
GeorgiaAtlanticWeek of Nov 30Nearest counts on the Georgia page
HawaiiPacificWeek of Oct 19Nearest counts on the Hawaii page
IdahoPacificWeek of Nov 16Nearest, in Oregon (about 300 miles): 31,865 ducks, October 7, 2026
IllinoisMississippiWeek of Dec 1411,915 ducks, 810 mallards, September 23, 2026
IndianaMississippiWeek of Oct 26Nearest, in Illinois (about 150 miles): 11,915 ducks, 810 mallards, September 23, 2026
IowaMississippiWeek of Nov 230,390 ducks, October 2, 2026
KansasCentralWeek of Oct 2618 ducks, 1 mallard, added up from the published species counts, September 18, 2026
KentuckyMississippiWeek of Nov 912,441 ducks, 9,513 mallards, February 10, 2026
LouisianaMississippiWeek of Nov 302,458,000 ducks, the highest published count, January 2026
MaineAtlanticWeek of Dec 14Nearest counts on the Maine page
MarylandAtlanticWeek of Nov 23469 ducks, 62 mallards, March 19, 2026
MassachusettsAtlanticWeek of Nov 9Nearest, in Maryland (about 350 miles): 469 ducks, 62 mallards, March 19, 2026
MichiganMississippiWeek of Nov 21,265 ducks, 750 mallards, the week ending October 4, 2026
MinnesotaMississippiWeek of Oct 19Nearest, in Iowa (about 290 miles): 30,390 ducks, October 2, 2026
MississippiMississippiWeek of Nov 16603,165 ducks, 140,042 mallards, January 2026
MissouriMississippiWeek of Nov 165,872 ducks, no mallards, October 6, 2026
MontanaCentralWeek of Nov 9Nearest counts on the Montana page
NebraskaCentralWeek of Oct 2621,402 ducks, 16,115 mallards, January 2024
NevadaPacificWeek of Nov 9Nearest, in Oregon (about 380 miles): 31,865 ducks, October 7, 2026
New HampshireAtlanticNo fall riseNearest, in Maryland (about 420 miles): 469 ducks, 62 mallards, March 19, 2026
New JerseyAtlanticWeek of Nov 9Nearest, in Maryland (about 140 miles): 469 ducks, 62 mallards, March 19, 2026
New MexicoCentralWeek of Nov 240,874 ducks, 9,065 mallards, January 2024
New YorkAtlanticWeek of Nov 9Nearest, in Maryland (about 280 miles): 469 ducks, 62 mallards, March 19, 2026
North CarolinaAtlanticWeek of Nov 23217,264 dabbling ducks and 45,097 diving ducks, 9,474 mallards, January 6, 2026
North DakotaCentralWeek of Oct 26Nearest counts on the North Dakota page
OhioMississippiWeek of Nov 290,197 ducks, 26,583 mallards, November 2025
OklahomaCentralWeek of Nov 98,452 ducks, 781 mallards, February 3, 2026
OregonPacificWeek of Nov 931,865 ducks, October 7, 2026
PennsylvaniaAtlanticWeek of Nov 9Nearest, in Maryland (about 140 miles): 469 ducks, 62 mallards, March 19, 2026
Rhode IslandAtlanticWeek of Dec 14Nearest, in Maryland (about 340 miles): 469 ducks, 62 mallards, March 19, 2026
South CarolinaAtlanticWeek of Dec 1453,889 ducks, 124 mallards, added up from the published species counts, January 2026
South DakotaCentralWeek of Nov 238,990 ducks, 34,308 mallards, January 2024
TennesseeMississippiWeek of Nov 16597 ducks, 200 mallards, February 27, 2026
TexasCentralWeek of Nov 162,514,143 ducks, 246,830 mallards, January 2024
UtahPacificWeek of Nov 2Nearest counts on the Utah page
VermontAtlanticNo fall riseNearest, in Maryland (about 410 miles): 469 ducks, 62 mallards, March 19, 2026
VirginiaAtlanticWeek of Nov 9Nearest, in Maryland (about 150 miles): 469 ducks, 62 mallards, March 19, 2026
WashingtonPacificWeek of Dec 7Nearest, in Oregon (about 240 miles): 31,865 ducks, October 7, 2026
West VirginiaAtlanticWeek of Nov 2Nearest, in Maryland (about 210 miles): 469 ducks, 62 mallards, March 19, 2026
WisconsinMississippiWeek of Oct 19415 mallards, December 9, 2024
WyomingCentralWeek of Nov 9Nearest counts on the Wyoming page

Duck migration questions

Advertisement

More for the season

Agency counts read up to October 8, 2026, each from the page linked on its card, and the agency’s own report is the one that governs. Observation curves from iNaturalist research grade records 2016 to 2025; this week’s figures and the forecast lows are read when the page opens.