Skip to content
Mississippi Flyway

Kentucky Duck Migration Report 2026

Duck observations in Kentucky usually climb from the week of Oct 26 and reach their fall high around the week of Nov 9; they stay above the halfway mark between their July level and that high through the week of Nov 30.

Week of Nov 9
Usual fall high in observations
2016 to 2025
Week of Oct 26
Usually climbing from
halfway up from the July level
1
Agency survey
listed below
Mississippi
Flyway
freeze watch below
The agency counts

Where ducks are counted in Kentucky

Midwinter survey

Kentucky Waterfowl Ground Counts (Periodic Waterfowl Surveys and Ground Counts)

Kentucky Department of Fish and Wildlife Resources

Last published midwinter survey, February 2026
12,441 ducks
9,513 of them mallards
2026 midwinter aerial survey of the Western Kentucky Purchase Region, January 5, 2026: 33,240 ducks, 17,982 of them on Ballard WMA, with 45,000 snow and blue geese there
In the agency’s words
Sloughs WMA 02/10/2026 | 12441 total | 9513 Mallard | 1307 Misc Dabblers | 1121 Pintail | 500 GW teal | Mallard 76%
Kentucky Department of Fish and Wildlife Resources, February 10, 2026. Read it at the source

Ducks and geese by species on Kentucky's waterfowl WMAs, counted from the ground each week of the season, plus the January Mid-Winter aerial survey

How often
Weekly reports during the season (Waterfowl Ground Counts, Nov. 21, 2025 - Feb. 13, 2026); Mid-Winter Waterfowl Aerial Survey each January
Season
November to February
Counted at
Ballard WMA, Boatwright WMA, Sloughs WMA, Doug Travis WMA, Duck Island WMA, Peabody WMA, Yellowbank WMA, Barren River Lake WMA, and 7 more

The nearest other counts on the Mississippi Flyway

2026 fall count

INHS Waterfowl Aerial Inventory, Illinois River

Illinois Natural History Survey (Forbes Biological Station) · Illinois · about 270 miles from Kentucky

Counted September 23, 2026
11,915 ducks
810 of them mallards
The 10-year average (2016 to 2025) for this flight is 38,604 ducks
In the agency’s words
TOTAL ILLINOIS 810 0 3,575 4,020 2,210 85 45 1,170 0 0 0 0 0 0 0 0 0 11,915 ... 10-Year Average 1,749 0 11,562 7,709 13,051 216 589 3,675 0 0 0 0 20 0 0 0 0 38,604 ... 2016-2025
Illinois Natural History Survey (Forbes Biological Station), September 23, 2026. Read it at the source

Ducks, geese and other waterbirds at 23 sites on the Illinois River from Hennepin to Grafton, by species, from the air

How often
Weekly from September through early January
Season
September to January
The usual peak
mid November (the highest 10-year average in the 2025 sheets is 365,157 ducks for the 11/13 flight)
Highest published count
473,135 ducks, November 2025
Long term
10-year average for 2016 to 2025, printed under each weekly total (for example 365,157 ducks for November 13, 2025 and 270,066 for November 28, 2025)
Counted at
Hennepin/Hopper, Goose Lake, Senachwine Lake, Hitchcock Slough, Douglas Lake, Upper Peoria, Powerton, Rice Lake, and 14 more
2026 fall count

Loess Bluffs National Wildlife Refuge Monthly Habitat, Waterfowl and Eagle Survey Report

U.S. Fish and Wildlife Service (Loess Bluffs National Wildlife Refuge, formerly Squaw Creek) · Missouri · about 400 miles from Kentucky

Counted October 6, 2026
5,872 ducks
No mallards among them
3,932 blue-winged teal and 1,760 northern pintail
In the agency’s words
All Ducks 481 661 6,783 5,872 (weeks of 09/15/2026, 09/22/2026, 09/29/2026, 10/06/2026)
U.S. Fish and Wildlife Service (Loess Bluffs National Wildlife Refuge, formerly Squaw Creek), October 6, 2026. Read it at the source

Ducks, geese, swans and bald eagles on the refuge's wetlands in northwest Missouri, by species, with acres flooded and percent frozen

How often
Weekly surveys are completed by refuge staff from fall through spring migration.
Season
September to March
Highest published count
139,386 ducks, November 2025
Counted at
  • Loess Bluffs National Wildlife Refuge, Forest City, MO
Advertisement
Observations this week

Kentucky against a normal year

Observations this week in Kentucky

Duck observations here usually reach their fall high around the week of Nov 9. Counting this week’s research grade observations.

Observations this week in the Mississippi Flyway

Duck observations here usually reach their fall high around the week of Nov 2. Counting this week’s research grade observations.

Which ducks come through Kentucky, and when

Each row is one species’ share of Kentucky bird observations by week from August to July, darkest at its high point, from research grade iNaturalist observations 2016 to 2025. The last column is the week each species first comes four fifths of the way from its July level to its August to December high.

SpeciesAugSepOctNovDecJanFebMarAprMayJunJulUsual fall high
Mallarddabblingweek of Nov 16
Green-winged tealdabblingtoo few fall records
Blue-winged tealdabblingtoo few fall records
Northern pintaildabblingtoo few fall records
Gadwalldabblingweek of Nov 9
Wood duckdabblingno fall rise; as common in summer
Redheaddivingtoo few fall records
Lesser scaupdivingtoo few fall records
Ring-necked duckdivingweek of Nov 16
Buffleheaddivingweek of Nov 9
Common goldeneyedivingweek of Nov 30
What moves the birds

Freeze watch up the Mississippi Flyway

When the shallow water at the northern staging areas locks up, dabbling ducks move south to open water. These are the National Weather Service seven day forecast lows there, with nights at or below 28°F marked.

Freeze watch on the Mississippi Flyway

Reading the seven day forecast lows at Bemidji, Fergus Falls, Green Bay, Alpena, Saginaw Bay.

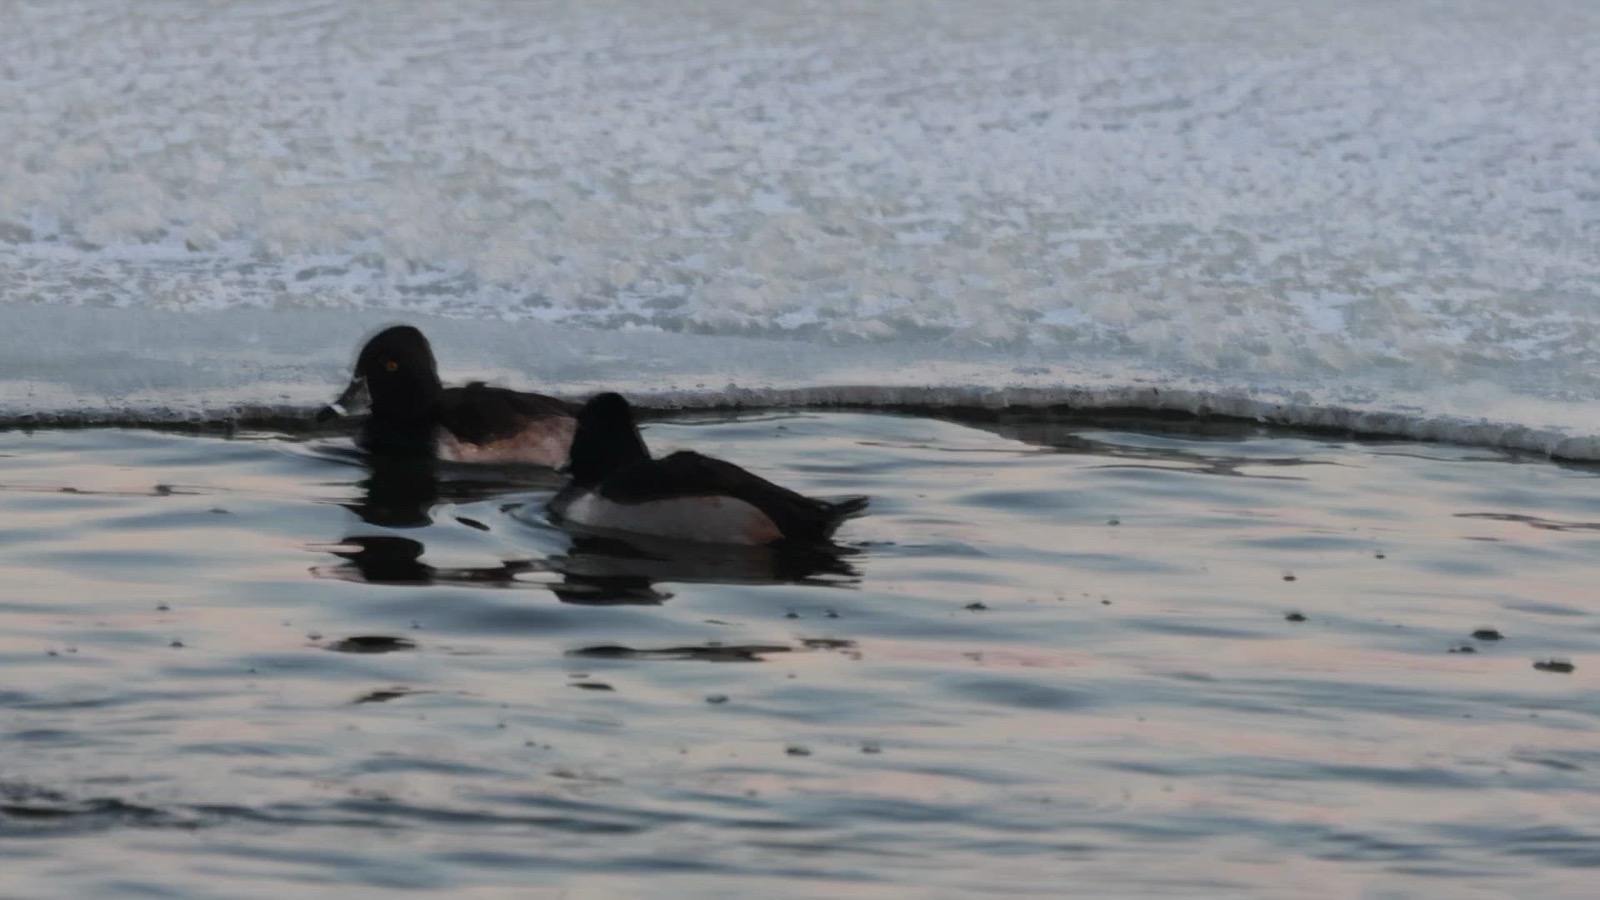
Two ring-necked ducks swimming in dark open water along the edge of a sheet of ice
Ring-necked ducks on the open water left at the ice edge, Lake Andes National Wildlife Refuge, South Dakota. When the shallow pools lock up, the birds that feed in them have to move. “Ring-Necked Duck in Winter Lake Andes National Wildlife Refuge South Dakota (54202161621)”, USFWS Mountain-Prairie (Liz Julian), Public domain

Kentucky duck migration questions

Advertisement

Duck migration in other states

Agency counts read up to October 8, 2026, each from the page linked on its card, and the agency’s own report is the one that governs. Observation curves from iNaturalist research grade records 2016 to 2025; this week’s figures and the forecast lows are read when the page opens. Every state is on the duck migration report.