Skip to content
Pacific Flyway

California Duck Migration Report 2026

Duck observations in California usually climb from the week of Nov 2 and reach their fall high around the week of Nov 16, and the share stays that high into January; they stay above the halfway mark between their July level and that high through the week of Mar 16.

Week of Nov 16
Usual fall high in observations
2016 to 2025
Week of Nov 2
Usually climbing from
halfway up from the July level
4
Agency surveys
listed below
Pacific
Flyway
freeze watch below
The agency counts

The nearest counts to California on the Pacific Flyway

The nearest agency counts on the Pacific Flyway are in Oregon (about 470 miles away), measured center to center, so read them as the flyway’s trend rather than a count of California’s own birds.

2026 fall count

Summer Lake Wildlife Area Weekly Waterfowl Counts

Oregon Department of Fish and Wildlife (Summer Lake Wildlife Area) · Oregon · about 470 miles from California

Counted October 7, 2026
31,865 ducks
470 snow and Ross's geese the same week
In the agency’s words
Summer Lake Wildlife Area Weekly Waterfowl Counts Ducks ... 9/22 - 9/28 33,285 ... 9/29 - 10/5 30,700 ... 10/6 - 10/12 31,865 44,802 50,856 97,073 36,057 60,839 59,687 39,728 42,368 42,785 51,879 57,925
Oregon Department of Fish and Wildlife (Summer Lake Wildlife Area), October 7, 2026. Read it at the source

Ducks, geese, swans and coots on the Summer Lake Wildlife Area in south central Oregon, counted each week of the season and set against past years

How often
Weekly, early September to late January
Season
September to January
The usual peak
10/6 - 10/12, the highest week in the Pre 5-Yr average column (57,925 ducks)
Long term
Pre 5-Yr average for 10/6 - 10/12: 57,925 ducks
Counted at
Summer Lake Wildlife Area

Counts from earlier seasons in California

Earlier seasons

Central Valley Midwinter Waterfowl Survey

California Department of Fish and Wildlife, Waterfowl Unit (with USFWS and the Central Valley Joint Venture)

Last published midwinter survey, January 2024
6,015,277 ducks, 161,457 mallards
2,581,153 northern pintail, the most abundant duck (39% of total birds)
In the agency’s words, and the survey
An estimate of 6.02 million ducks and 6.620 million total birds (i.e., ducks, coots, and cranes) were estimated across the entire Central Valley Joint Venture planning area. Most waterfowl were observed in the Sacramento Valley (49%), followed by Yolo-Delta (40%)
California Department of Fish and Wildlife, Waterfowl Unit (with USFWS and the Central Valley Joint Venture), January 2024. Read it at the source

Ducks, coots and sandhill cranes wintering in the Central Valley, by species and region, from aerial transects each January

How often
Once a year: conducted in the first or second week of January and continues until complete, or until 30 January
Season
January to January
The usual peak
January: the survey window ensures all waterfowl have arrived from northern latitudes and densities are at their peak
Long term
total waterfowl survey average 4.714 million, from the five standardized years 2016, 2017, 2018, 2020 and 2023
Counted at
Sacramento Valley, Yolo-Delta, Tulare Basin, San Joaquin Valley, Suisun Marsh, Salton Sea, San Francisco Bay
Earlier seasons

Klamath Basin refuge aerial waterfowl survey (Lower Klamath and Tule Lake NWR)

U.S. Fish and Wildlife Service, Klamath Basin National Wildlife Refuge Complex

High count of the last season flown, March 7, 2025
334,732 ducks
Funding cuts eliminated aerial surveys beginning fall 2025. This marks the end of the nation's longest-running refuge-based aerial waterfowl survey.
U.S. Fish and Wildlife Service, Klamath Basin National Wildlife Refuge Complex. Read it at the source
About the survey

Ducks and geese on Lower Klamath and Tule Lake national wildlife refuges, from the air, during fall and spring migration; ended after the 2024-25 season

How often
Ten aerial surveys between fall 2024 and spring 2025; discontinued from fall 2025
Counted at
Lower Klamath National Wildlife Refuge, Tule Lake National Wildlife Refuge
Earlier seasons

Sacramento NWR Complex Waterfowl Survey Summary

U.S. Fish and Wildlife Service, Sacramento National Wildlife Refuge Complex

Newest published count, September 2022
103,904 ducks, 5,757 mallards
66,713 northern pintail
In the agency’s words, and the survey
September - Sacramento NWR Complex Waterfowl Survey Summary ... # Mallard 3,730 1,370 536 6 50 65 5,757 # Northern pintail 35,850 15,300 13,738 0 1,800 25 66,713 ... TOTAL # DUCKS 61,430 24,430 15,806 6 2,140 0 103,904
U.S. Fish and Wildlife Service, Sacramento National Wildlife Refuge Complex, September 2022. Read it at the source

Ducks, geese, swans and cranes on the Sacramento Valley refuges and two wildlife management areas, by species and refuge, from monthly ground counts

How often
Once a month, mid-month, on all wetland refuges of the complex
Counted at
Sacramento NWR, Delevan NWR, Colusa NWR, Sutter NWR, Butte Sink Unit of Butte Sink WMA, Llano Seco Unit of Steve Thompson North Central Valley WMA
Advertisement
Observations this week

California against a normal year

Observations this week in California

Duck observations here usually reach their fall high around the week of Nov 16. Counting this week’s research grade observations.

Observations this week in the Pacific Flyway

Duck observations here usually reach their fall high around the week of Nov 16. Counting this week’s research grade observations.

Which ducks come through California, and when

Each row is one species’ share of California bird observations by week from August to July, darkest at its high point, from research grade iNaturalist observations 2016 to 2025. The last column is the week each species first comes four fifths of the way from its July level to its August to December high.

SpeciesAugSepOctNovDecJanFebMarAprMayJunJulUsual fall high
Mallarddabblingno fall rise; as common in summer
Green-winged tealdabblingweek of Nov 23holds into winter
Blue-winged tealdabblingweek of Oct 12holds into winter
Northern pintaildabblingweek of Nov 23holds into winter
American wigeondabblingweek of Nov 9holds into winter
Gadwalldabblingweek of Nov 23
Wood duckdabblingno fall rise; as common in summer
Canvasbackdivingweek of Nov 30holds into winter
Redheaddivingweek of Dec 14holds into winter
Lesser scaupdivingweek of Dec 14holds into winter
Greater scaupdivingweek of Dec 7holds into winter
Ring-necked duckdivingweek of Nov 16holds into winter
Buffleheaddivingweek of Nov 16holds into winter
Common goldeneyedivingweek of Nov 23holds into winter
What moves the birds

Freeze watch up the Pacific Flyway

When the shallow water at the northern staging areas locks up, dabbling ducks move south to open water. These are the National Weather Service seven day forecast lows there, with nights at or below 28°F marked.

Freeze watch on the Pacific Flyway

Reading the seven day forecast lows at Freezeout Lake, Klamath Falls.

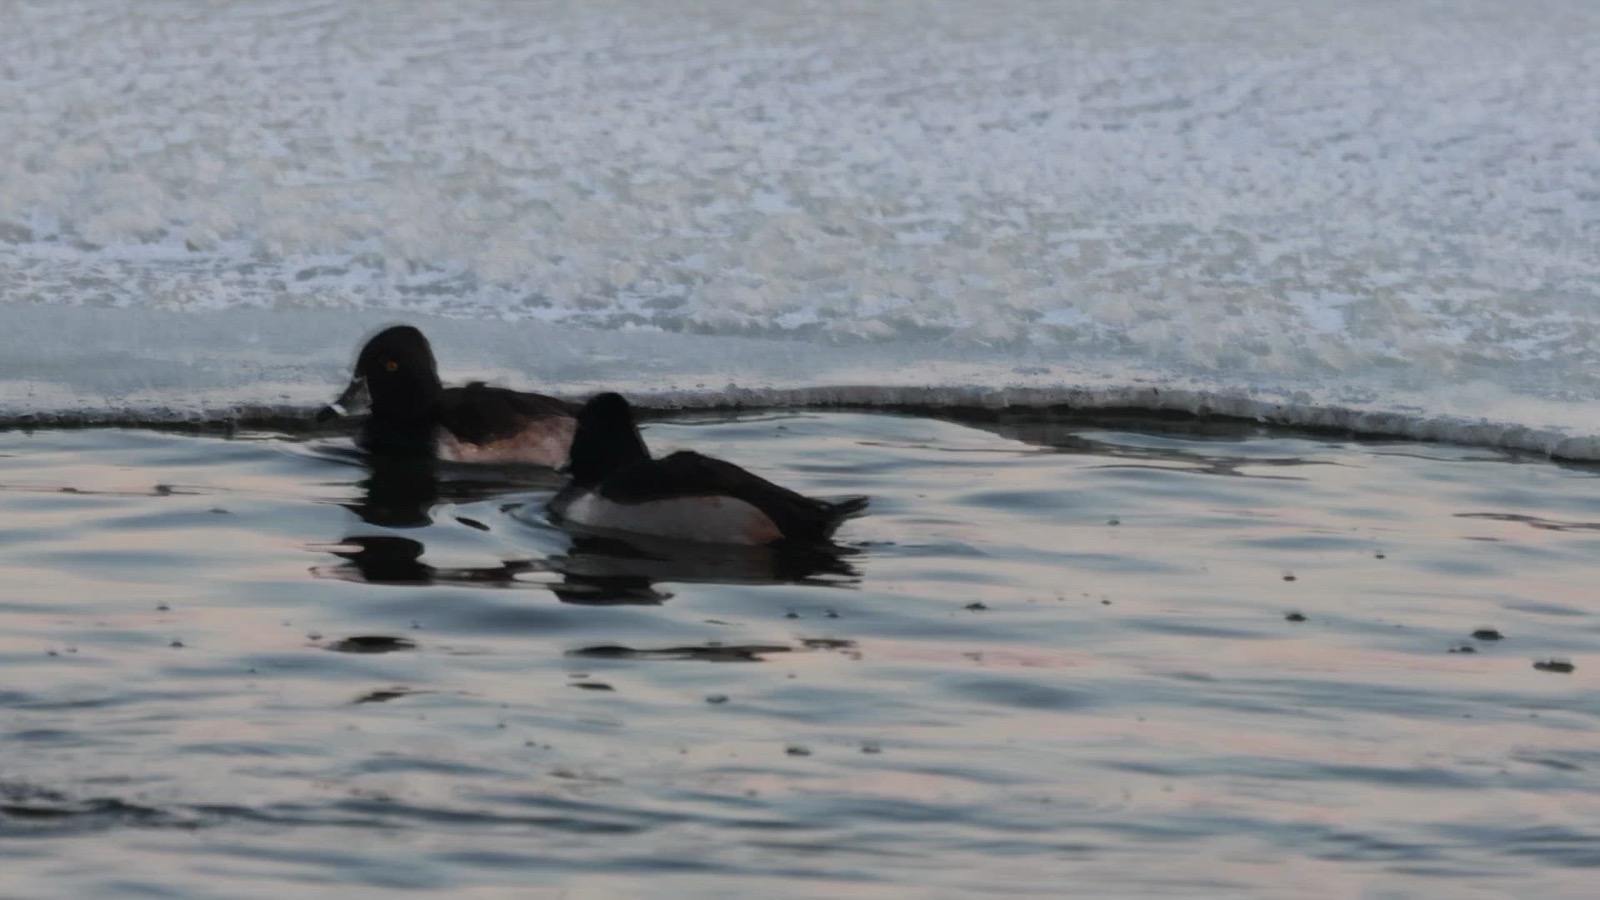
Two ring-necked ducks swimming in dark open water along the edge of a sheet of ice
Ring-necked ducks on the open water left at the ice edge, Lake Andes National Wildlife Refuge, South Dakota. When the shallow pools lock up, the birds that feed in them have to move. “Ring-Necked Duck in Winter Lake Andes National Wildlife Refuge South Dakota (54202161621)”, USFWS Mountain-Prairie (Liz Julian), Public domain
This spring

How many ducks were raised in California this spring

Spring breeding survey

California Waterfowl Breeding Population Survey

California Department of Fish and Wildlife, Waterfowl Unit

Spring breeding survey, May 2026
435,937 ducks
267,101 of them mallards
Gadwalls (Mareca strepera) decreased 44% from 2025 and are 28% below the long-term average.
In the agency’s words
Total breeding ducks in the survey area decreased 10% from 2025 (435,937 ± 42,688) and 18% below LTA (Table 1). The most abundant duck species were mallards (267,101 ± 34,278), gadwall (61,658 ± 17,299), cinnamon teal (39,745 ± 12,979), and northern shoveler (30,335 ± 9,582).
California Department of Fish and Wildlife, Waterfowl Unit, May 2026. Read it at the source

Breeding ducks in the Central Valley and northeastern California, estimated from spring aerial transects; a spring index, not a migration count

How often
Once a year in spring (2026: April 20 to 28 in the Central Valley, May 6 to 7 in northeastern California)
Season
April to May
Long term
Total ducks long-term average 531,886; mallard long-term average 317,819 (long-term average for 1992 to 2025, ducks and coots)

California duck migration questions

Advertisement

Duck migration in other states

Agency counts read up to October 8, 2026, each from the page linked on its card, and the agency’s own report is the one that governs. Observation curves from iNaturalist research grade records 2016 to 2025; this week’s figures and the forecast lows are read when the page opens. Every state is on the duck migration report.