Skip to content
Mississippi Flyway

Minnesota Duck Migration Report 2026

Duck observations in Minnesota usually climb from the week of Oct 12 and reach their fall high around the week of Oct 19; they stay above the halfway mark between their July level and that high through the week of Nov 23.

Week of Oct 19
Usual fall high in observations
2016 to 2025
Week of Oct 12
Usually climbing from
halfway up from the July level
1
Agency survey
listed below
Mississippi
Flyway
freeze watch below
The agency counts

The nearest counts to Minnesota on the Mississippi Flyway

The nearest agency counts on the Mississippi Flyway are in Iowa (about 290 miles away) and Michigan (about 450 miles away), measured center to center, so read them as the flyway’s trend rather than a count of Minnesota’s own birds.

2026 fall count

Fall Migration Waterfowl Survey (Waterfowl Migration Report)

Iowa Department of Natural Resources · Iowa · about 290 miles from Minnesota

Counted October 2, 2026
30,390 ducks
The statewide duck count increased by 33.4% and the Canada goose count increased by 27.2% from last week.
In the agency’s words
Fall Migration Waterfowl Survey Week Ending: October 2, 2026 ... Total 30390 22789 12 88 0 6660 5237 100 0. Blue-winged teal were the most abundant duck followed by wood ducks and mallards. At a statewide scale, observers counted 53.4% more ducks and 37.8% fewer Canada geese than during this week last year.
Iowa Department of Natural Resources, October 2, 2026. Read it at the source

Ducks and geese at about 20 survey sites across Iowa, counted each week of the fall migration, with the duck share split into mallard, other dabblers and divers

How often
Weekly each fall (2026 reports dated September 4, 11, 18, 25 and October 2)
Season
September
Counted at
Bays Branch Areas, Big Marsh, Black Hawk Areas, Coralville Areas, Green Island, Ingham Areas, Lake Odessa Areas, Lake Sugema, and 12 more
2026 fall count

Fish Point SWA waterfowl counts

Michigan Department of Natural Resources (Wetland Wonders managed waterfowl areas) · Michigan · about 450 miles from Minnesota

Week ending September 27, 2026
4,000 ducks
750 of them mallards
750 green-winged teal and 500 northern pintail; first divers of the fall (350, including 200 ring-necked ducks)
In the agency’s words
Week Ending: 09/27/2026 | Total ducks: 4000 | Mallard: 750 | Black duck: 50 | Wood duck: 700 | American wigeon: 250 | Gadwall: 200 | Northern pintail: 500 | Blue-winged teal: 450 | Green-winged teal: 750 | Total dabblers: 3650 | Redhead: 100 | Ring-necked duck: 200 | Scaup: 50 | Total divers: 350
Michigan Department of Natural Resources (Wetland Wonders managed waterfowl areas), the week ending September 27, 2026. Read it at the source

Ducks, geese and swans counted each week on Fish Point State Wildlife Area, a Michigan DNR managed waterfowl area on Saginaw Bay, by species; a fall migration count

How often
Weekly, by week ending date; the 2026 table runs from the week ending September 6, 2026 to the week ending January 24, 2027
Season
September to January
Counted at
Fish Point State Wildlife Area
Advertisement
Observations this week

Minnesota against a normal year

Observations this week in Minnesota

Duck observations here usually reach their fall high around the week of Oct 19. Counting this week’s research grade observations.

Observations this week in the Mississippi Flyway

Duck observations here usually reach their fall high around the week of Nov 2. Counting this week’s research grade observations.

Which ducks come through Minnesota, and when

Each row is one species’ share of Minnesota bird observations by week from August to July, darkest at its high point, from research grade iNaturalist observations 2016 to 2025. The last column is the week each species first comes four fifths of the way from its July level to its August to December high.

SpeciesAugSepOctNovDecJanFebMarAprMayJunJulUsual fall high
Mallarddabblingno fall rise; as common in summer
Green-winged tealdabblingweek of Oct 26
Blue-winged tealdabblingweek of Aug 24
Northern pintaildabblingweek of Oct 19
American wigeondabblingweek of Oct 12
Gadwalldabblingweek of Oct 19
Wood duckdabblingno fall rise; as common in summer
Canvasbackdivingweek of Oct 19
Redheaddivingweek of Oct 19
Lesser scaupdivingweek of Nov 9
Greater scaupdivingtoo few fall records
Ring-necked duckdivingweek of Oct 19
Buffleheaddivingweek of Oct 26
Common goldeneyedivingweek of Nov 23
What moves the birds

Freeze watch up the Mississippi Flyway

When the shallow water at the northern staging areas locks up, dabbling ducks move south to open water. These are the National Weather Service seven day forecast lows there, with nights at or below 28°F marked.

Freeze watch on the Mississippi Flyway

Reading the seven day forecast lows at Bemidji, Fergus Falls, Green Bay, Alpena, Saginaw Bay.

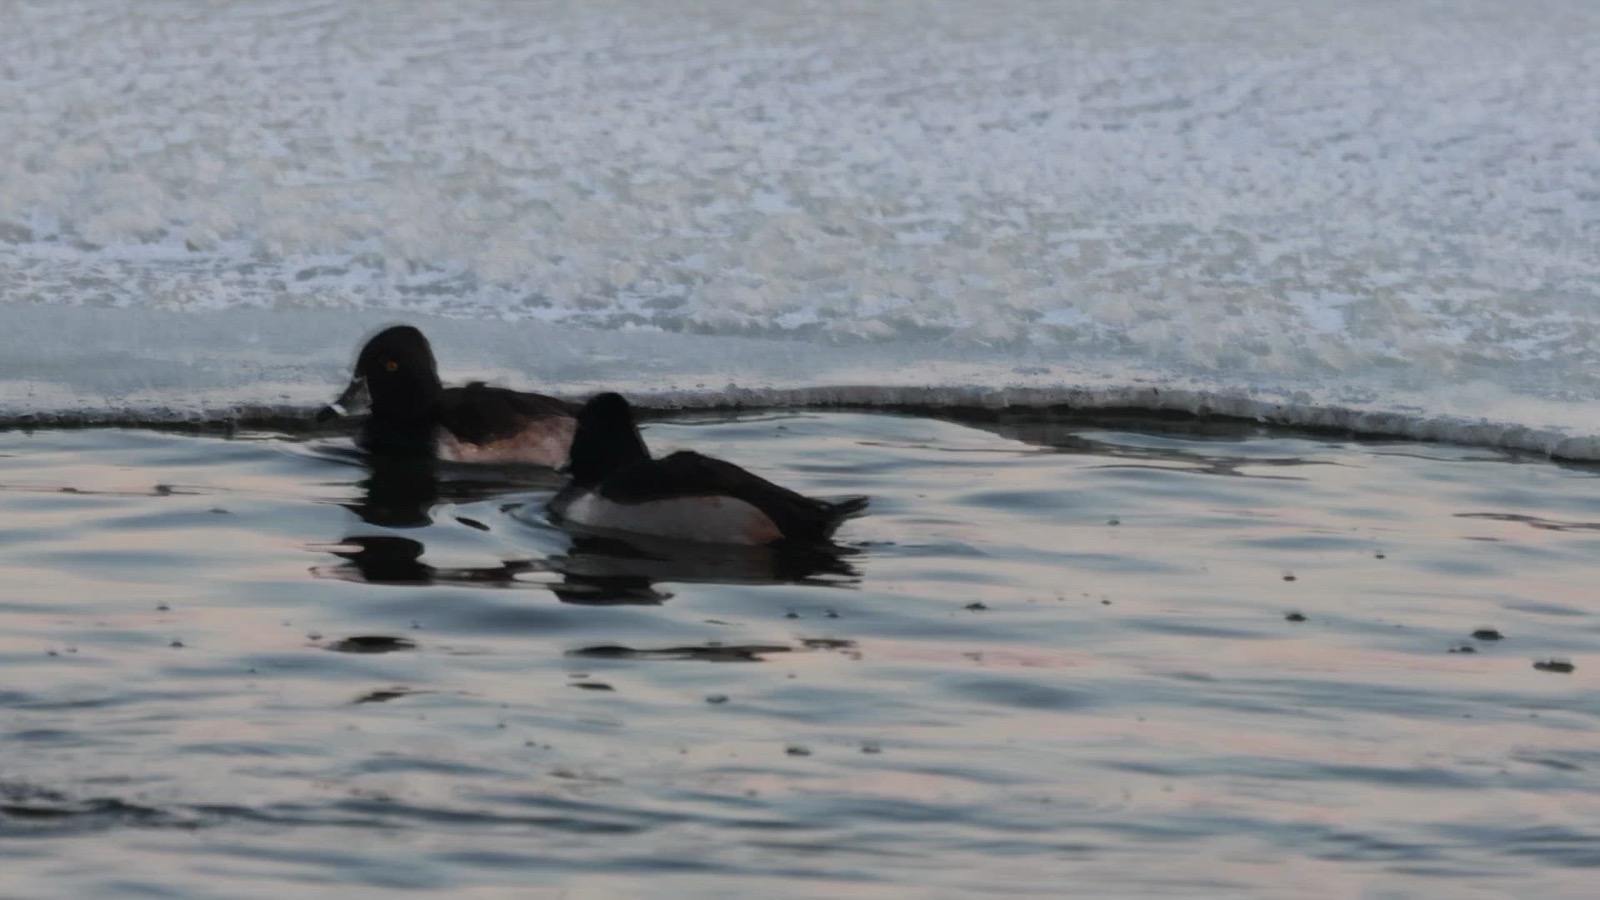
Two ring-necked ducks swimming in dark open water along the edge of a sheet of ice
Ring-necked ducks on the open water left at the ice edge, Lake Andes National Wildlife Refuge, South Dakota. When the shallow pools lock up, the birds that feed in them have to move. “Ring-Necked Duck in Winter Lake Andes National Wildlife Refuge South Dakota (54202161621)”, USFWS Mountain-Prairie (Liz Julian), Public domain
This spring

How many ducks were raised in Minnesota this spring

Spring breeding survey

Minnesota Breeding Waterfowl Survey

Minnesota Department of Natural Resources

Spring breeding survey, May 2026
678,914 ducks
239,579 of them mallards
205,650 blue-winged teal, more than triple the 2025 estimate; total ducks up 62% from 2025
In the agency’s words
Likewise, the estimated total duck population (excluding scaup) increased to 677,868 birds (SE = 154,631; Table 5; Figure 7), a 62% increase from the previous year and above both the 10-year and long-term averages. Including scaup, the estimated statewide breeding duck population reached 678,914 birds
Minnesota Department of Natural Resources, May 2026. Read it at the source

Breeding ducks, Canada geese and trumpeter swans across Minnesota's lake country, estimated from May aerial transects

How often
Conducted annually since 1968; the 2026 aerial survey began on 2 May and concluded on 25 May
Season
May to May
Long term
Total Ducks: 10-year average 602,805; long-term average 669,244 (survey since 1968)
Counted at
Stratum I, Stratum II, Stratum III

Minnesota duck migration questions

Advertisement

Duck migration in other states

Agency counts read up to October 8, 2026, each from the page linked on its card, and the agency’s own report is the one that governs. Observation curves from iNaturalist research grade records 2016 to 2025; this week’s figures and the forecast lows are read when the page opens. Every state is on the duck migration report.