
Groundhog Day 2027: How Often Every Groundhog Gets Spring Right
Graded against Pennsylvania's own March, Punxsutawney Phil has been right 12 of 27 years since 2000. Sand Mountain Sam, an opossum in Alabama, has been right 14 of 15.
The 2027 calls
Each state’s best-known forecaster, and how often it has been right against its own state’s March.
- Punxsutawney PhilPunxsutawney, PA
- Sand Mountain SamAlbertville, AL
- Chuck WoodQuincy, CA
- Flatiron FreddyBoulder, CO
- Chuckles the GroundhogManchester, CT
- Athene the Burrowing OwlCape Coral, FL
- General Beauregard LeeJackson, GA
- Woodstock WillieWoodstock, IL
- Charles WinchesterWoodburn, IN
- Polk County PaulaDes Moines, IA
The other 14 states’ groundhogs
- Queen City CharlieCumberland, MD
- Ms. GLincoln, MA
- Woody the WoodchuckHowell, MI
- Unadilla BillieUnadilla, NE
- Stonewall JacksonWantage, NJ
- Staten Island ChuckStaten Island, New York City, NY
- SnerdGarner, NC
- Buckeye ChuckMarion, OH
- Stumptown FilPortland, OR
- Bee Cave BobBee Cave, TX
- Chesapeake ChuckNewport News, VA
- French Creek FreddieFrench Creek, Upshur County, WV
- Jimmy the GroundhogSun Prairie, WI
- Lander LilLander, WY
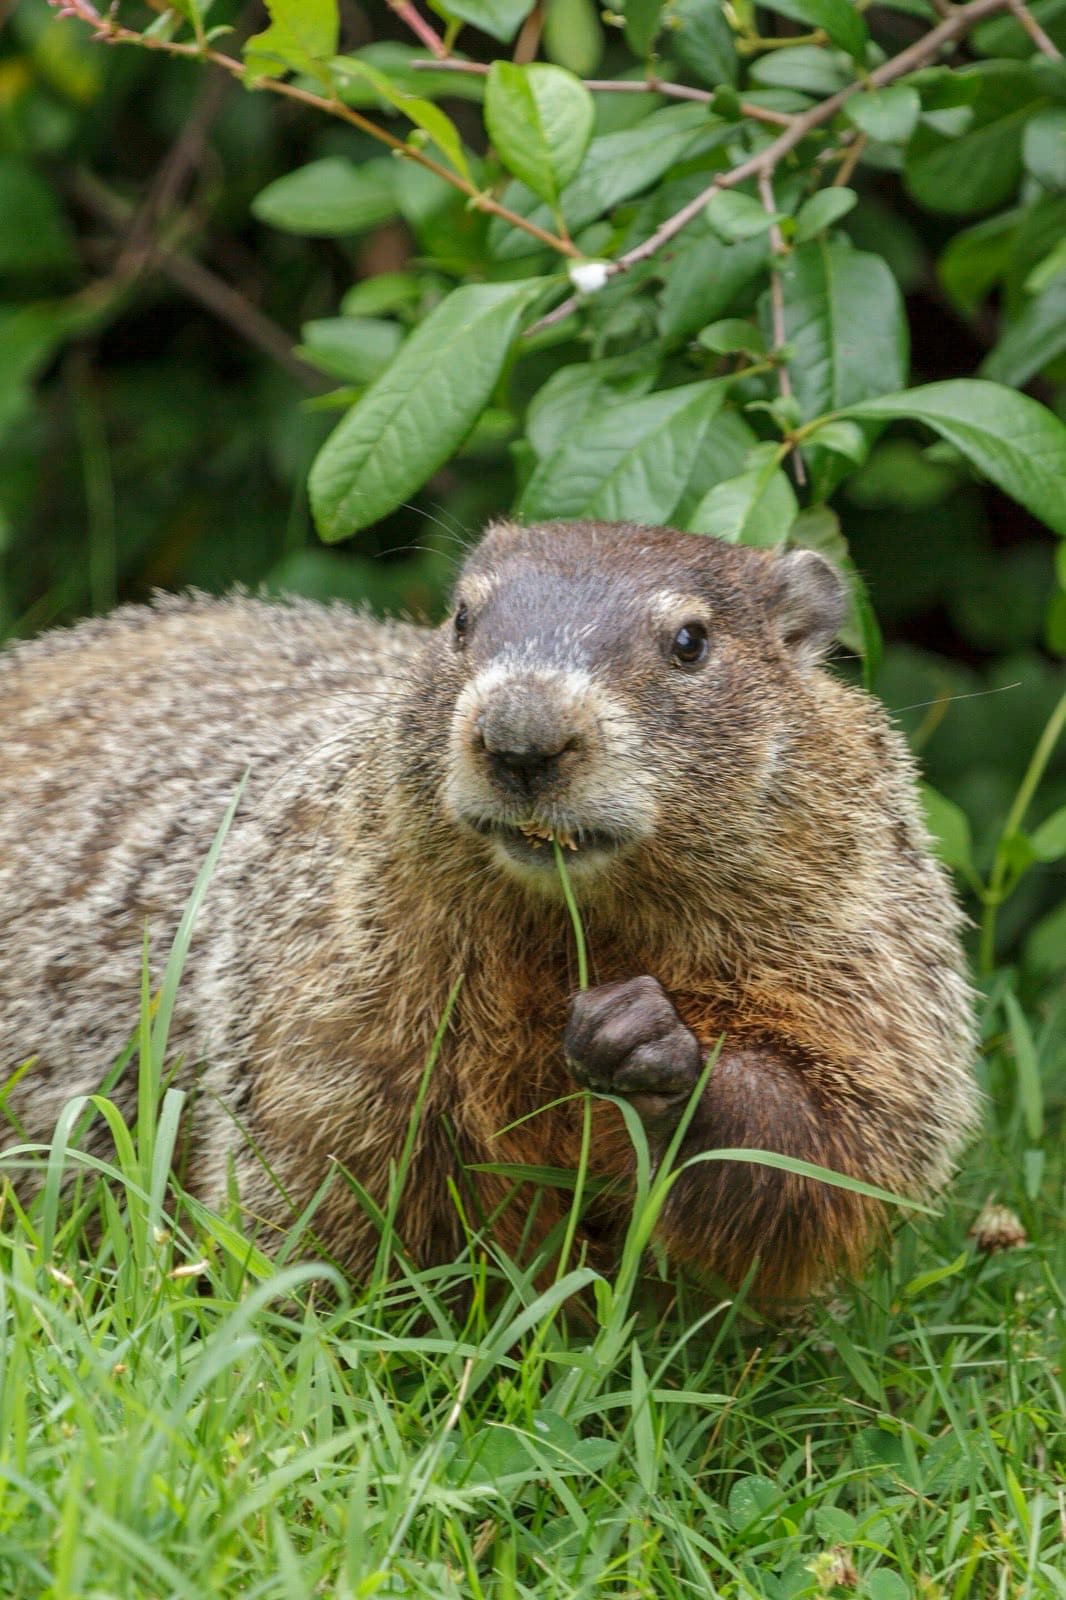
Photo: “Groundhog (48935342271)”, U.S. Fish and Wildlife Service, Midwest Region, Public domain
Every groundhog, one scoreboard
Graded on NOAA’s statewide recordsWhich groundhog is most accurate?
Every forecaster with at least 10 graded years, ranked by how often its call matched its own state’s March since 2000. Sand Mountain Sam leads with 14 of 15; Punxsutawney Phil is 33rd.
| # | Forecaster | Right | Rate |
|---|---|---|---|
| 1 | Sand Mountain SamAlbertville, AL | 14 of 15 | 93% |
| 2 | Beardsley BartBridgeport, CT | 13 of 15 | 87% |
| 3 | Chesapeake ChuckNewport News, VA | 9 of 12 | 75% |
| 4 | Tinicum TimPhiladelphia, PA | 9 of 12 | 75% |
| 5 | Benny the BassBuckeye Lake, OH | 8 of 11 | 73% |
| 6 | Harleysville HankHarleysville, PA | 8 of 11 | 73% |
| 7 | Stonewall JacksonWantage, NJ | 13 of 18 | 72% |
| 8 | General Beauregard LeeJackson, GA. NOAA's national grade: 75% | 18 of 26 | 69% |
| 9 | Polk County PaulaDes Moines, IA | 9 of 13 | 69% |
| 10 | Concord CharlieAthens, WV. NOAA's national grade: 70% | 18 of 27 | 67% |
Places 11 to 43
| # | Forecaster | Right | Rate |
|---|---|---|---|
| 11 | Wildwood WillieToledo, OH | 8 of 12 | 67% |
| 12 | Woodstock WillieWoodstock, IL. NOAA's national grade: 60% | 17 of 26 | 65% |
| 13 | French Creek FreddieFrench Creek, Upshur County, WV. NOAA's national grade: 60% | 17 of 27 | 63% |
| 14 | Bee Cave BobBee Cave, TX | 10 of 16 | 63% |
| 15 | Lander LilLander, WY. NOAA's national grade: 80% | 14 of 23 | 61% |
| 16 | Chuckles the GroundhogManchester, CT | 11 of 18 | 61% |
| 17 | Grover and SuePine Grove, PA | 12 of 20 | 60% |
| 18 | Jimmy the GroundhogSun Prairie, WI. NOAA's national grade: 65% | 16 of 27 | 59% |
| 19 | Staten Island ChuckStaten Island, New York City, NY. NOAA's national grade: 85% | 13 of 22 | 59% |
| 20 | Gertie the GroundhogHanna City, IL. NOAA's national grade: 65% | 15 of 26 | 58% |
| 21 | Octoraro OrphieQuarryville, PA. NOAA's national grade: 58% | 15 of 26 | 58% |
| 22 | Ms. GLincoln, MA | 11 of 19 | 58% |
| 23 | Yahdee the GroundhogOrefield, PA | 6 of 11 | 55% |
| 24 | Dunkirk DaveDunkirk, NY. NOAA's national grade: 55% | 14 of 26 | 54% |
| 25 | Poor RichardYork, PA. NOAA's national grade: 50% | 13 of 24 | 54% |
| 26 | Stormy MarmotAurora, CO | 10 of 19 | 53% |
| 27 | Buckeye ChuckMarion, OH. NOAA's national grade: 60% | 14 of 27 | 52% |
| 28 | Mount Joy MinnieMount Joy, PA | 9 of 18 | 50% |
| 29 | Lawrenceville LucyLawrenceville, PA | 7 of 14 | 50% |
| 30 | Scramble the DuckEastford, CT | 6 of 12 | 50% |
| 31 | Big AlBeaumont, TX | 5 of 10 | 50% |
| 32 | Flatiron FreddyBoulder, CO | 8 of 17 | 47% |
| 33 | Punxsutawney PhilPunxsutawney, PA. NOAA's national grade: 35% | 12 of 27 | 44% |
| 34 | Woody the WoodchuckHowell, MI. NOAA's national grade: 35% | 12 of 27 | 44% |
| 35 | Bowman BillStephens City, VA | 6 of 14 | 43% |
| 36 | Schnogadahl SammiKresgeville, PA. NOAA's national grade: 39% | 10 of 24 | 42% |
| 37 | SnerdGarner, NC | 5 of 12 | 42% |
| 38 | Uni the GroundhogMyerstown, PA. NOAA's national grade: 47% | 9 of 22 | 41% |
| 39 | Malverne MelMalverne, NY. NOAA's national grade: 55% | 10 of 26 | 38% |
| 40 | Buffalo BertBuffalo, NY | 5 of 13 | 38% |
| 41 | Patty PagodaReading, PA | 5 of 13 | 38% |
| 42 | Dover DougDover Township, PA | 5 of 14 | 36% |
| 43 | Holtsville HalHoltsville, NY. NOAA's national grade: 45% | 9 of 26 | 35% |
The bar to beat is an early spring every year. March has run warm most years since 2000, so in Pennsylvania that one call, made every year, would have been right 18 of 27 times. Phil, who saw a shadow in 20 of 27 years, was right 12.
How accurate is Punxsutawney Phil?
NOAA grades Phil against the whole contiguous US and gives him 35 percent for 2006 to 2025, 7 of 20 years, in its Grading the Groundhogs scorecard. Counted the same way from 2000 to 2026, he was right 9 of 27. NOAA’s climate records office puts him at 30 percent over the last 10 years.
Phil’s calls since 2000, against the contiguous US
- 2000shadow, March 4.5 degrees warmer, wrong
- 2001shadow, March less than a tenth of a degree colder, right
- 2002shadow, March 2.0 degrees colder, right
- 2003shadow, March 1.8 degrees warmer, wrong
- 2004shadow, March 5.9 degrees warmer, wrong
- 2005shadow, March 0.8 degrees warmer, wrong
- 2006shadow, March 1.1 degrees warmer, wrong
- 2007no shadow, March 6.1 degrees warmer, right
- 2008shadow, March 0.4 degrees warmer, wrong
- 2009shadow, March 1.4 degrees warmer, wrong
- 2010shadow, March 2.1 degrees warmer, wrong
- 2011no shadow, March 1.6 degrees warmer, right
- 2012shadow, March 8.9 degrees warmer, wrong
- 2013no shadow, March 0.6 degrees colder, wrong
- 2014shadow, March 1.0 degrees colder, right
- 2015shadow, March 3.9 degrees warmer, wrong
- 2016no shadow, March 6.0 degrees warmer, right
- 2017shadow, March 4.6 degrees warmer, wrong
- 2018shadow, March 1.2 degrees warmer, wrong
- 2019no shadow, March 1.2 degrees colder, wrong
- 2020no shadow, March 4.6 degrees warmer, right
- 2021shadow, March 4.0 degrees warmer, wrong
- 2022shadow, March 2.6 degrees warmer, wrong
- 2023shadow, March 1.0 degrees colder, right
- 2024no shadow, March 3.4 degrees warmer, right
- 2025shadow, March 5.3 degrees warmer, wrong
- 2026shadow, March 9.3 degrees warmer, wrong
Phil sees his shadow most years (20 of 27), and March across the country has come in warmer than average in 21 of them. In 2026, Punxsutawney Phil saw a shadow, six more weeks of winter; March came in 9.3 degrees warmer than average across the contiguous US, the warmest March there since 1895, so the call was wrong.
NOAA’s own forecast for February to April
NOAA’s Climate Prediction Center outlook for February to April 2027, issued November 19, 2026, leans warmer in 31 states, colder in 1 and shows equal chances in 18. Closer to home for Phil, it leans warmer in Pennsylvania, with 50 percent odds of a warmer than normal February to April.
So on Feb 2: a shadow, and Phil parts ways with NOAA; no shadow, and the two agree.
CPC issues a new outlook on the third Thursday of each month; the January outlook is the last one before Groundhog Day, and every state page here carries the latest.
How a groundhog is graded
A shadow, six more weeks of winter, counts as right when March comes in colder than its 20th century average. No shadow, an early spring, counts as right when March comes in warmer. That is the rule NOAA uses in its own scorecard, and a March exactly on its average counts neither way.
NOAA grades every forecaster against the whole contiguous US. These pages also grade each one against its own state’s March, from NOAA’s statewide records, because a groundhog in Georgia is calling a Georgia spring. The calls since 2000 come from the open record at groundhog-day.com, read again on the hosts’ own pages for the best-known forecasters.
The 2027 calls are graded in April, once NOAA publishes March’s temperatures.
Groundhog Day questions
Groundhog Day by state
18 states have a forecaster with a long record, year by year. Every state’s spring forecast page carries a short version beside NOAA’s outlook: its own groundhog where one is still calling, Punxsutawney Phil everywhere else.