
Central Flyway Duck Hunting Forecast
The week ahead across all 10 states in the corridor, each rated Slow to Prime for duck and goose movement from the snow on the ground, the freeze counted in days, the front, the wind and the barometer.
The Central Flyway week, north to south
The Great Plains corridor from the Dakotas and Montana down through Texas. Every state in it, ordered coldest first, with the best morning this week at its own NOAA reference points and the freeze date those normals give. A push shows up at the top of the list days before it reaches the bottom, which is the whole reason to read a flyway as one thing.
| State, north to south | Duck zones | Duck season spans | Freezes from | Coldest normal day |
|---|---|---|---|---|
| North Dakota | 2 | Sep 26 to Jan 3 | Nov 7 | 9F at Minot |
| Montanapart of the state is in the Pacific Flyway | 3 | Oct 3 to Jan 19 | Nov 19 | 23F at Missoula |
| South Dakota | 4 | Sep 26 to Jan 14 | Nov 11 | 12F at Aberdeen |
| Wyomingpart of the state is in the Pacific Flyway | 4 | Sep 26 to Jan 31 | Nov 8 | 17F at Jackson |
| Nebraska | 3 | Oct 3 to Jan 27 | Nov 24 | 25F at Scottsbluff |
| Coloradopart of the state is in the Pacific Flyway | 5 | Oct 3 to Jan 31 | Dec 1 | 29F at Denver |
| Kansas | 4 | Oct 10 to Jan 31 | Dec 2 | 29F at Goodland |
| Oklahoma | 2 | Oct 10 to Jan 31 | Dec 25 | 37F at Tulsa |
| New Mexicopart of the state is in the Pacific Flyway | 3 | Oct 10 to Jan 31 | Dec 4 | 29F at Santa Fe |
| Texas | 3 | Oct 24 to Jan 31 | Nov 27 | 36F at Amarillo |
- Prime80 and up
- Great68 and up
- Good55 and up
- Fair40 and up
- Slow0 and up
Minot and Dallas-Fort Worth this week
The same seven days at the top and the bottom of the corridor, rated side by side. North Dakota sits at the cold end and New Mexico at the mild end, and the gap between their two weeks is the push in transit.
| Reference point | Best morning this week | What carries it | Birds |
|---|---|---|---|
| Minot, ND | Loads as you scroll | – | – |
| Dallas-Fort Worth, TX | Loads as you scroll | – | – |
The Central Flyway birds this year, from the federal surveys
The U.S. Fish and Wildlife Service flies the Waterfowl Breeding Population and Habitat Survey every May and publishes the counts in its annual Waterfowl Population Status report. Those numbers set how many birds are in the corridor to begin with; the week ahead decides when they move.
The eastern Dakotas fell hardest
The eastern Dakotas counted 3.5 million ducks, a quarter below 2025 and a third below the long run average.
“In the eastern Dakotas, the total duck estimate (3.5 ± 0.2 million) was 24% below the 2025 estimate and 33% below the long-term average (5.3 ± 0.04 million).”
Waterfowl Population Status, 2026, U.S. Fish and Wildlife Service, read 2026-11-01
Montana and the western Dakotas also down
Montana with the western Dakotas counted 1.6 million ducks, 13 percent below 2025 and 11 percent below the long run average.
“The total duck estimate for the Montana—western Dakotas crew area was 1.6 ± 0.08 million, which was 13% below the 2025 estimate and 11% below the long term average of 1.8 ± 0.02 million.”
Waterfowl Population Status, 2026, U.S. Fish and Wildlife Service, read 2026-11-01
Across the continent
Ponds up this spring, still under average
The May pond count across Prairie Canada and the northcentral states came to 4.8 million, 14 percent above 2025 and 9 percent below the long run average.
“The total pond estimate (Prairie Canada and northcentral U.S. combined) was 4.8 ± 0.2 million, which was 14% above the 2025 estimate of 4.2 ± 0.1 million, and 9% below the long-term average (5.2 ± 0.03 million; Table 1, Figure 3).”
Waterfowl Population Status, 2026, U.S. Fish and Wildlife Service, read 2026-11-01
The mallard count is a quarter under average
Mallards were counted at 5.9 million, down 11 percent on 2025 and 26 percent on the long run average.
“Estimated total mallard (Anas platyrhynchos) abundance was 5.9 ± 0.2 million, which was 11% below the 2025 estimate and 26% below the long-term average of 7.9 ± 0.04 million.”
Waterfowl Population Status, 2026, U.S. Fish and Wildlife Service, read 2026-11-01
Pintails are the count to watch
Northern pintails held at 2.0 million, level with 2025 and 48 percent under the long run average.
“The northern pintail (Anas acuta) estimate was 2.0 ± 0.1 million, which was similar to the 2025 estimate of 2.2 ± 0.2 million and 48% below the long-term average of 3.8 ± 0.03 million.”
Waterfowl Population Status, 2026, U.S. Fish and Wildlife Service, read 2026-11-01
Two of the survey crew areas sit inside the flyway, in the Dakotas and Montana.
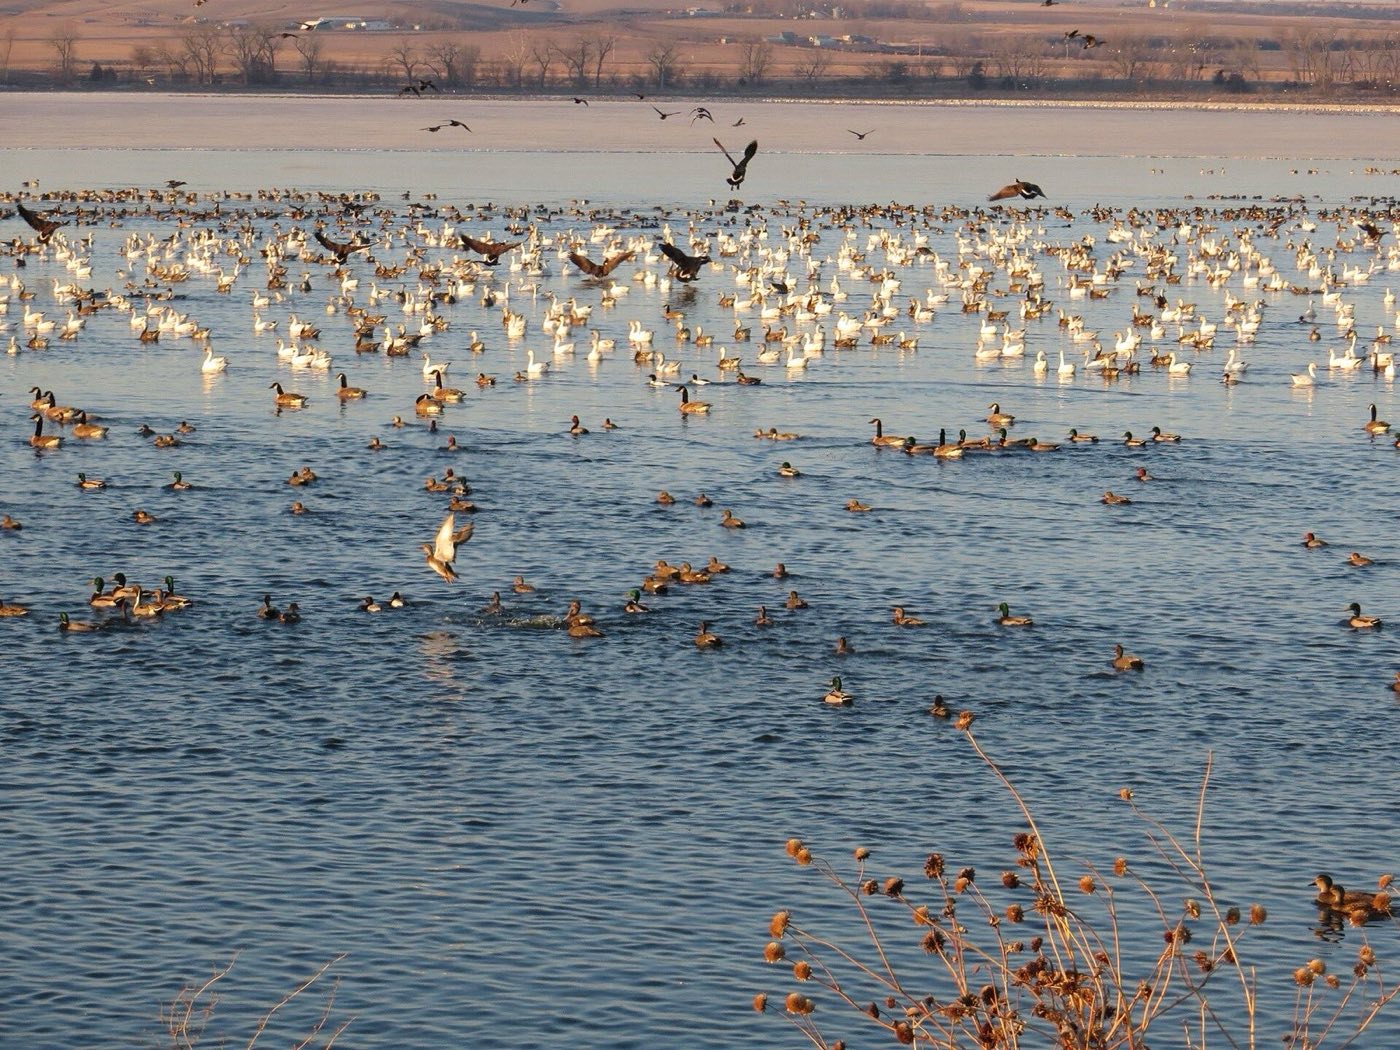
Every Central Flyway state, rated
Each state page carries the week at its own reference points, the duck zones open across those days, its freeze normals and its agency’s source. Montana, Wyoming, Colorado, New Mexico are split between flyways, so the zone a marsh sits in decides which framework its season follows.
- Texas: 3 duck zones, freezing from about Nov 27
- Oklahoma: 2 duck zones, freezing from about Dec 25
- Kansas: 4 duck zones, freezing from about Dec 2
- Nebraska: 3 duck zones, freezing from about Nov 24
- South Dakota: 4 duck zones, freezing from about Nov 11
- North Dakota: 2 duck zones, freezing from about Nov 7
- Montana: 3 duck zones, freezing from about Nov 19, partly Pacific Flyway
- Wyoming: 4 duck zones, freezing from about Nov 8, partly Pacific Flyway
- Colorado: 5 duck zones, freezing from about Dec 1, partly Pacific Flyway
- New Mexico: 3 duck zones, freezing from about Dec 4, partly Pacific Flyway
Central Flyway questions
The other three flyways
- Atlantic Flyway: The Atlantic Flyway runs the seaboard from Maine to Florida and reaches inland to West Virginia.
- Mississippi Flyway: The Mississippi Flyway follows the river system from the Great Lakes to the Gulf.
- Pacific Flyway: The Pacific Flyway runs from Alaska down the coast states and through the Great Basin.
More for the season
Season dates and zones come from each state agency by way of the waterfowl season pages, the freeze dates from the NOAA 1991 to 2020 daily climate normals, read 2026-11-01, and the survey numbers from the U.S. Fish and Wildlife Service reports quoted above. The 2026-27 dates, zones, bag limits and shooting hours that govern are the ones on your own state agency’s page. A rating reads the weather, and food, habitat and hunting pressure move birds too. The forecast hub rates any ZIP code.