
Skip to content
Historical record · Minnesota · 1860 to 2018

When Minnesota Lakes Freeze Over: Ice In Dates

Minnesota is the only state in the country that maps the freeze the way it maps the thaw. The DNR runs a public ice-in map every autumn alongside its ice-out one, and Minnesota lakes hold the earliest typical freeze dates in this dataset.

4
Water bodies with a freeze record
40 or more recorded winters each
265
Recorded freezes
individual dates written down
1860
Oldest observation
Pepin
2
Century long records
spanning 100 winters or more

Dates from past winters. For today’s ice, ask the agency that manages the water.

Typical ice in on Detroit

November 22

That is the median across 106 recorded winters from 1899 to 2018, the deepest freeze record in Minnesota. Across the 4 Minnesota water bodies on this page the typical closing runs from November 22 on Detroit to December 2 on Waconia. Each of those is a median from a record of past winters, not a forecast or an observation of any lake now.

November 25
Detroit across its last 30 recorded winters
10 days
Between the earliest and latest typical freeze in the state
2 of 2
Records long enough to state a century trend that show a later freeze
0
Winters with no freeze at all, on 0 of these water bodies

Every Minnesota water body, in the order they close

Nov 1Dec 1Jan 1DetroitNov 22PepinNov 27GreenDec 2WaconiaDec 2

Each bar runs from that water body's earliest recorded closing to its latest, across the whole Minnesota record. The solid dot is the median over every recorded winter and the ring is the median over the most recent 30. The scale starts near the earliest date in the set rather than at January 1, because these are dates a few weeks apart.

Where this winter’s dates come from

The DNR asks the public to report ice-in on their own lake and maps the reports as they arrive each autumn, which makes Minnesota the only state with a live statewide picture of the freeze. Their medians are computed from 1950 onward for lake-to-lake consistency, so they will not always match the whole-record figures on this page.

Minnesota DNR ice in reports

Today against the record

How this point in the season has usually played out

Where today sits in the Detroit record

Today is earlier in the ice season than any closing in this record. The earliest Detroit ever closed over in 106 recorded winters was October 25, in 1919, which is 6 days from now on this year’s calendar.

The median across the whole record is November 22, which is 34 days from now on this year’s calendar. The record itself ends in 2018, so this is a comparison against past winters and not a statement about the current one.

This counts recorded winters, not this one; the current winter comes from the agency linked above.

Detroit, recorded closings by winter

1971 to 2018, 40 winters, median Nov 22median Nov 221971: November 221972: November 221973: November 291974: November 251975: November 261976: November 151977: November 221978: November 211979: November 301980: November 251981: December 51982: November 231983: November 261984: November 231985: November 161986: November 141987: November 251988: November 231989: November 221990: November 261991: November 31992: November 271993: November 81994: November 291995: November 111996: November 131997: November 251998: December 71999: December 162000: November 212001: December 72006: November 302007: November 272008: November 222009: December 52010: November 242011: November 232012: November 302015: November 272018: November 131980199020002010
Taller means later in the season. The darker columns are the more recent half of the window. The dashed line is the median across the whole record, not just this window, and the vertical scale starts near the earliest date on the chart rather than at January 1 so that a three week shift stays visible. The source ships the most recent 40 observations here, so this window is the tail of a record that begins in 1899.
Advertisement
Water body by water body

The deepest Minnesota freeze records

Ordered by how much record is behind them. The median is across every recorded winter; the second figure is across the most recent 30, which is the fairer thing to compare against a lake you know today.

Names are reproduced exactly as the source database records them, which is often a shortened form: a lake filed as “Detroit” or “Otsego” is Detroit Lake or Otsego Lake to everyone who lives on it. The names stay as recorded, because United States lakes split unpredictably between “Lake X” and “X Lake”; the subtitle on each card carries the water body type and the state.

Detroit

Lake in Minnesota · 106 recorded winters, 1899 to 2018

Nov 22
typical ice in
Nov 25
last 30 recorded winters
Oct 25
earliest, 1919
Dec 16
latest, 1999

Across the whole record the closing date has moved 11 days later per century across the record.

Its ice out has moved barely at all across the record, so adding the two lines together this lake’s ice season is about 12 days shorter per century.

1900sNov 241910sNov 91920sNov 161930sNov 201940sNov 191950sNov 191960sNov 261970sNov 241980sNov 231990sNov 232000sNov 292010sNov 23

Mean closing date per decade. Only decades with four or more observations appear, and the scale starts near the shortest bar rather than at January 1 so that small differences stay visible rather than collapsing into one length.
Green

Lake in Minnesota · 66 recorded winters, 1908 to 2014

Dec 2
typical ice in
Dec 2
last 30 recorded winters
Nov 18
earliest, 1932
Dec 23
latest, 1998

Across the whole record the closing date has moved 3 days later per century across the record.

Its ice out has moved 9 days earlier per century across the record, so adding the two lines together this lake’s ice season is about 12 days shorter per century.

1950sDec 31960sDec 51970sNov 301980sNov 301990sDec 32000sDec 82010sDec 1

Mean closing date per decade. Only decades with four or more observations appear, and the scale starts near the shortest bar rather than at January 1 so that small differences stay visible rather than collapsing into one length.
Waconia

Lake in Minnesota · 50 recorded winters, 1940 to 2016

Dec 2
typical ice in
Nov 30
last 30 recorded winters
Nov 16
earliest, 1976
Dec 19
latest, 2015

The record spans 76 years, under the 80 year span needed to state a century trend. The median and the extremes above are unaffected.

1940sDec 41950sDec 41960sNov 301970sNov 282000sDec 52010sDec 4

Mean closing date per decade. Only decades with four or more observations appear, and the scale starts near the shortest bar rather than at January 1 so that small differences stay visible rather than collapsing into one length.

Pepin

Lake in Minnesota · 43 recorded winters, 1860 to 1905record ends 1905

Nov 27
typical ice in
Nov 26
last 30 recorded winters
Nov 2
earliest, 1882
Dec 30
latest, 1890

The record spans 45 years, under the 80 year span needed to state a century trend. The median and the extremes above are unaffected.

1860sNov 281870sNov 271880sNov 201890sNov 301900sNov 29

Mean closing date per decade. Only decades with four or more observations appear, and the scale starts near the shortest bar rather than at January 1 so that small differences stay visible rather than collapsing into one length.

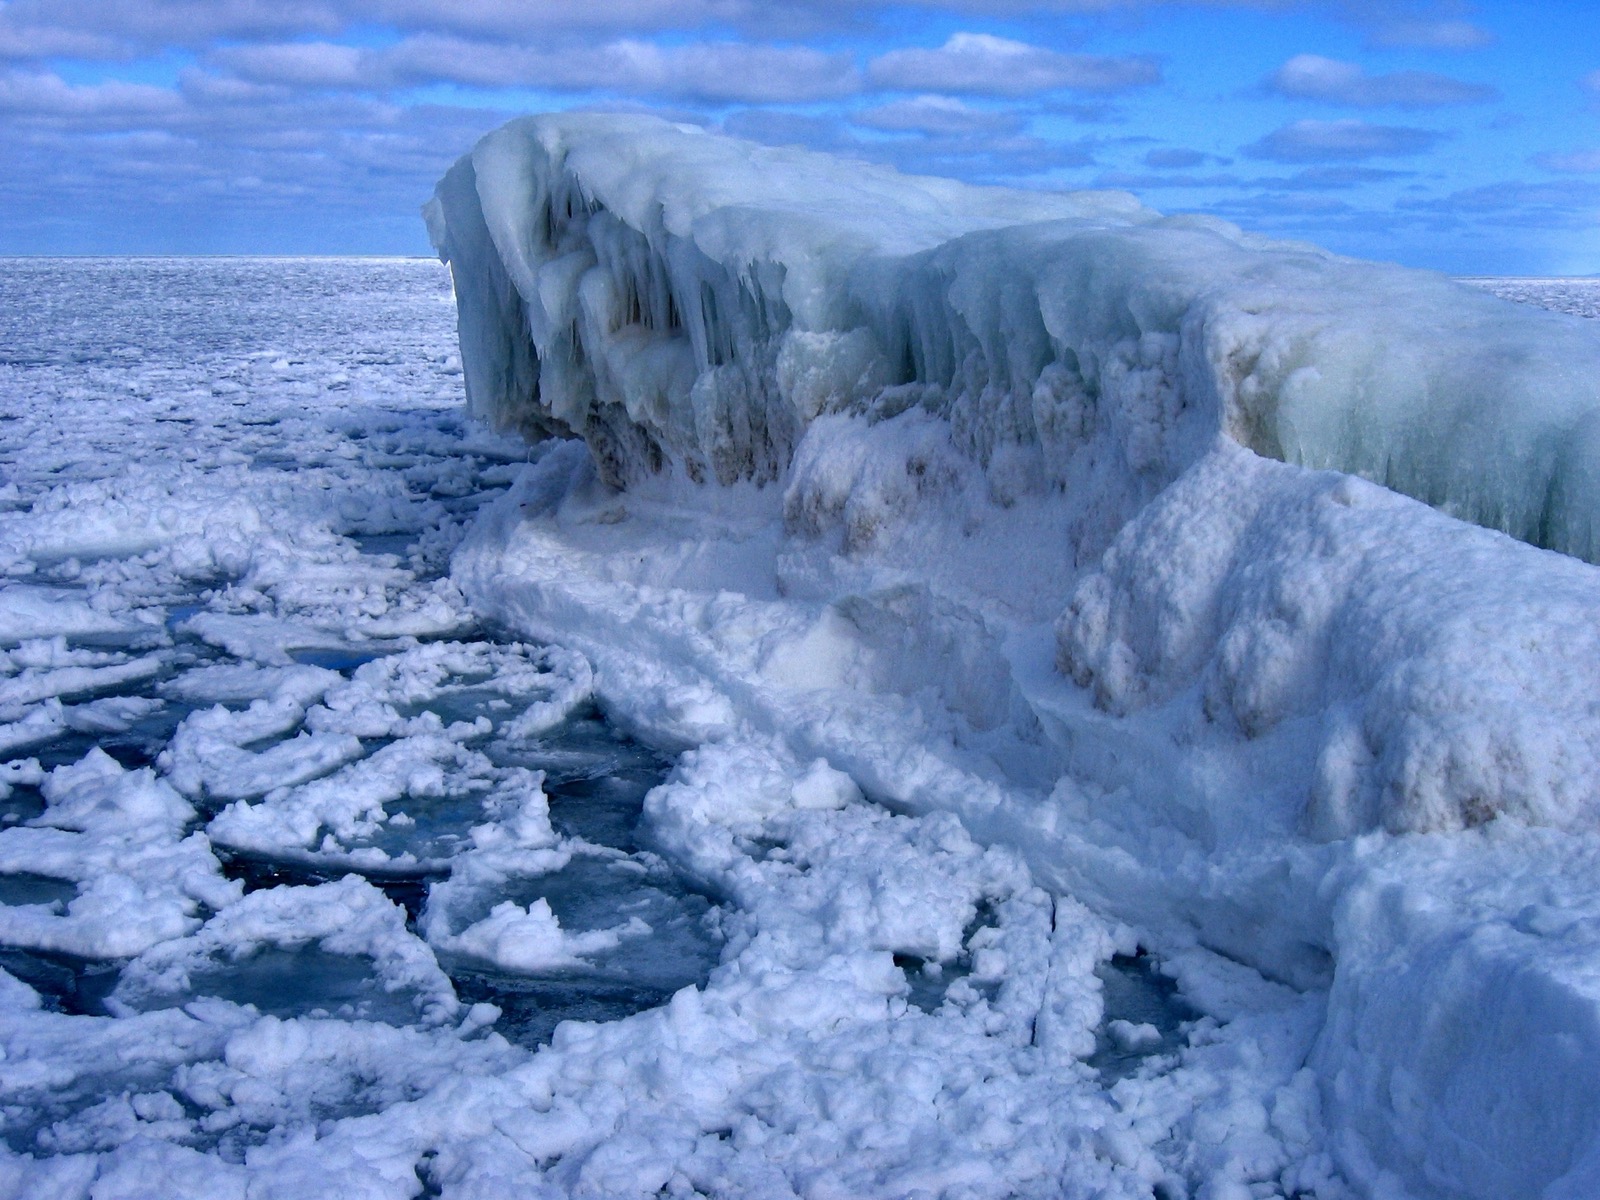
A wall of shelf ice rising above a lake surface strewn with broken plates of new ice and patches of dark open water, under a blue sky with high cloud
Shelf ice standing above a field of broken new plates, with open water still showing between them. This is the state a lake is in for days or weeks before anybody writes a closing date against it, and it is why two observers standing on the same shore can pick two different days. “Ice along Lake Superior” — National Park Service, Pictured Rocks National Lakeshore — Public domain
Every record

All 4 Minnesota water bodies with a freeze record

Water bodyRecordTypical ice inLast 30 wintersEarliestLatestChange per centuryWinters open
Detroit1899 to 2018 (106)Nov 22Nov 25Oct 25 1919Dec 16 1999+10.6 days0
Pepin1860 to 1905 (43)Nov 27Nov 26Nov 2 1882Dec 30 1890record too short0
Green1908 to 2014 (66)Dec 2Dec 2Nov 18 1932Dec 23 1998+3.4 days0
Waconia1940 to 2016 (50)Dec 2Nov 30Nov 16 1976Dec 19 2015record too short0

Dates are day of year, rendered on a common non leap calendar so the same stored value always reads the same way. Freeze dates are stored on a winter axis, where a January closing sorts after a December one instead of jumping back to the start of the year; the labels above are ordinary calendar dates. “Change per century” is a least squares line through the observations, shown only where a record spans 80 years or more, because a century figure extrapolated from a 40 year window describes the decades that happened to be sampled rather than the lake. “Winters open” counts the winters the source marks as never closing over, which are observations rather than gaps and are not included in the record counts.

Both ends of the season

How much shorter the Minnesota ice season has got

2 Minnesota water bodies carry a least squares slope on both the freeze and the thaw, which is the only way to see the season from both ends at once. Adding one lake’s own freeze line to its own thaw line, the widest here is Green at 11.9 days shorter per century.

That is addition on two numbers the source data already publishes for that lake: a description of what one lake’s own record did across the years somebody was watching it, not a model and not a projection of what the next decade will do.

no change10d shorterGreen (MN)11.9d shorterDetroit (MN)11.5d shorter
  • Freeze arriving later
  • Thaw arriving earlier

Each bar is one Minnesota lake's own freeze line added to its own thaw line, both fitted by least squares to that lake's observations and both already published in the source data. Only records spanning 80 years or more on both variables appear, which is why not every water body in the table above is here.

Reading the record

What the Minnesota freeze record shows

Of the 2 Minnesota freeze records long enough to state a century trend, 2 show the closing date arriving later. Those are least squares lines fitted to observations, the same simple description the ice phenology literature uses. They describe what each record did. Any single lake can swing three or four weeks between consecutive winters, and several here have.

A typical ice in date is a median drawn from a record: the middle of a distribution whose ends, on these Minnesota records, sit 33 days apart on Waconia alone. It describes past winters, not the current one.

Minnesota DNR defines ice-in as the whole lake being frozen over with the cover holding through the winter, which is a stricter test than the first-freeze definition several other series in this dataset use. A lake that skins over in a cold week and opens again in a thaw has not had its ice-in date under that rule.

The state that counts both ends. Minnesota has more reporting lakes than anywhere else in the country because the DNR asks ordinary people to send the date in, and it is the only state that runs the same exercise in November as it does in April. In a cold autumn the reports sweep south from the Arrowhead over about three weeks, which is the reverse of the way ice-out moves.

A record that ends in 1905. Lake Pepin, the wide reach of the Mississippi below Red Wing, has 43 recorded closings between 1860 and 1905 and nothing after. It is a river lake with current running through it, which is exactly why somebody was writing the date down, and exactly why it froze later than its latitude suggests.

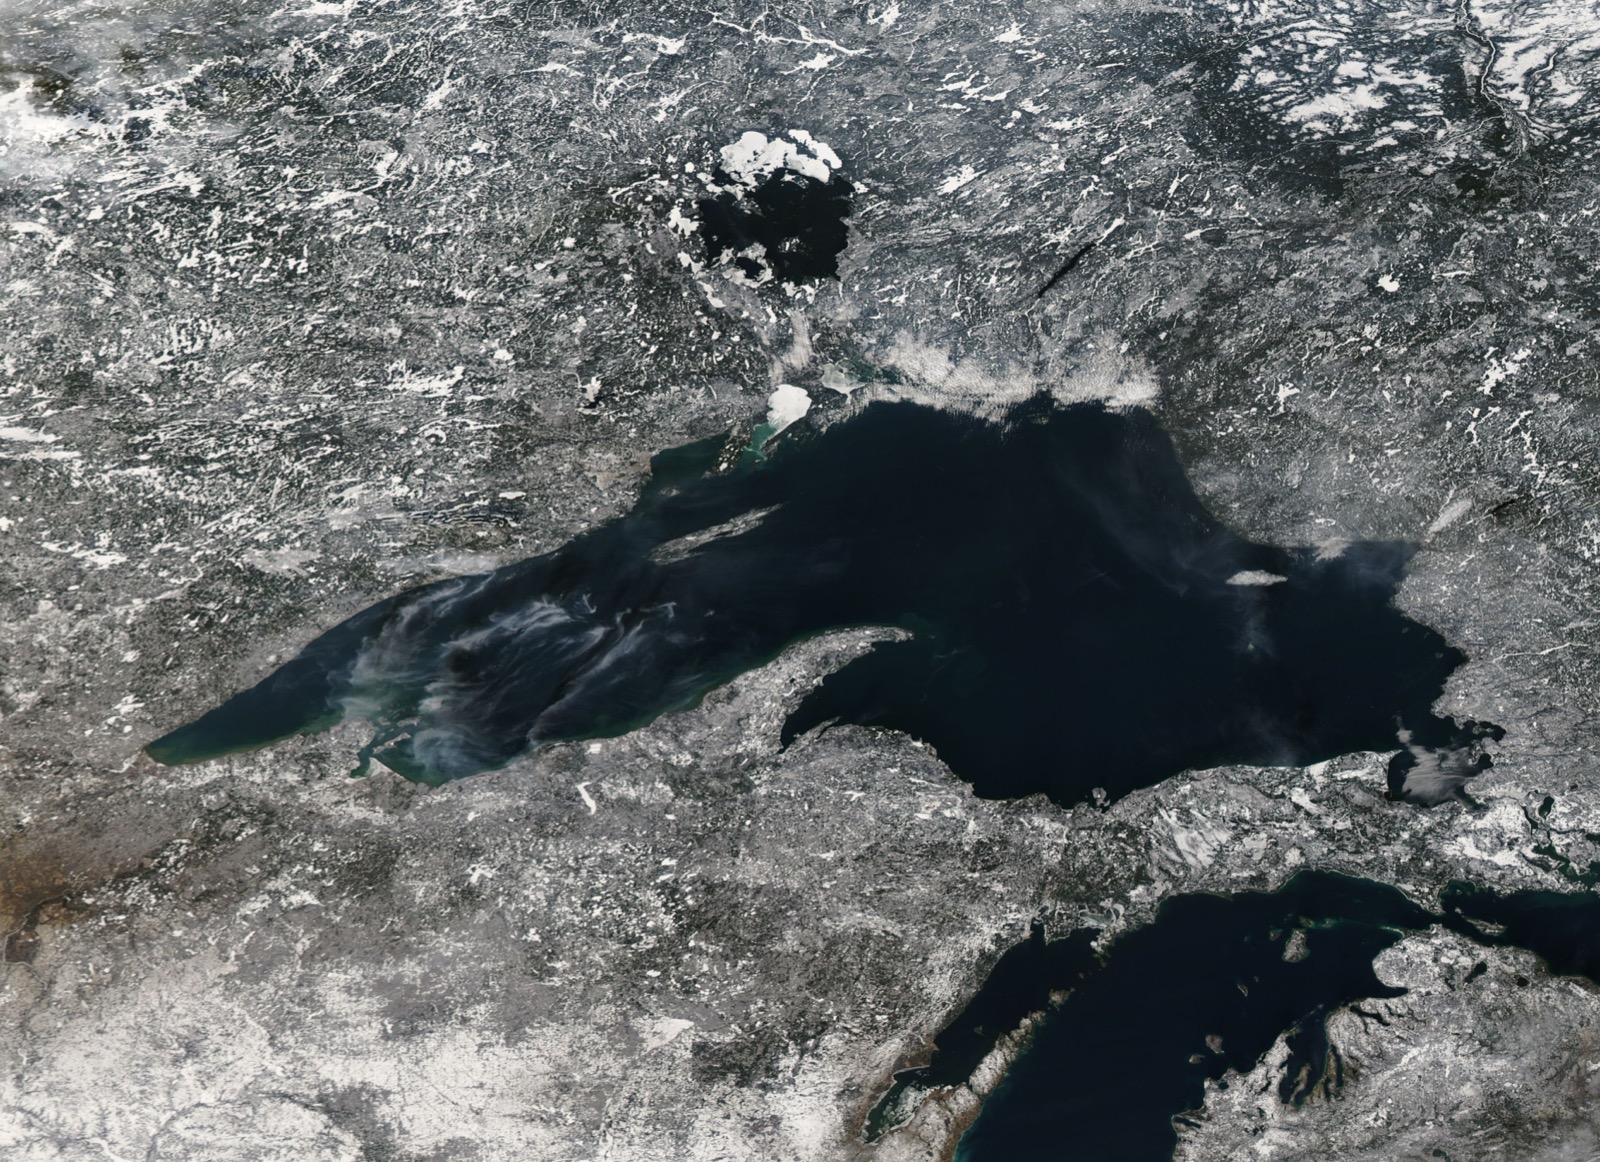
Satellite view of Lake Superior in mid December with the surrounding land under snow, the open lake dark, and pale new ice showing in the shallow western bays
Lake Superior on December 15, with the first ice of that winter forming in the shallow western bays while the deep middle stays open. Depth is what sets a freeze date: a shallow bay gives up its summer heat in weeks and the deep middle can take all winter or never manage it. “Lake Superior (MODIS 2018-12-20)” — MODIS Land Rapid Response Team, NASA GSFC — Public domain
Provenance

Where these Minnesota numbers came from

The observations

265 recorded closings across 4 Minnesota water bodies, from 1860 to 2018. Only records with 40 or more usable observations are included, and every derived figure is computed from them.

Benson, B., Magnuson, J. and Sharma, S. (2000). Global Lake and River Ice Phenology Database. (G01377, Version 1). Boulder, Colorado USA. National Snow and Ice Data Center. https://doi.org/10.7265/N5W66HP8 Accessed 2026-08-24.

Detroit Lake has the earliest typical freeze of any century long record here, and its own record runs from 1899 to 2018 with no winter in which it failed to close.

Common questions

Minnesota lake ice in FAQ

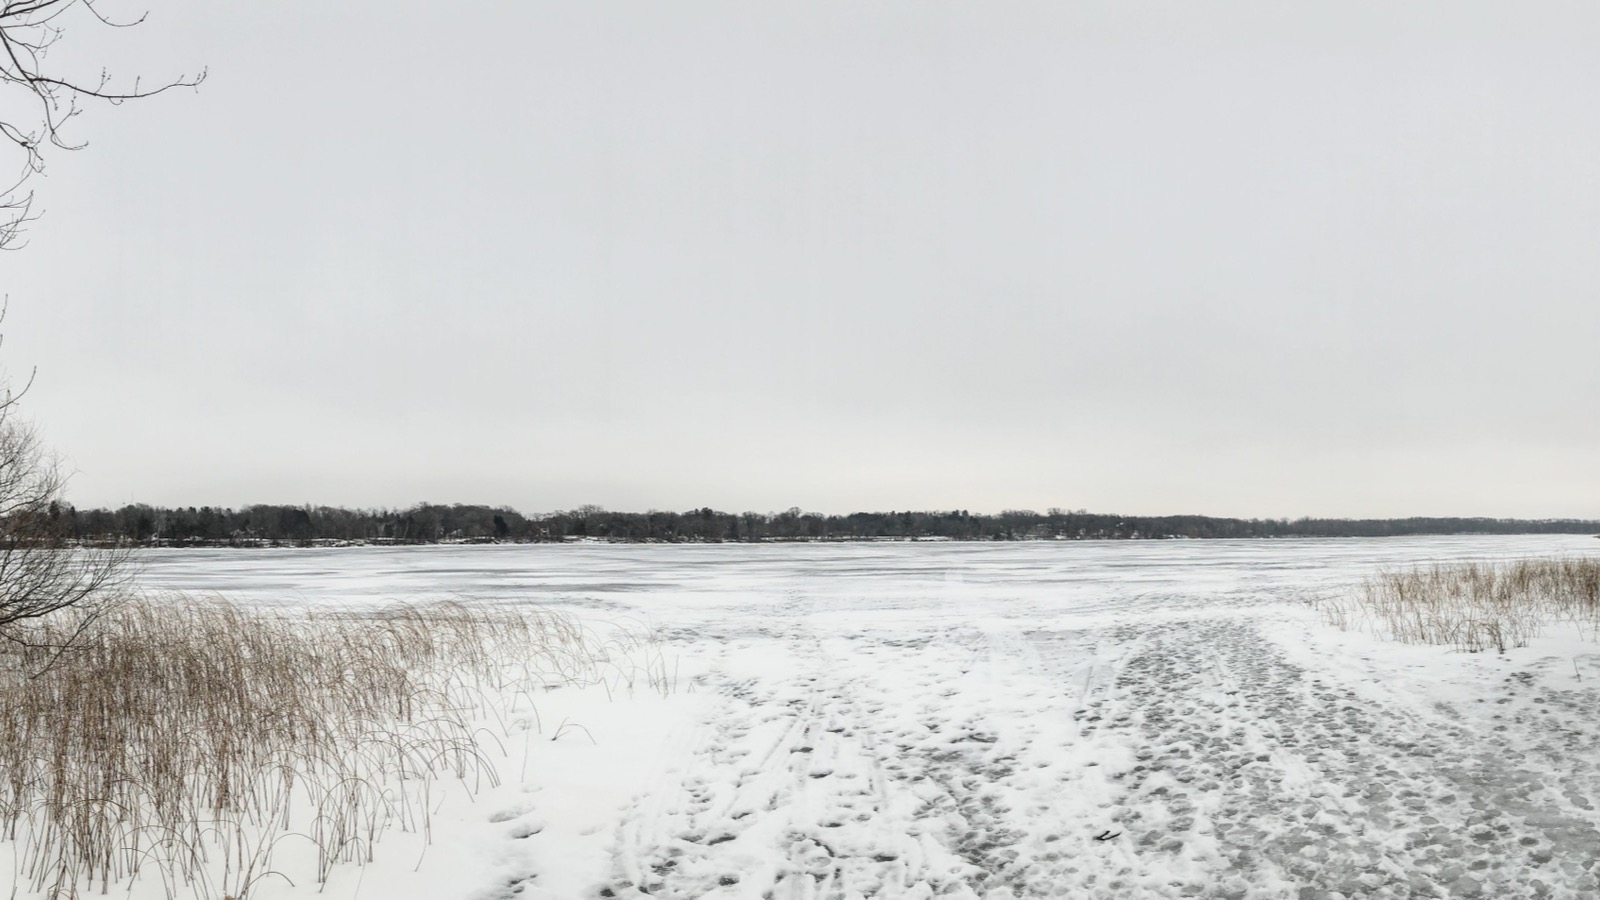
A frozen lake under flat grey winter light with dry reed beds along the near shore, bare branches at the left edge and a low wooded shoreline in the distance
A closed Minnesota lake under flat January light. This is the state that asks the public to report exactly this, one lake at a time, and maps the reports as they arrive: the only statewide ice in picture anybody publishes. “Frozen Lake Elmo Minnesota (24820237837)” by Tony Webster from Minneapolis, Minnesota, United States, CC BY 2.0
The other end of the season

Ice in, ice out, and the rest of the Minnesota winter

Minnesota ice inWhen 4 Minnesota water bodies have typically closed over, from 265 recorded winters. You are on it.
Minnesota ice outThe spring half of the same records, lake by lake, from the same source. Together they are the length of the Minnesota ice season.

More Midwest states with a lake freeze record

Advertisement

Ice in dates are historical observations compiled by the National Snow and Ice Data Center. They describe past winters only: a median freeze date is a record of winters that have already happened, and says nothing about the ice on any lake today. For current ice and for anything involving going out on it, contact Minnesota DNR ice safety. National picture: every state with a lake freeze record → The thaw half: Minnesota lake ice out dates.
Hero image: “Frozen Lake Elmo Minnesota (24820237837)” by Tony Webster from Minneapolis, Minnesota, United States, CC BY 2.0