
Skip to content
Historical record · Minnesota

Lake Ice Out and Ice In Dates in Minnesota

Minnesota keeps more lake ice records than any other state, and it is the only one that tracks the freeze as carefully as the thaw. The state climatology office has been collecting ice-in and ice-out reports since the middle of the nineteenth century.

31
Lakes with a record
40 or more recorded years each
2,649
Observations
individual dates written down
1844
Oldest observation
Pepin
10
Century long records
spanning 100 years or more

Dates from past winters. For today’s ice, ask the agency that manages the water.

Where this year’s dates come from

The DNR maps ice-out reports for hundreds of Minnesota lakes as they come in each spring, and keeps a separate ice-in map for the freeze. Their medians are computed from 1950 onward for lake-to-lake consistency, so they will not always match the whole-record figures on this page.

Minnesota DNR ice-out reports

Today against the record

How this date has usually played out

Where today sits in the record for Detroit

40 of 40 of the most recent recorded years had already seen ice out on Detroit by this date.

The median across the whole record is April 20, which is 172 days ago on this year’s calendar. The record itself runs to 2020, so this is a comparison against history and not a statement about the current season.

This counts recorded years, not this year; the current season comes from the agency linked above.

Lake by lake

The deepest Minnesota records

Ordered by how much record there is behind them. The median is across every recorded year; the second figure is across the most recent 30 recorded years, which is the fairer thing to compare against a lake you know today.

Names are reproduced exactly as the source database records them, which is often a shortened form: a lake filed as “Detroit” or “George” is Detroit Lake or Lake George to everyone who lives on it. The names stay as recorded, because United States lakes split unpredictably between “Lake X” and “X Lake”.

Detroit

Lake in Minnesota · 128 recorded years, 1893 to 2020

Apr 20
median ice out
Apr 18
last 30 recorded years
Mar 23
earliest, 1910
May 17
latest, 1950

Across the whole record, ice out has moved barely at all across the record.

Freeze over has moved 11 days later per century across the record, median Nov 22.

1890sApr 221900sApr 221910sApr 161920sApr 201930sApr 191940sApr 181950sApr 261960sApr 231970sApr 251980sApr 171990sApr 192000sApr 192010sApr 16

Mean date per decade. Only decades with four or more observations are shown, and the scale starts near the shortest bar rather than at January 1, so small differences stay visible.
Green

Lake in Minnesota · 86 recorded years, 1897 to 2016

Apr 16
median ice out
Apr 12
last 30 recorded years
Mar 21
earliest, 2012
May 8
latest, 2013

Across the whole record, ice out has moved 9 days earlier per century across the record.

Freeze over has moved 3 days later per century across the record, median Dec 2.

1930sApr 141940sApr 171950sApr 211960sApr 161970sApr 201980sApr 131990sApr 152000sApr 132010sApr 11

Mean date per decade. Only decades with four or more observations are shown, and the scale starts near the shortest bar rather than at January 1, so small differences stay visible.
Osakis

Lake in Minnesota · 150 recorded years, 1867 to 2020

Apr 20
median ice out
Apr 14
last 30 recorded years
Mar 13
earliest, 1878
May 14
latest, 1950

Across the whole record, ice out has moved 6 days earlier per century across the record.

1870sApr 241880sApr 231890sApr 221900sApr 201910sApr 161920sApr 151930sApr 181940sApr 181950sApr 241960sApr 201970sApr 231980sApr 151990sApr 142000sApr 142010sApr 15

Mean date per decade. Only decades with four or more observations are shown, and the scale starts near the shortest bar rather than at January 1, so small differences stay visible.
Minnetonka

Lake in Minnesota · 144 recorded years, 1855 to 2020

Apr 14
median ice out
Apr 10
last 30 recorded years
Mar 11
earliest, 1878
May 9
latest, 1856

Across the whole record, ice out has moved 4 days earlier per century across the record.

1850sApr 251890sApr 161900sApr 141910sApr 121920sApr 151930sApr 131940sApr 131950sApr 181960sApr 141970sApr 171980sApr 111990sApr 102000sApr 102010sApr 11

Mean date per decade. Only decades with four or more observations are shown, and the scale starts near the shortest bar rather than at January 1, so small differences stay visible.

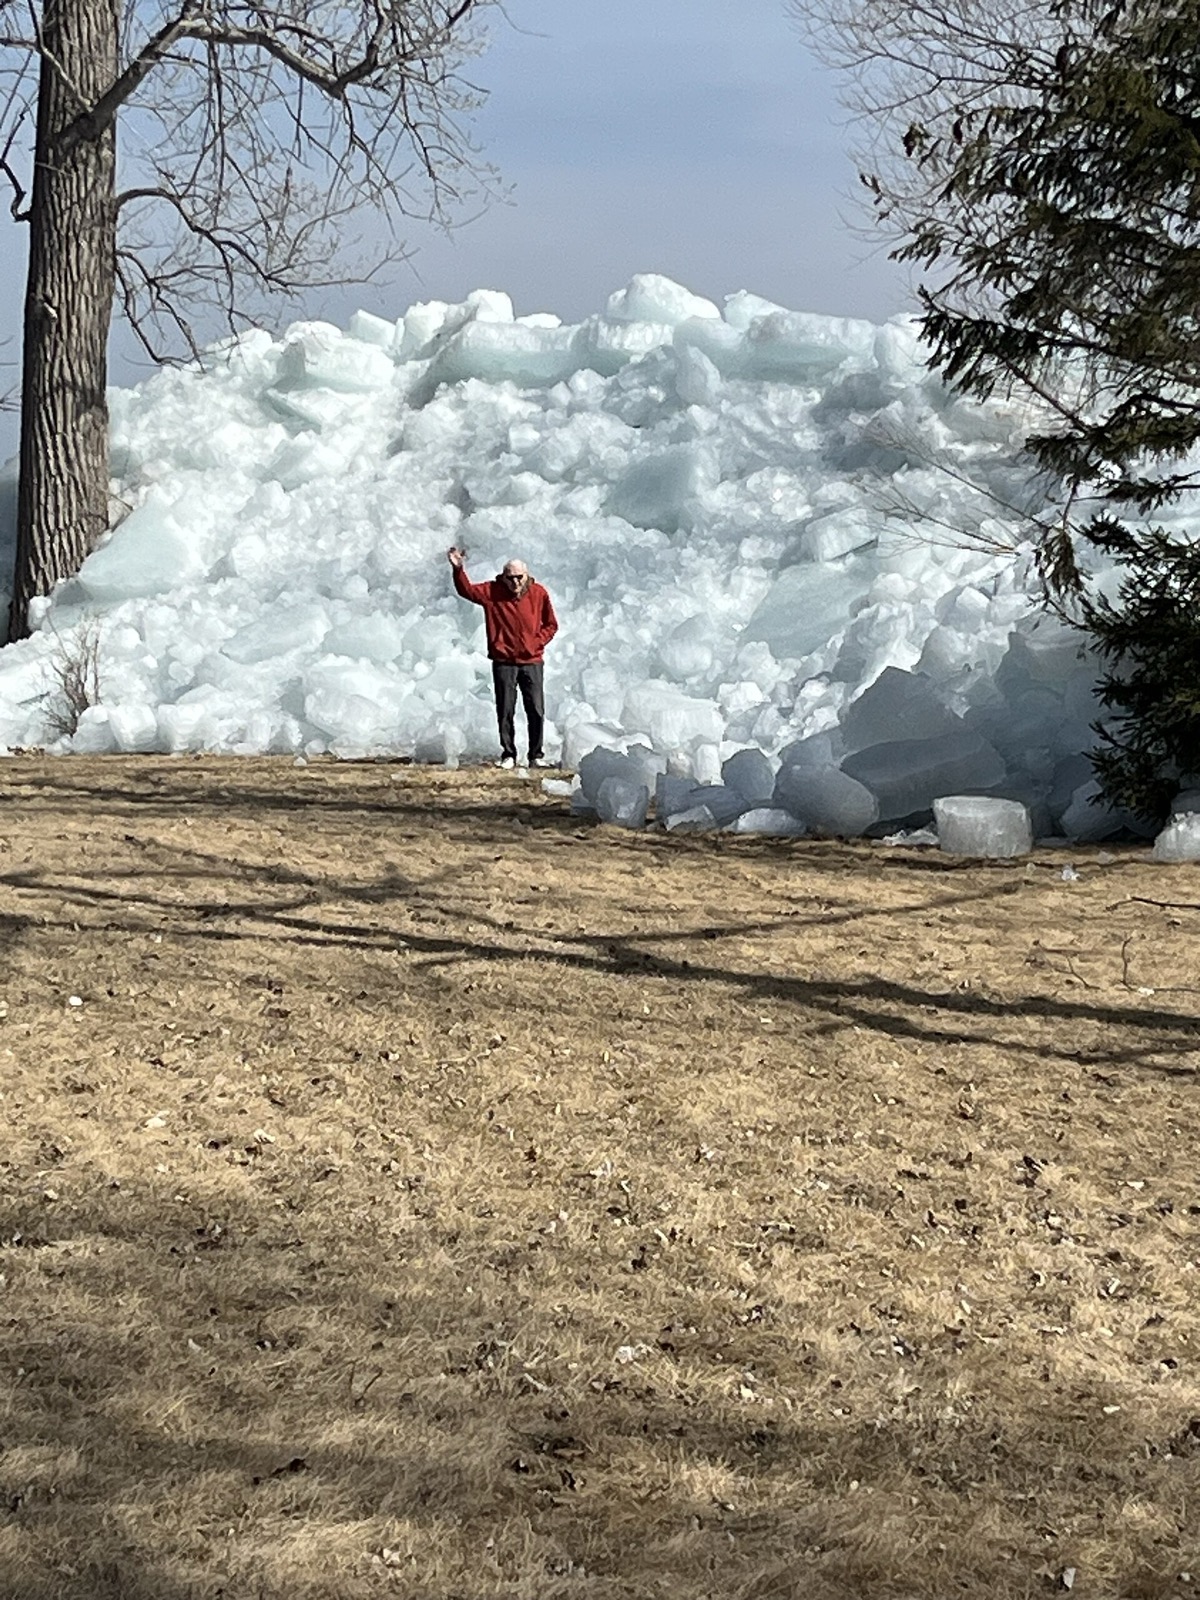
A person in a red jacket standing on brown grass at the foot of a wall of shattered lake ice piled far higher than they are
An ice shove on Lake Winnebago in Wisconsin, with a person on the bank for scale. Wind on a rotting spring sheet can drive it ashore in minutes and stack it well above head height, which is one reason a tidy single ice out date hides a genuinely messy few days. “Ice shove - Lake Winnebago, Oshkosh, WI USA - March 2025” by Jm mortellwi, CC BY-SA 4.0
Advertisement
Every lake

All 31 Minnesota water bodies with a long record

LakeRecordMedian ice outLast 30 yearsEarliestLatestChange per century
Detroit1893 to 2020 (128)Apr 20Apr 18Mar 23 1910May 17 1950-0.9 days
Green1897 to 2016 (86)Apr 16Apr 12Mar 21 2012May 8 2013-8.5 days
Osakis1867 to 2020 (150)Apr 20Apr 14Mar 13 1878May 14 1950-5.5 days
Minnetonka1855 to 2020 (144)Apr 14Apr 10Mar 11 1878May 9 1856-3.8 days
Waconia1940 to 2017 (69)Apr 12Apr 8Mar 7 2017May 1 1941record too short
Pepin1844 to 2006 (73)Apr 9Apr 4Feb 1 2000May 1 1857-11.3 days
Minnewaska1906 to 2017 (112)Apr 14Apr 10Mar 22 2012May 11 2013-0.6 days
Clear1894 to 2008 (109)Apr 3Apr 1Mar 6 1987Apr 27 1951+0.6 days
Fountain1912 to 2017 (97)Apr 6Apr 5Mar 15 1931Apr 30 1953+1.6 days
White Bear1928 to 2017 (90)Apr 12Apr 8Mar 15 2002May 4 1950-8.7 days
Vermilion1893 to 2006 (89)Apr 30Apr 29Apr 10 1945May 23 1950-2.3 days
Rainy1930 to 2016 (87)May 5May 2Apr 7 2012May 22 1950-7.8 days
Itasca1929 to 2017 (81)Apr 23Apr 20Mar 27 2012May 18 1950-6.7 days
Bemidji1932 to 2017 (80)Apr 26Apr 25Apr 3 2012May 22 1950-6.6 days
Diamond(mail)1928 to 2017 (75)Apr 12Apr 13Mar 8 2017May 7 2013-0.9 days
Leech1936 to 2005 (70)Apr 27Apr 25Apr 9 1945May 23 1950record too short
Fall1935 to 2017 (67)Apr 28Apr 25Mar 28 2012May 19 1950-11.2 days
Galpin1946 to 2014 (66)Apr 7Apr 5Mar 9 2000Apr 27 1965record too short
Kabetogama1952 to 2017 (66)Apr 30Apr 29Apr 2 2012May 19 1996record too short
Big Stone1951 to 2017 (65)Apr 10Apr 3Mar 17 2016May 8 2013record too short
Bone1942 to 2014 (65)Apr 12Apr 9Mar 16 2000Apr 30 1968record too short
Big Sandy1930 to 2017 (63)Apr 21Apr 19Mar 27 2012May 12 2013-7.6 days
Sisseton1935 to 2017 (61)Apr 3Apr 2Mar 13 1990Apr 26 1951-4.7 days
Gull1950 to 2017 (55)Apr 21Apr 19Mar 27 2012May 18 1950record too short
Mille Lacs1956 to 2017 (55)Apr 24Apr 24Mar 27 2012May 16 2013record too short
Shagawa1965 to 2017 (51)Apr 27Apr 26Mar 28 2012May 17 1996record too short
Buffalo1953 to 2017 (50)Apr 11Apr 9Mar 7 2017May 2 2013record too short
Shetek1960 to 2016 (49)Apr 3Apr 2Mar 9 2000Apr 24 1962record too short
Lizzie1950 to 1995 (46)Apr 21Apr 19Apr 4 1981May 14 1950record too short
Winsted1887 to 2016 (44)Apr 12Apr 10Mar 9 1987Apr 29 2013-6.4 days
Gunflint1940 to 2016 (41)May 6May 5Mar 24 2012May 26 1966record too short

Dates are day of year, rendered on a common non leap calendar so the same stored value always reads the same way. “Change per century” is a least squares line through the observations, shown only where a record spans 80 years or more; a century figure extrapolated from a 40 year window describes the decades that happened to be sampled rather than the lake. Where a record ends before 2010 the card says so; a great many of these series stopped when a particular person stopped keeping them.

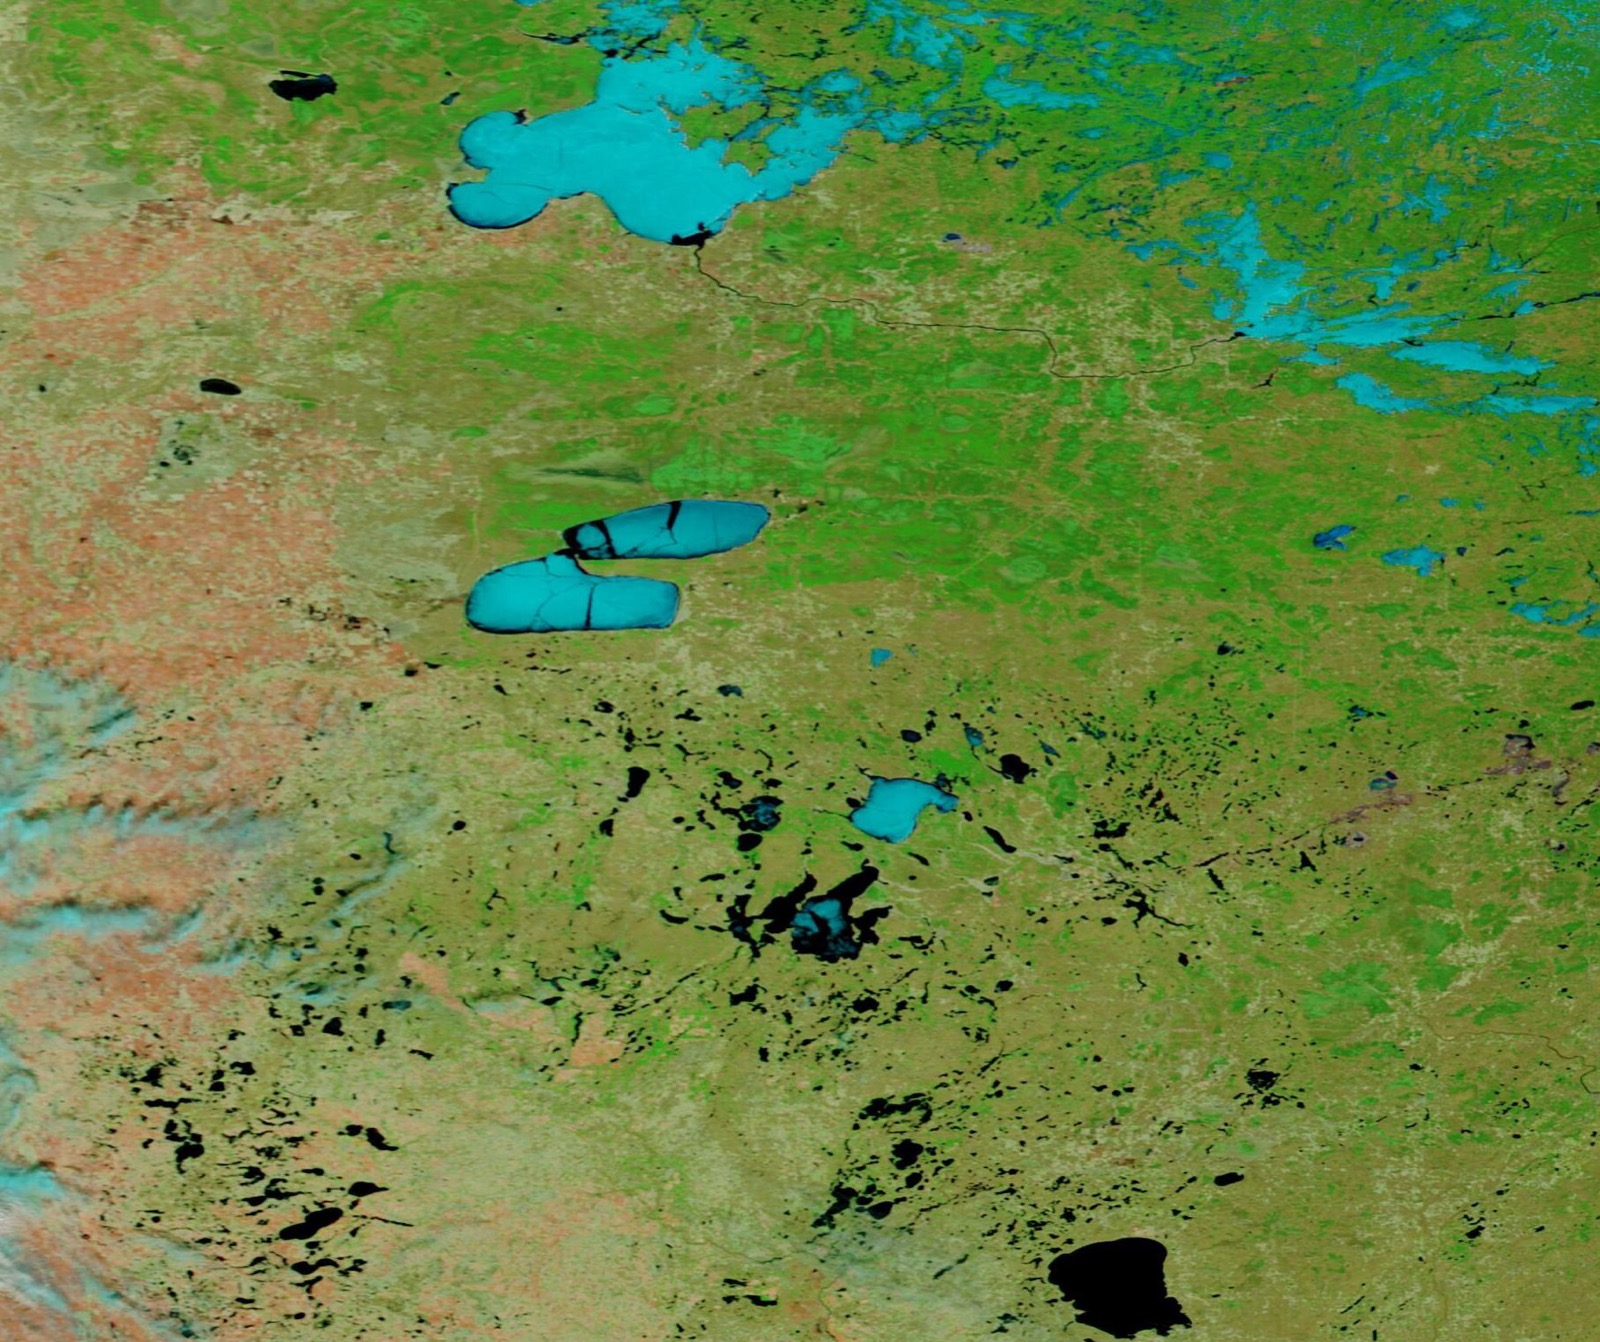
False colour satellite view of Minnesota in spring, with ice covered lakes showing as pale cyan and lakes that have already opened showing as black, against green and tan land
Spring thaw over Minnesota, in false colour. Ice still on a lake reads pale cyan; a lake that has already opened reads black. You can watch ice out happen across a whole state in a single frame, which is how agencies now sanity check reports that used to come only from people standing on a shore. “Spring Thaw in Minnesota (MODIS 2025-04-30)” — MODIS Land Rapid Response Team, NASA GSFC — Public domain
What the record says

What the Minnesota record shows

Of the 18 Minnesota lakes with a record long enough to state a century trend, 16 show ice out moving earlier. The median shift across those lakes is -5.5 days per century. That is a description of a line fitted to observations, not a forecast, and any single lake can and does swing three or four weeks between consecutive years.

4 of these Minnesota water bodies also carry a freeze over record. Freeze up is the harder half to observe and there is far less of it nationally, which is a shame, because in this dataset it moves more than ice out does.

Minnesota DNR defines ice-out as the lake being completely free of ice, and ice-in as the whole lake frozen over with the cover holding through winter.

Ice-out is a statewide countdown. The DNR asks the public to report ice-out on their own lake, which is why Minnesota has more reporting lakes than anywhere else in the country. In a warm spring the reports come in from the south and sweep north over about three weeks.

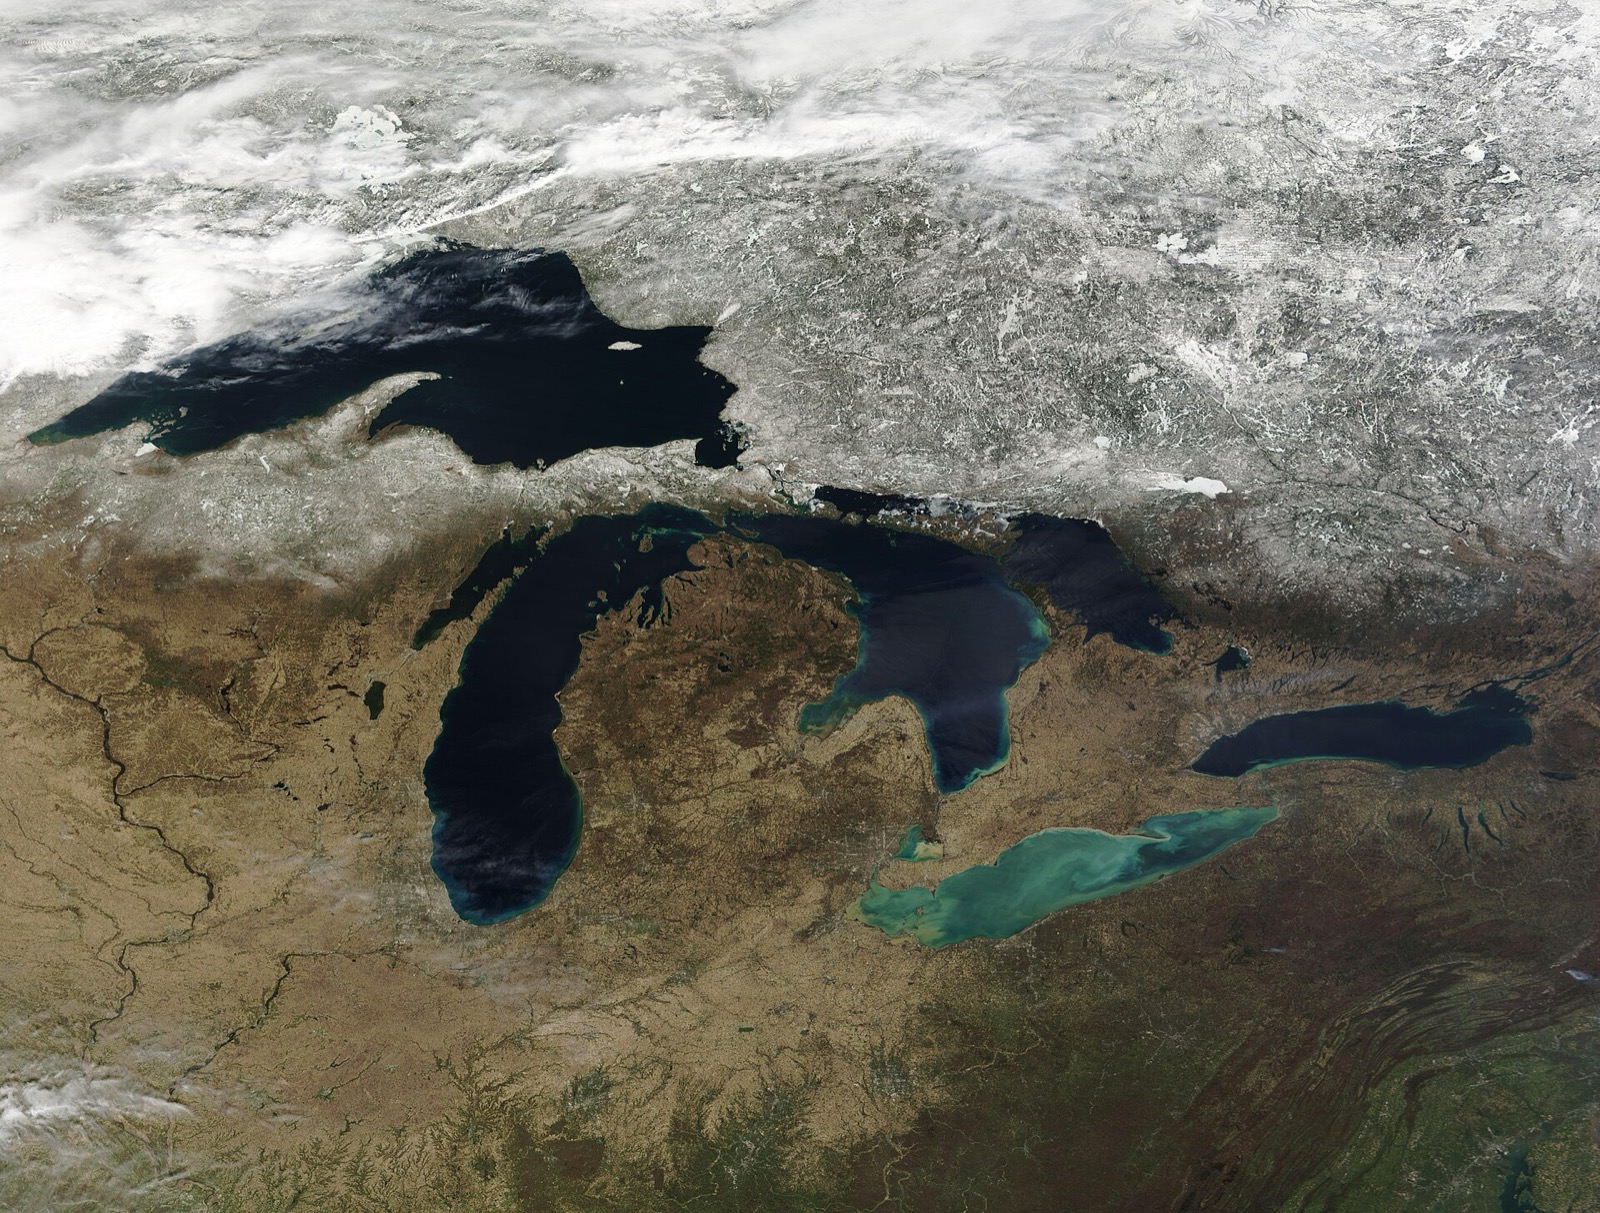
Satellite view of the Great Lakes with the northern land still under snow, the lakes themselves dark open water, and pale green sediment plumes in the shallow western basin of Lake Erie
The Great Lakes with snow still lying on the land north of them and no ice left on the water. On a lake this size, freezing over and opening are not single moments: shallow bays close first, the deep middle may never freeze at all in a mild winter, and the date somebody writes down is a judgement call. “Spring Thaw across the Great Lakes (MODIS)” — MODIS Land Rapid Response Team, NASA GSFC — Public domain
Provenance

Where these Minnesota numbers came from

The observations

Benson, B., Magnuson, J. and Sharma, S. (2000). Global Lake and River Ice Phenology Database. (G01377, Version 1). Boulder, Colorado USA. National Snow and Ice Data Center. https://doi.org/10.7265/N5W66HP8 Accessed 2026-08-24.

Osakis has been reporting ice-out since 1867 and Minnetonka since 1855, which puts both among the oldest continuously observed lakes in the United States.

Common questions

Minnesota lake ice FAQ

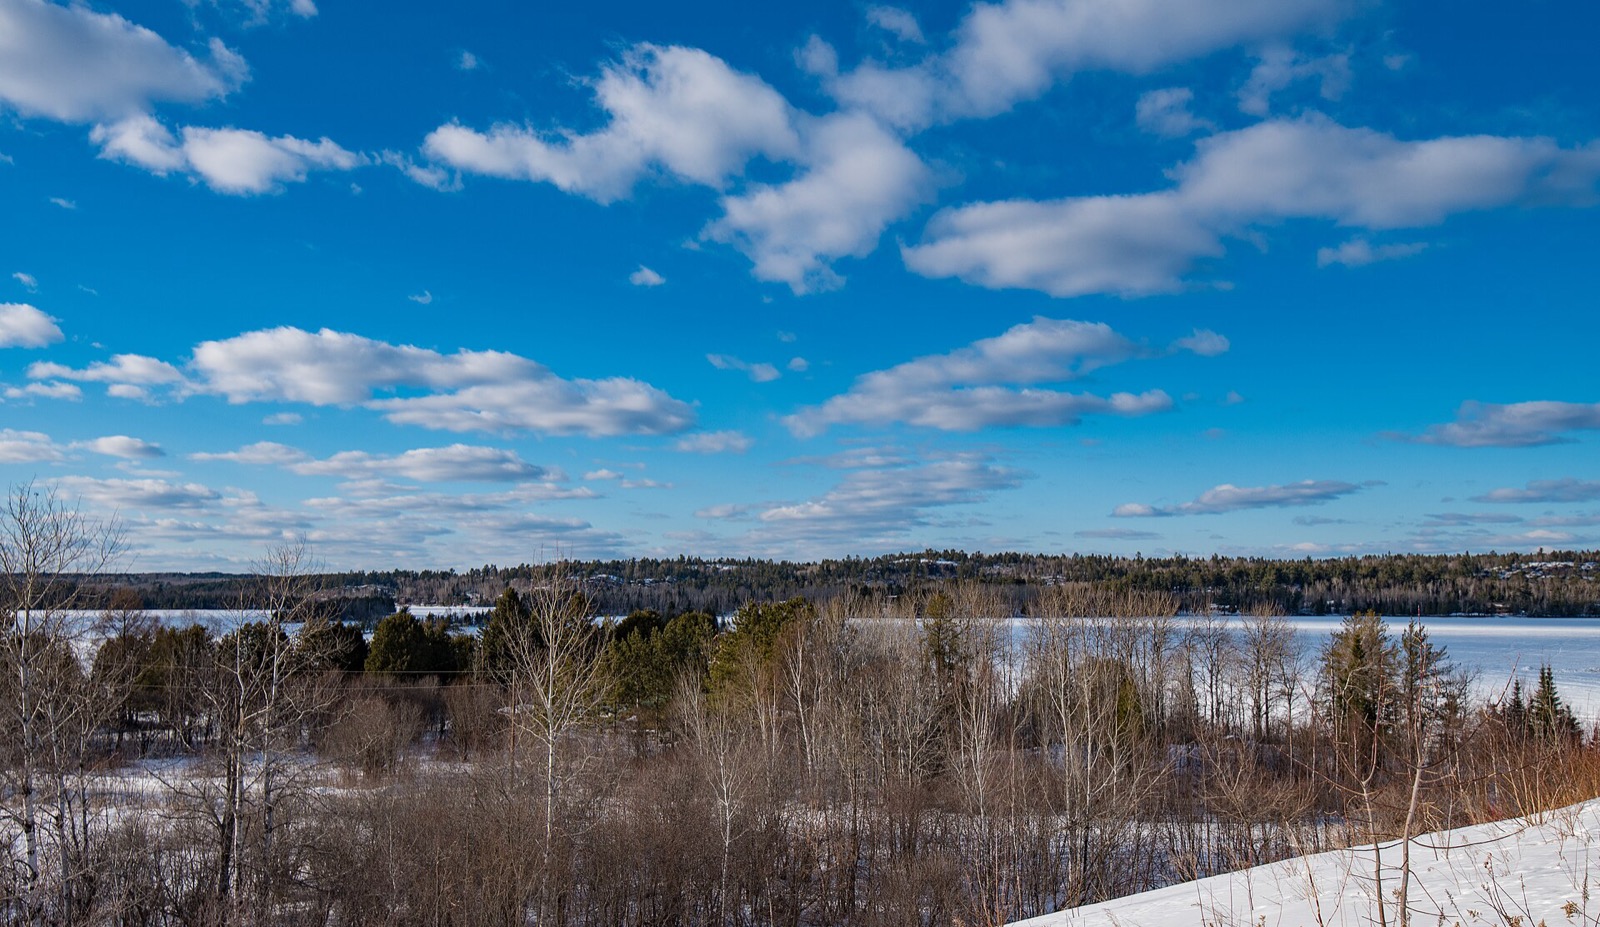
A snow covered frozen lake surrounded by bare trees and dark conifers under a pale winter sky
Minnesota water. Ice out is the day this becomes possible again, and in most of these records it is the day somebody decided a boat could cross. “Shagawa Lake - Frozen in Winter - Ely, Minnesota (44605661414)” by Tony Webster from Minneapolis, Minnesota, United States, CC BY 2.0
The rest of the Minnesota year

Plan the rest of your Minnesota calendar

More Midwest states with lake ice records

Advertisement

Ice out and ice in dates are historical observations compiled by the National Snow and Ice Data Center and, for the New England lakes, by the U.S. Geological Survey. They describe past years only, and a past year says nothing about the ice on a lake today. For current ice and for anything involving going out on it, contact Minnesota DNR ice safety. National picture: every state with a lake ice record →
Hero image: “Shagawa Lake - Frozen in Winter - Ely, Minnesota (44605661414)” by Tony Webster from Minneapolis, Minnesota, United States, CC BY 2.0