
Florida Red Tide Status
What FWC Fish and Wildlife Research Institute is reporting today, reproduced as issued, and when blooms normally happen on this coast.
Reading the latest FWC sampling for Florida…Florida bloom status at a glance
Live · agency status, as issuedFlorida is the only state with two independent live agency feeds behind its page: FWC publishes the cell counts and NOAA publishes a separate beach level forecast of what those counts will do to the air. They are different scales measuring different things, so both are shown, each labelled with the agency that issued it.
What the agencies are reporting in Florida right now
Every value below is reproduced from the agency that issued it, exactly as that agency wrote it, with the time attached. On a health subject the official category is the answer, and it can change from one sampling site to the next a few miles down the same coast.
FWC sampling, last eight days
The Florida Fish and Wildlife Conservation Commission samples for Karenia brevis statewide and publishes a categorical abundance for every sample. The table shows the highest category each county reported rather than an average, so the one sample a reader needs to see is never buried. Source: the FWC-FWRI HAB Monitoring Database.
This sampling export carries no readable timestamp. Check it directly with FWC before relying on it.
Reading the latest FWC sampling…
NOAA beach respiratory irritation forecast
NOAA’s National Centers for Coastal Ocean Science runs a separate forecast at named beaches, combining the latest cell counts with forecast wind to say what people standing on that specific sand are likely to feel. It is a different scale from the FWC cell counts and it measures a different thing, so the two are shown separately and each is labelled with the agency that issued it. NOAA only runs stations where it has something to forecast, so this list changes.
This model run carries no readable timestamp. Check it directly with NOAA NCCOS before relying on it.
Reading the NOAA respiratory irritation forecast…
What FWC’s categories actually mean
The single most important thing on this page is that the numbers are not linear and the effects are not proportional. FWC associates shellfish closures with counts starting at 5,000 cells per litre, which sits inside its very low band, while water discoloration, the thing most people think of as red tide, only shows up in the top band at over a million cells per litre. Clear water is not evidence of a clear beach.
| FWC category | Cells per litre | Effects, in FWC’s words |
|---|---|---|
| Not present or background | up to 1,000 cells per litre | no effects anticipated |
| Very low | more than 1,000 up to 10,000 cells per litre | possible respiratory irritation; shellfish harvesting closures when cell abundance equals or exceeds 5,000 cells per litre |
| Low | more than 10,000 up to 100,000 cells per litre | respiratory irritation; shellfish harvesting closures; possible fish kills; probable detection of chlorophyll by satellites at upper range |
| Medium | more than 100,000 up to 1,000,000 cells per litre | respiratory irritation; shellfish harvesting closures; probable fish kills; detection of surface chlorophyll by satellites |
| High | more than 1,000,000 cells per litre | respiratory irritation; shellfish harvesting closures; probable fish kills; detection of surface chlorophyll by satellites; water discoloration |
Quoted verbatim from the Florida Fish and Wildlife Conservation Commission red tide current status page, myfwc.com/research/redtide/statewide.
When blooms normally happen in Florida
“Red tides most often form in late summer and early fall and persist through winter to spring.”Florida Fish and Wildlife Conservation Commission, source
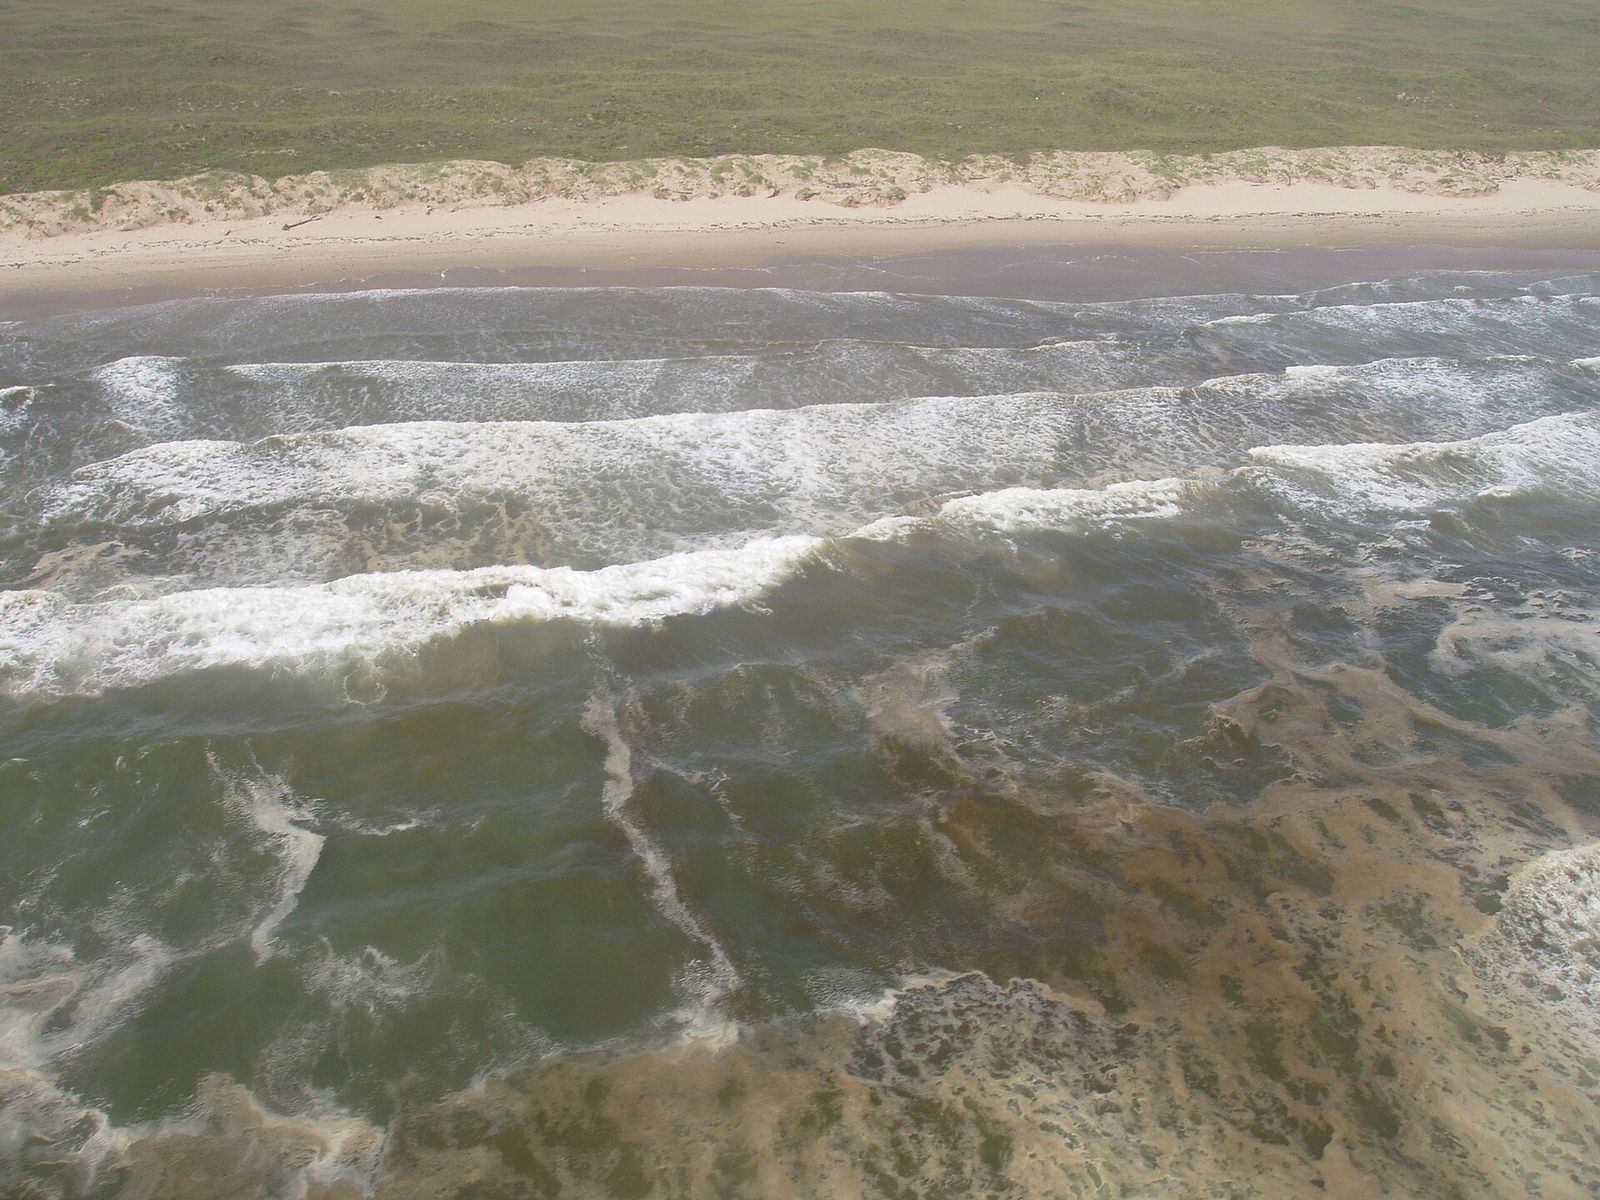
FWC puts the usual onset in late summer or early fall and says blooms persist through winter into spring, which is why a Florida red tide often runs through the winter tourist season rather than the summer one. A quiet August says nothing about November.
How often the agency samples
“This map contains the last eight days of sampling and is updated daily at 5 p.m. Reports are updated on Friday afternoon except during holidays, in which case the report will be released on the closest day.”Florida Fish and Wildlife Conservation Commission, source
Where it starts
“Florida's red tides begin in nutrient-poor water 18 to 74 kilometers (11 to 46 miles) offshore.”Florida Fish and Wildlife Conservation Commission, source
That distance is why a bloom can be well established before anyone on a beach notices it, and why the wind direction on the day matters as much as the cell count in the water.
The event people remember
“An unusually persistent harmful algal bloom (red tide) affected portions of the coasts of Florida between 2017-2018, dissipating in the winter of 2018/2019. It persisted on the southwest coast beginning in October 2017 and spread to the Panhandle and the east coast of Florida.”NOAA National Ocean Service, source
The sentence FWC Fish and Wildlife Research Institute most wants you to read
Reproduced verbatim, in the agency’s own words.
“Red tide can cause skin irritation, rashes, and burning/sore eyes. Do not swim in or around red tide.”Florida Fish and Wildlife Conservation Commission, source
Which part of the Florida coast, and what you would notice
“They are most common off the central and southwestern coasts of Florida between Clearwater and Sanibel Island.”Florida Fish and Wildlife Conservation Commission, source
What people actually notice
- A dry, tickling cough and burning eyes on the beach, which comes from toxin carried inland in sea spray rather than from anything you touched
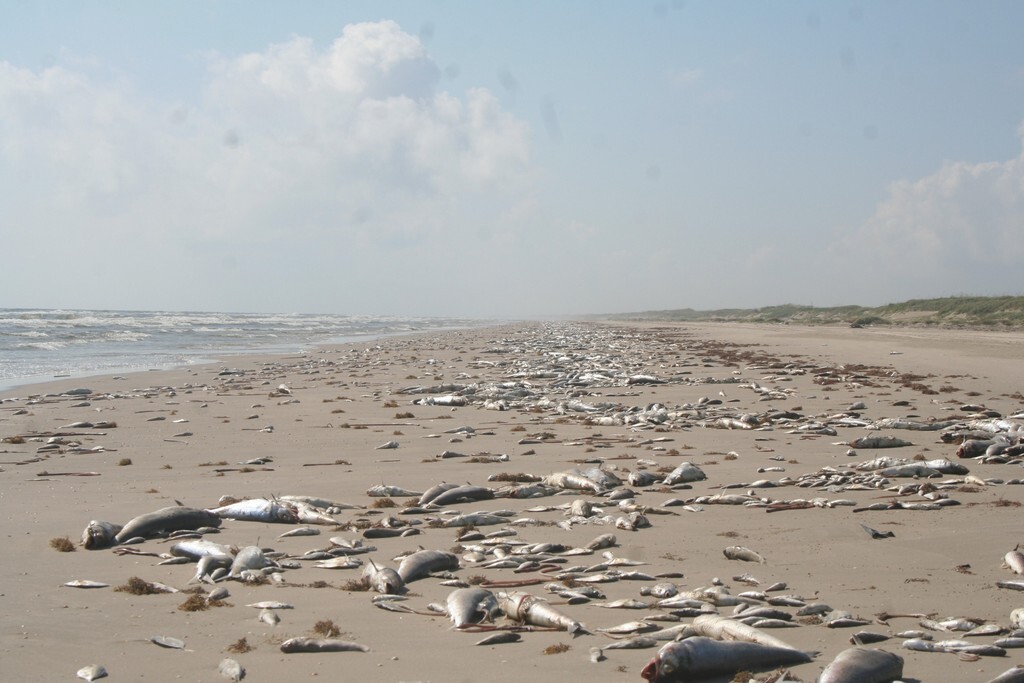
- Dead fish along the tide line, which FWC associates with its low category and above
- Water discoloured brown, rust or red, which FWC associates only with its highest category, so clear looking water is not evidence of a clear beach
- An onshore wind, which is what moves an offshore bloom into the air people are breathing
Beaches worth checking the status for
Clearwater Beach
Pinellas County. A named station in the NOAA respiratory irritation forecast, and the northern anchor of the stretch FWC names as most bloom prone.
Siesta Key
Sarasota County. Sits in the middle of the Clearwater to Sanibel stretch FWC names, and Sarasota is consistently one of the most heavily sampled counties in the FWC feed.
Fort Myers Beach and Lovers Key
Lee County. Lovers Key State Park is a named NOAA forecast station, and Lee County sits at the southern end of the stretch FWC names.
Sanibel and Captiva
Lee County. Lighthouse Beach, Tarpon Bay Road Beach and Alison Hagerup Beach Park are all named NOAA forecast stations on these two islands.
Naples and Bonita Beach
Collier and Lee Counties. Bonita Beach Park is a named NOAA station, and Collier County appears regularly in the FWC sampling feed.
Navarre and the Panhandle
Santa Rosa County. Navarre Pier is a named NOAA station. NOAA notes blooms occasionally reach the Panhandle, as the 2017 to 2019 event did.
Florida shellfish harvest closures
Shellfish harvest closures
Harvest closures are legal orders issued by a state health or agriculture department, and they change without warning. The current closure status is published by the agency below. Check it directly, every time, on the day you are going.
FWC states that shellfish harvesting closures follow when Karenia brevis abundance equals or exceeds 5,000 cells per litre, which sits inside its very low category. A count that looks small on a map can still close a bed.
Florida Department of Agriculture and Consumer Services, Division of Aquaculture · Official closure information
The agency’s own published guidance on harvest safety, quoted:
“Store-bought and restaurant-served shellfish are generally safe to eat during a bloom because the shellfish are monitored by the government for safety.”Florida Fish and Wildlife Conservation Commission, source
That sentence concerns monitored commercial product, not anything harvested recreationally, and recreational harvest is exactly what the closure orders exist for.
Who to contact in Florida
Health questions, whether a specific beach is open, and anything to do with harvesting are answered by these agencies. Each is linked, with a phone number where one is published.
FWC Fish and Wildlife Research Institute
Runs the statewide Karenia brevis sampling programme and publishes the current status report and the daily sample map. This is the agency whose categories this page reproduces.
Status reports issued Friday afternoons. The sample map is updated daily at 5 p.m. Eastern.
NOAA NCCOS harmful algal bloom forecast
Runs the beach level respiratory irritation forecast for named Florida beaches, combining the latest cell counts with forecast wind. This page reproduces its categories for every station NOAA is running today.
Model run daily, with a forecast horizon a little over a day long.
FWC Fish Kill Hotline
Takes public reports of fish kills, diseased fish and fish with other abnormalities. A public report is often how a bloom gets sampled in the first place, so this is the most useful number on the page.
Florida Department of Agriculture and Consumer Services, Division of Aquaculture
Classifies shellfish harvesting areas and opens and closes them. This is the agency that decides whether shellfish can be taken, and the only one whose answer counts. Do not attribute shellfish closures to FWC.
Florida Poison Control Centers
FWC directs anyone who believes they are experiencing health effects from contact with red tide to call Poison Control. If you are struggling to breathe, this number and a doctor come before any web page.
What each organism here does
- Karenia brevis, Florida red tide. Produces brevetoxins, which agencies associate with respiratory irritation, and neurotoxic shellfish poisoning from contaminated shellfish.
- Pyrodinium bahamense, a saxitoxin producing alga of the Indian River Lagoon. Produces saxitoxins, which agencies associate with paralytic shellfish poisoning from contaminated shellfish and pufferfish.
- Pseudo-nitzschia, a group of marine diatoms. Produces domoic acid, which agencies associate with amnesic shellfish poisoning.
Florida red tide FAQ
More for a Florida coast day
Red tide and algal blooms in other states
Karenia brevis sample categories on this page are reproduced from the FWC-FWRI HAB Monitoring Database, read live in your browser and shown exactly as FWC published them, with FWC's export time attached. The beach respiratory irritation forecast is reproduced from the NOAA National Centers for Coastal Ocean Science station product, released by NOAA under CC0 1.0. Season windows are climatological typicals drawn from the agency quotations above, not forecasts. Whether a beach is open and whether shellfish can be harvested are answered by the agencies named above. National picture: red tide and algal bloom status across the country →
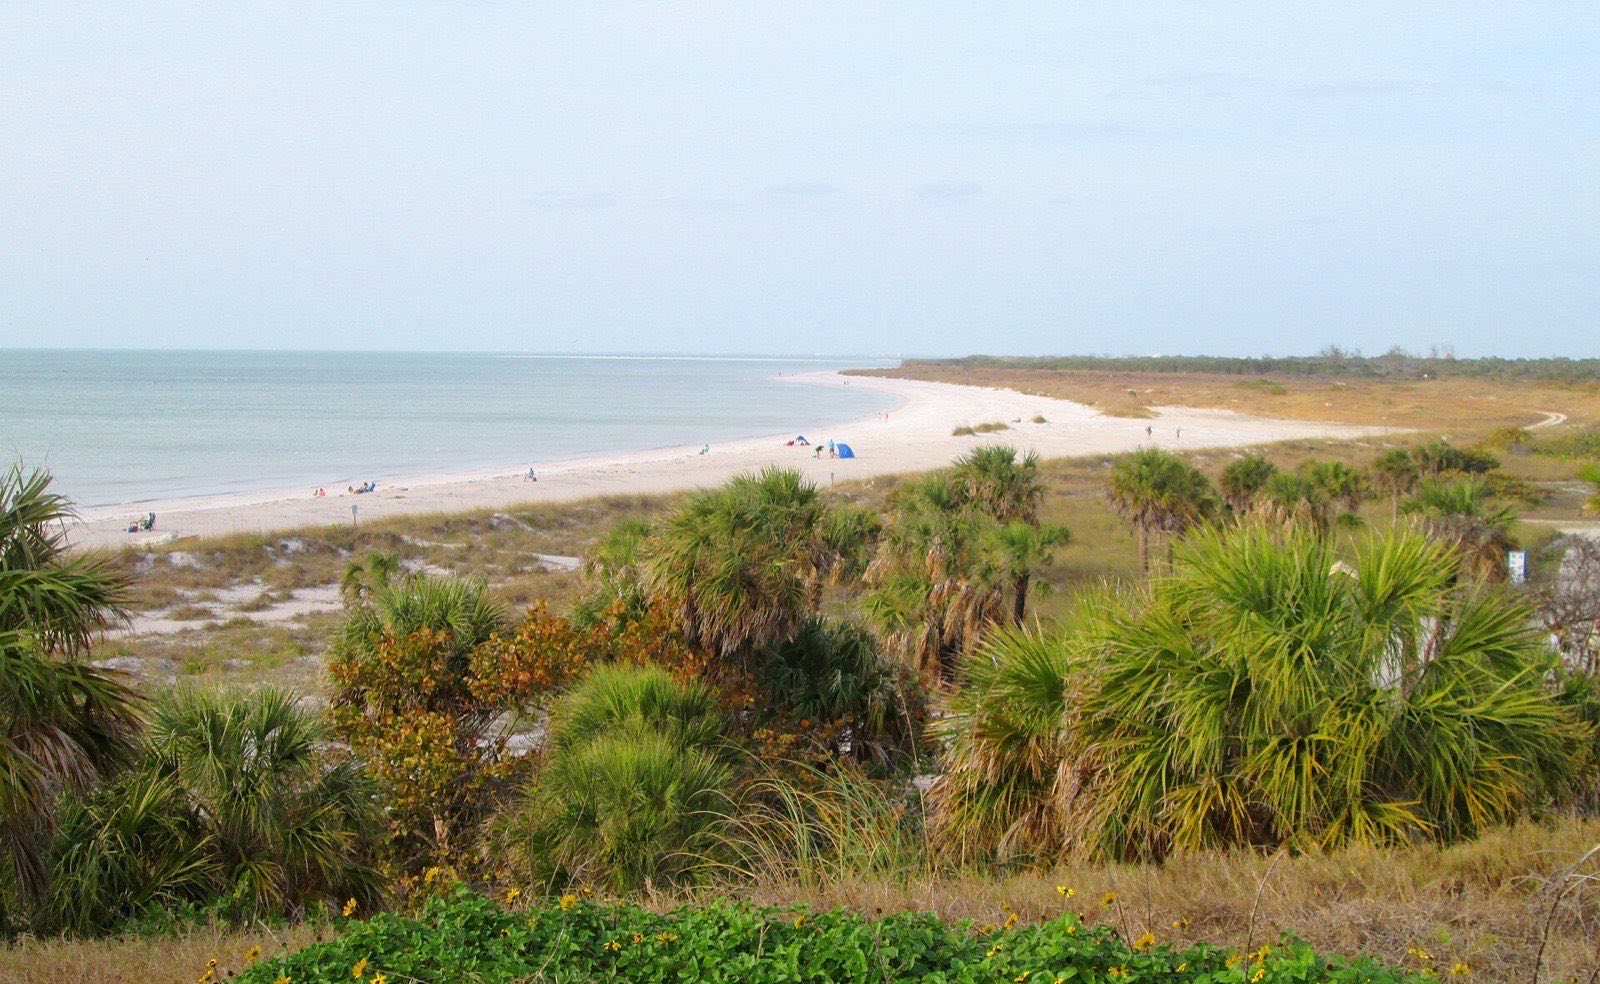
Hero image: “2018 Fort De Soto - South Beach” by Beyond My Ken, CC BY-SA 4.0