
New York Lake Effect Snow
Two belts, two personalities: the Lake Erie belt from Buffalo south through Chautauqua County, and the Lake Ontario belt from Rochester through Oswego County up onto the Tug Hill Plateau, the snowiest terrain east of the Rockies.
Driven by Lake Erie and Lake OntarioNew York snowbelt at a glance
NOAA NCEI normals, 1991-2020Seasonal snowfall normals from NOAA NCEI’s 1991-2020 U.S. Climate Normals, each attributed to its named station. Belt gradients are sharp enough that these single stations understate or overstate nearby towns by feet per season.
Where and why lake effect snow hits New York
New York holds the sharpest lake effect contrast in the country. The Erie belt produces violent early-season events over the Buffalo Southtowns, then fades as the shallow lake ices over, usually by mid or late winter. The Ontario belt keeps producing into March because the deeper lake stays open, which is why Tug Hill towns and Syracuse accumulate such enormous season totals.
The setup
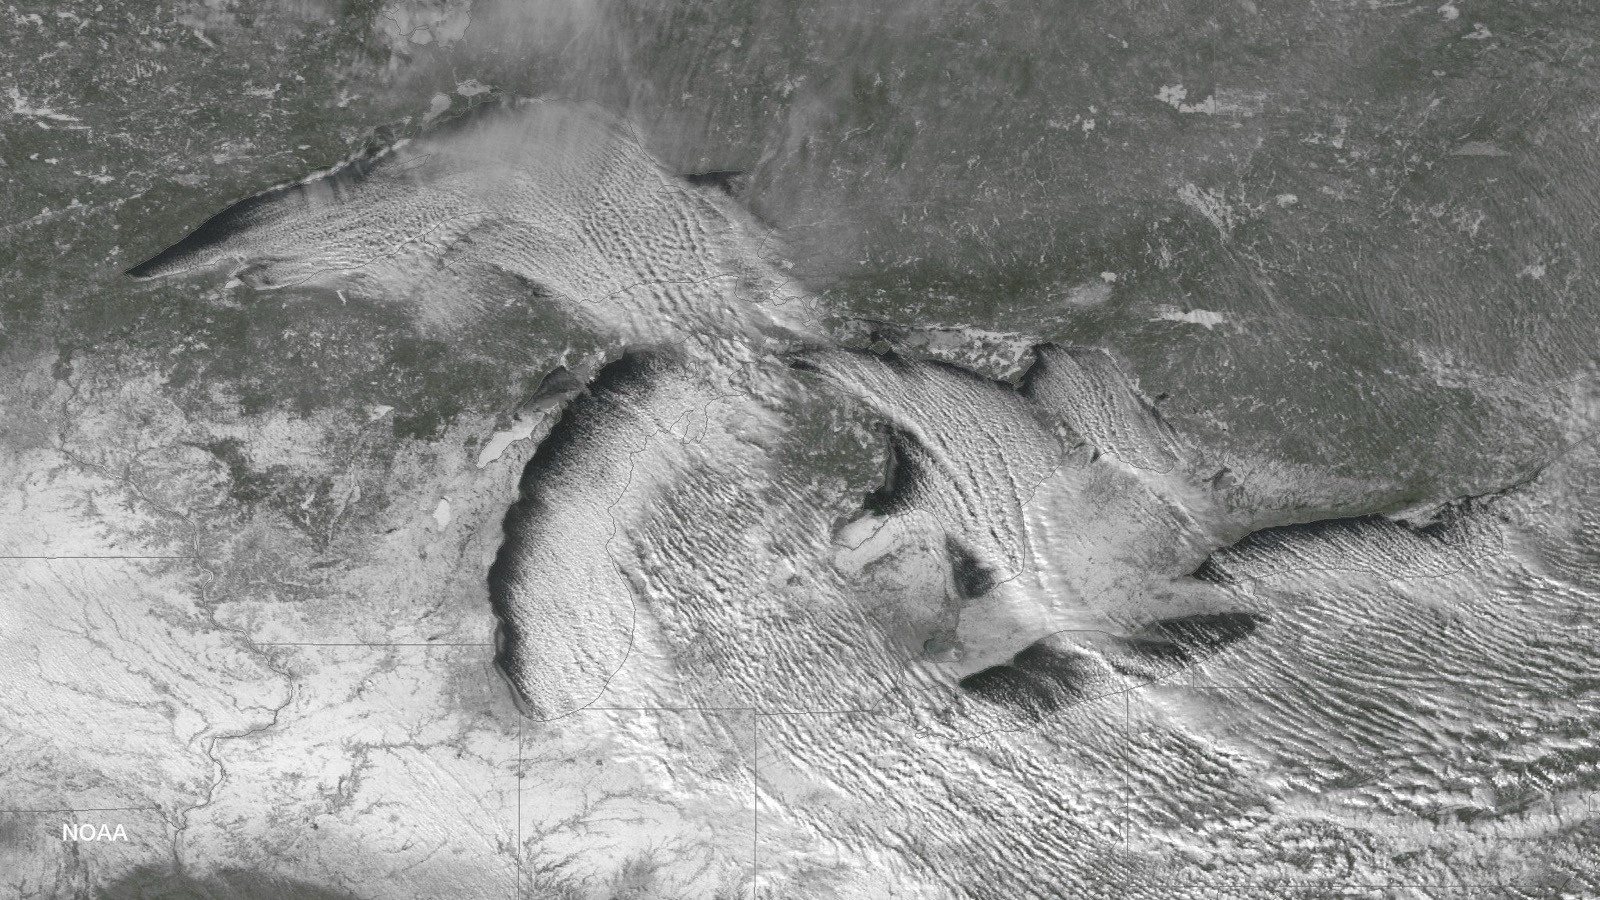
Southwest flow down the 240 mile axis of Lake Erie, which builds single intense bands aimed at the Buffalo metro.
The geography
West to northwest flow across Lake Ontario, feeding bands into Oswego County and lifting them 1,800 feet up the Tug Hill Plateau.
The off switch
Lake Erie freezes in most winters and its snow machine stops; Lake Ontario almost never does, so its belt runs all season.
“The epic November 17-19th 2014 lake effect event will be remembered as one of the most significant winter events in Buffalo's snowy history. Over 5 feet of snow fell over areas just east of Buffalo, with mere inches a few miles away to the north.”
NWS Buffalo, Lake Effect Summary for November 17-19, 2014
New York snowbelt cities
Each city page carries monthly NOAA normals for its named station, the local mechanism, and the live NWS product feed.
The season shape, at Boonville
NWS winter products active in New York right now
Every active NWS winter product whose zones touch New York, read live from api.weather.gov and reproduced exactly as issued, with issuer and timestamps.
Checking api.weather.gov for active winter weather products…
Why the mixed product names: for the 2017-2018 winter the NWS consolidated its lake effect products into the general winter suite. The Lake Effect Snow Warning came back on October 1, 2019, but per Service Change Notice 19-63 its use is “optional at Regional discretion” and offices may still issue Winter Storm Warnings “with the lake effect component specified in the ‘What’ section”. The old Lake Effect Snow Watch and Advisory were never reinstated. So this page passes through every winter product for the area and tags the ones whose own NWS text names lake effect.
Whiteout and travel decisions belong with the National Weather Service (weather.gov winter safety) and the New York 511 system (511 road conditions). NWS products above are reproduced as issued.
Documented New York lake effect events
November 17-19, 2014: the Snowvember storm
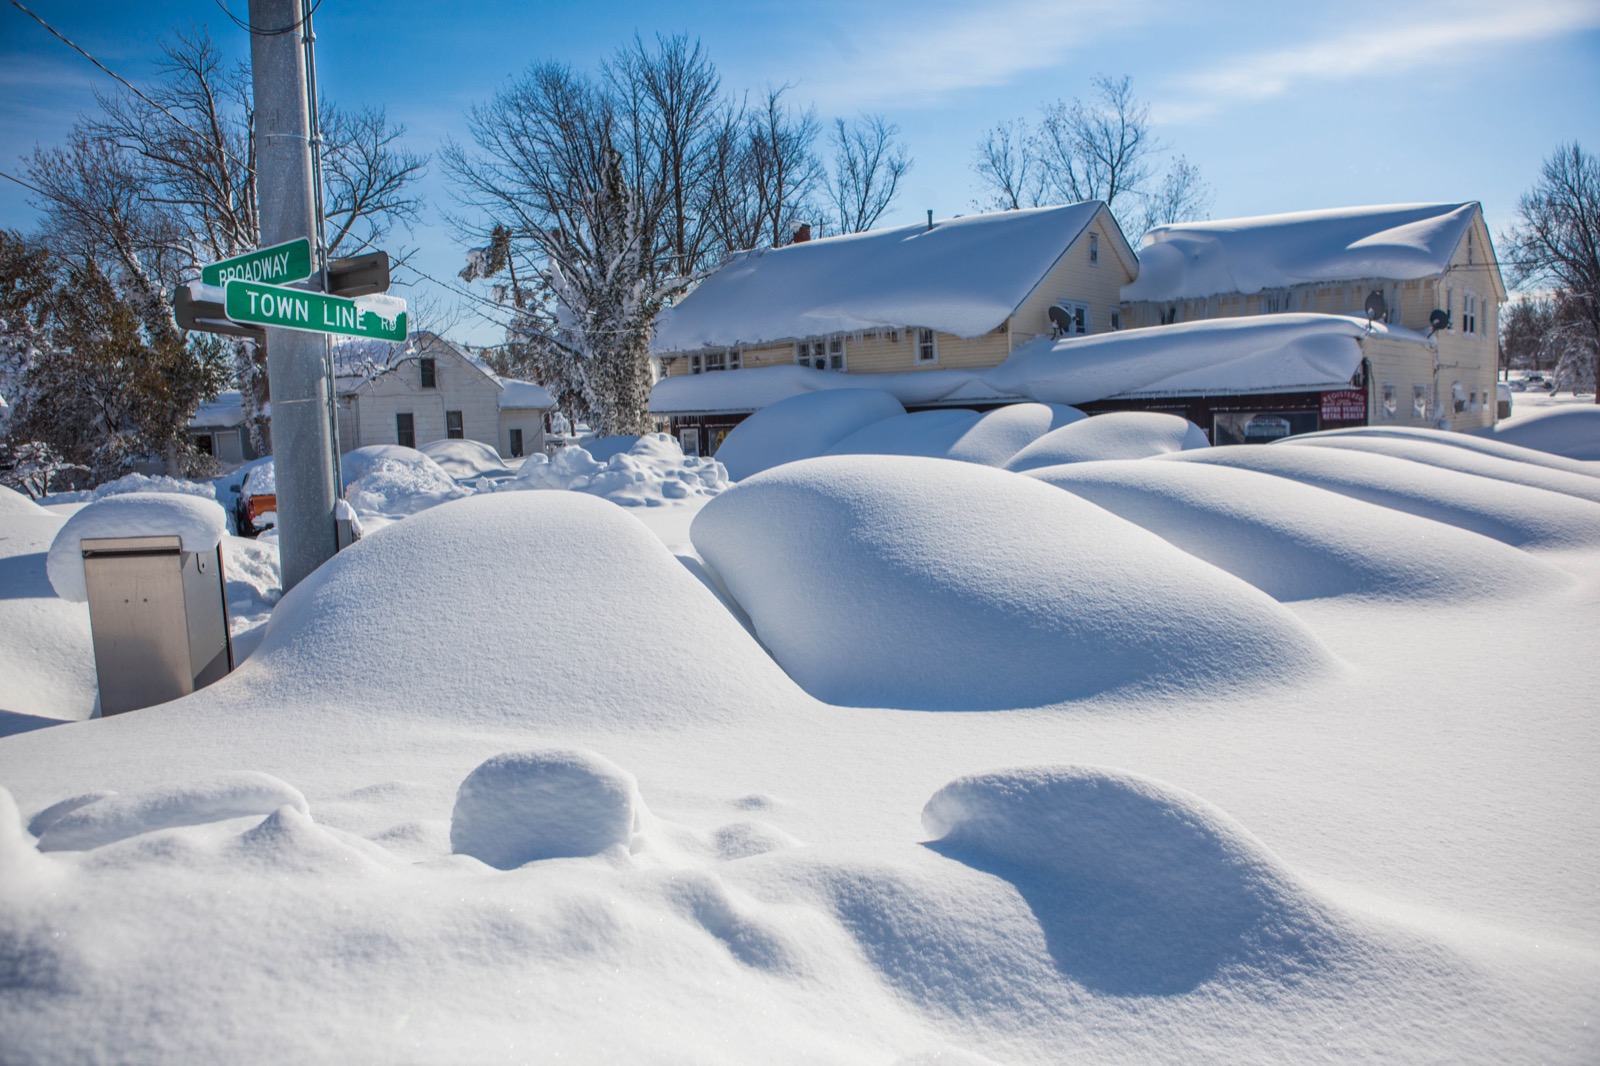
NWS Buffalo measured a maximum of 65 inches at South Cheektowaga from the first band alone, with rates of 3 to 6 inches per hour in a band only 15 to 20 miles wide. Its summary reports 13 fatalities, hundreds of roof collapses, and thousands of stranded motorists. A second event on November 19-21 stacked storm totals to nearly 7 feet in the same towns. (NWS Buffalo event summary)
November 2022: a record November event
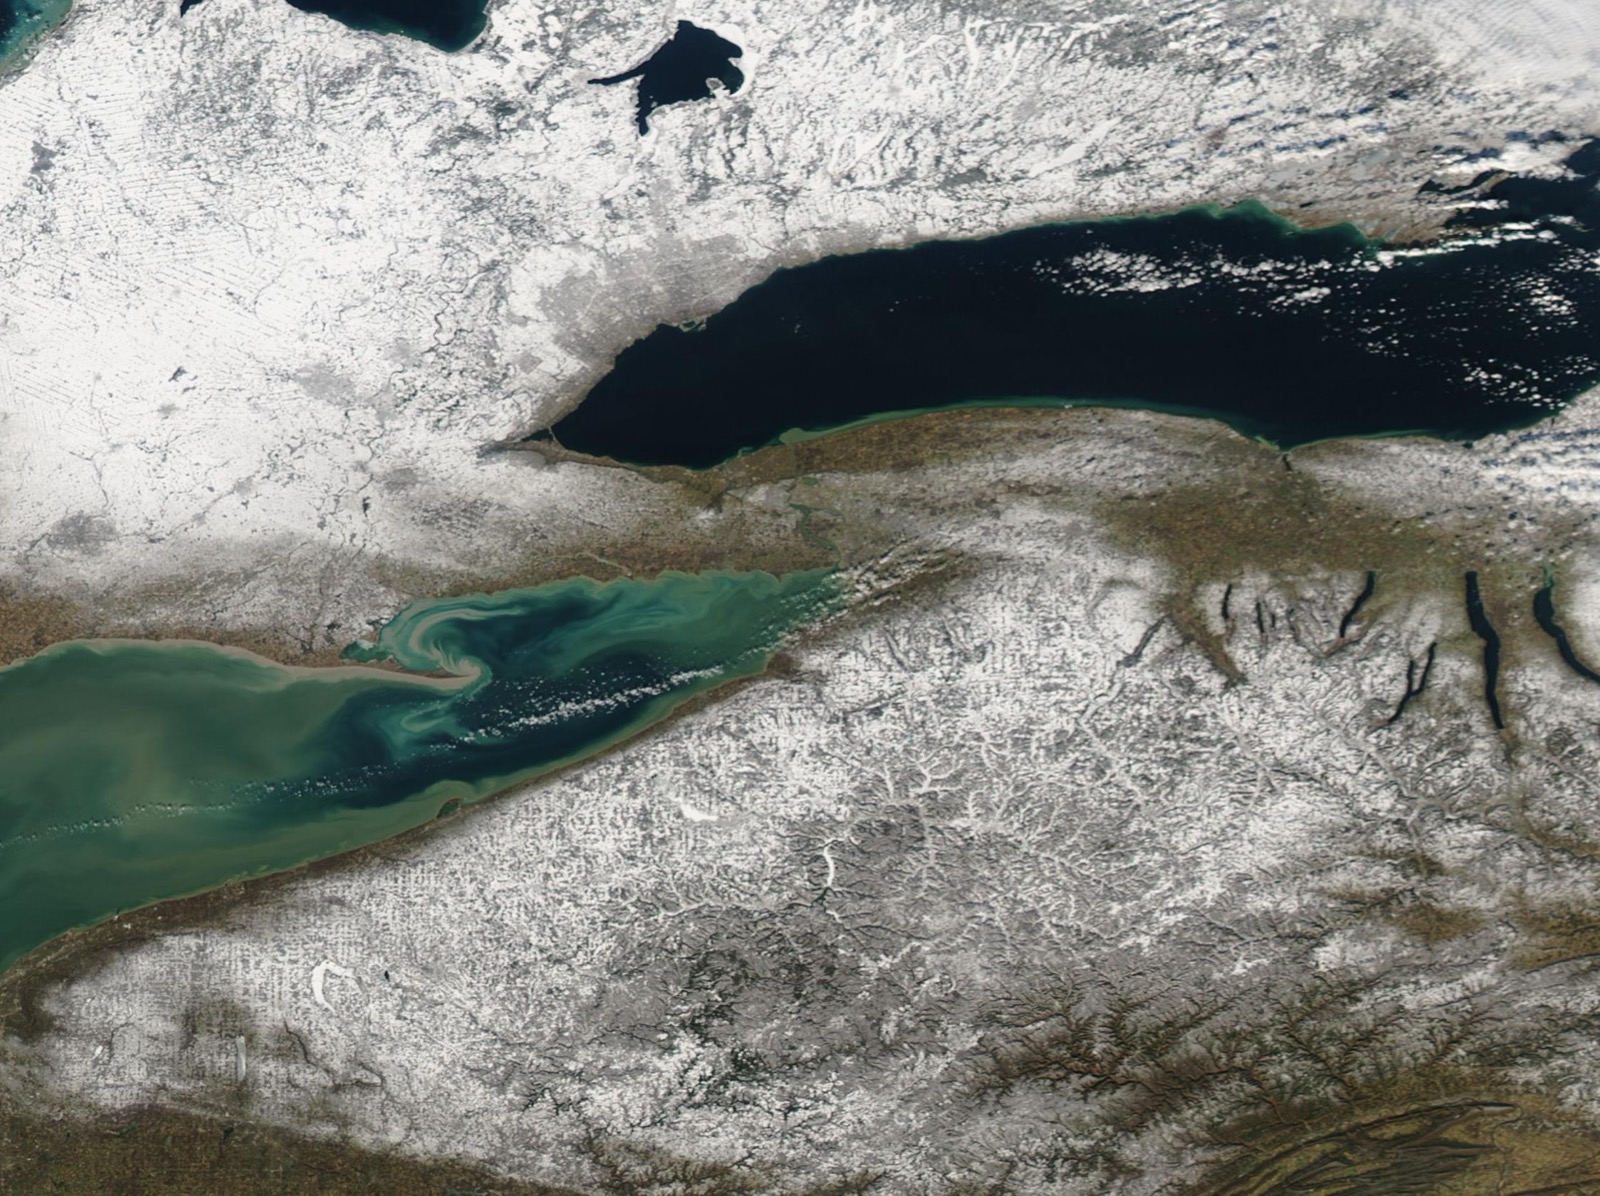
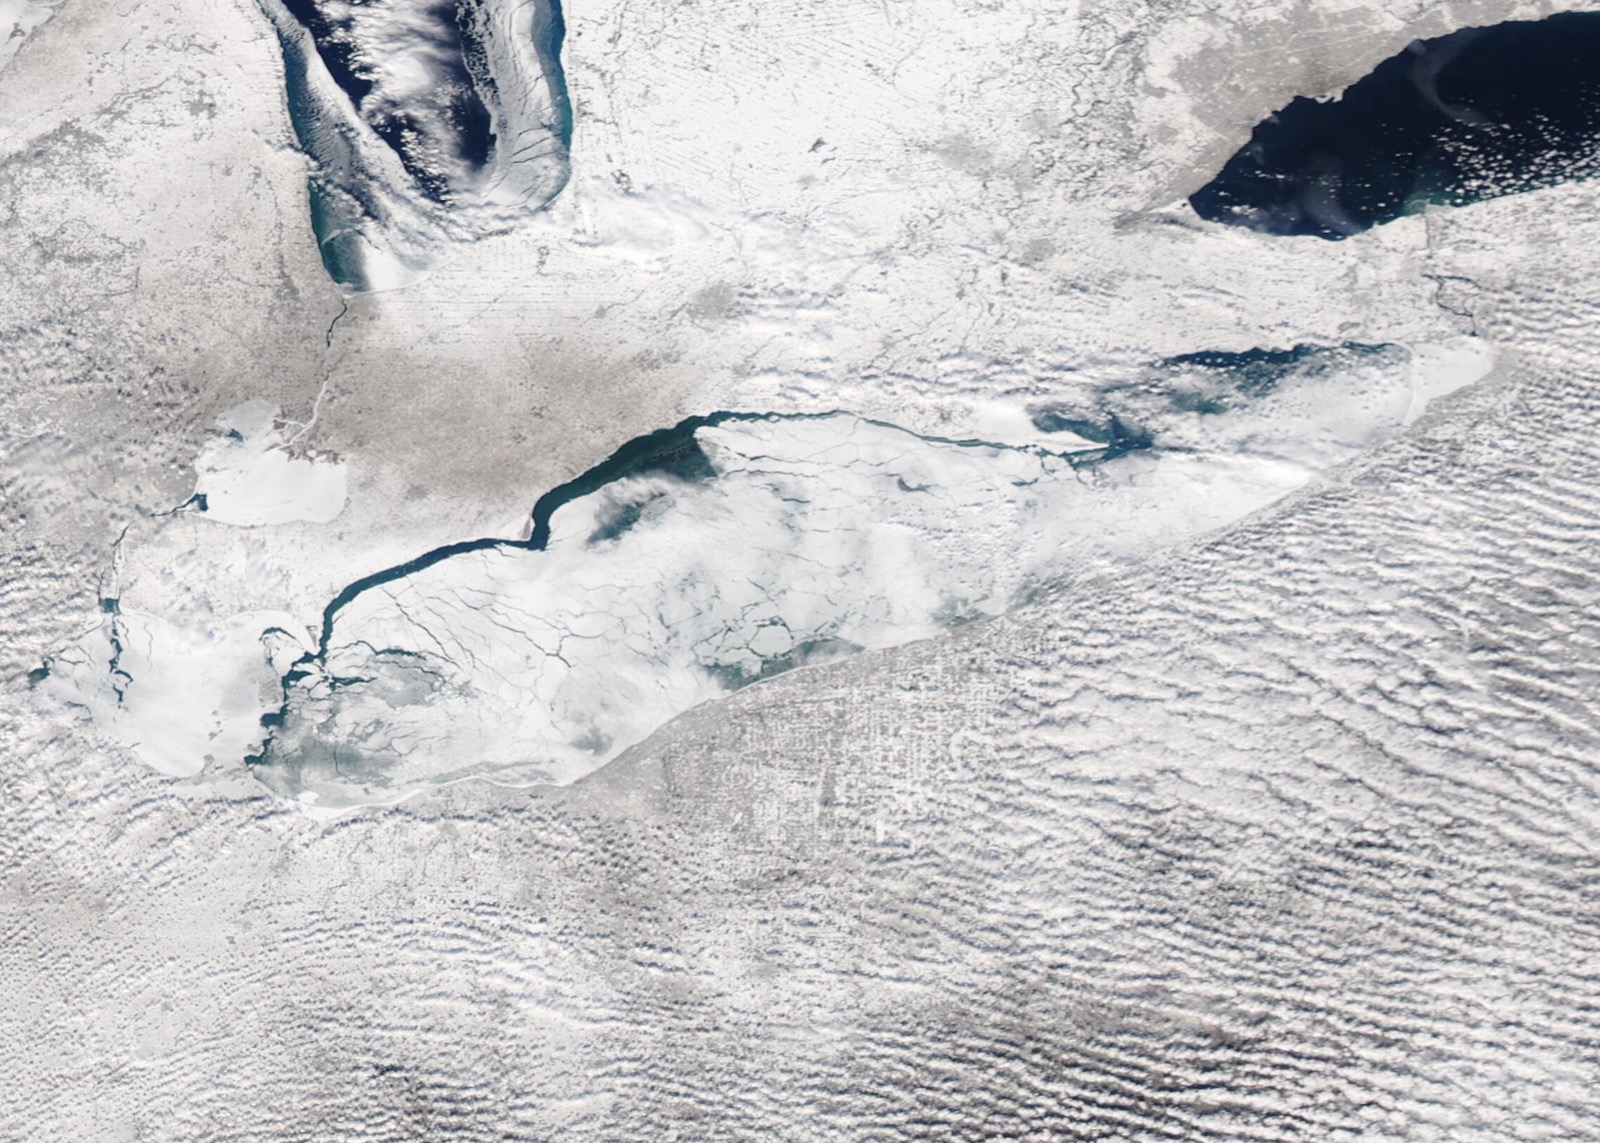
NASA's MODIS description of the satellite image on this page records that the mid-November 2022 event dropped record snowfall in parts of western New York, again centered on the towns just south and east of Buffalo. NWS Buffalo's winter season summary covers the event in detail. (NASA MODIS image description; NWS Buffalo winter summary)
Lake Erie
average annual maximum ice cover; 34 of 53 winters peaked at 90% or more. The shallowest Great Lake freezes, and its snow machine stops.
Lake Ontario
average annual maximum ice cover; only 7 of 53 winters even reached 50%. The deep lake stays open, and its belt keeps running.
Our averages, computed from NOAA GLERL’s daily Great Lakes ice cover record (GLICD), ice years 1973 to 2025: for each winter we take the season’s peak daily lake-averaged ice cover, then average those peaks.
New York lake effect snow FAQ
Lake effect snow in other states
Snowfall normals: NOAA NCEI 1991-2020 U.S. Climate Normals, by named station (public domain). Alerts: api.weather.gov, reproduced as issued. Record events cite the NWS office write-ups linked inline. Ice statistics are our arithmetic on NOAA GLERL daily records, labeled as such. No road or safety advice of ours appears on this page.
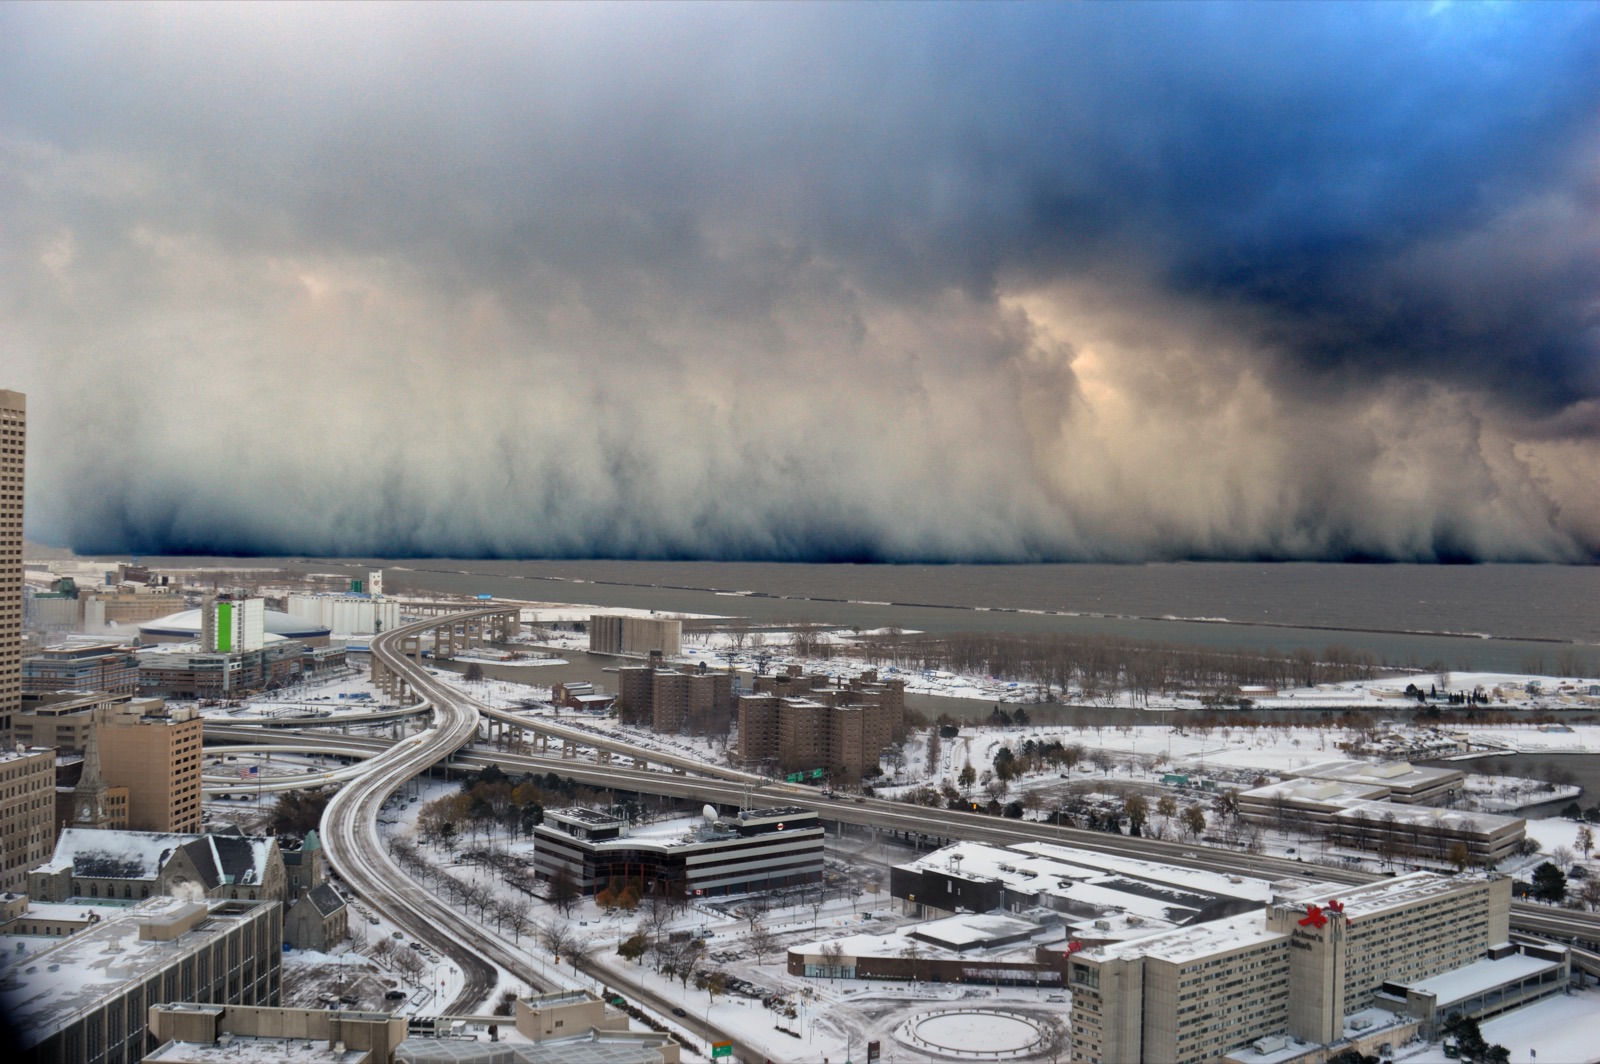
Hero image: “Snowfall descending on the Buffalo Southtowns” — NOAA Photo Library, NWS Collection — Public domain