
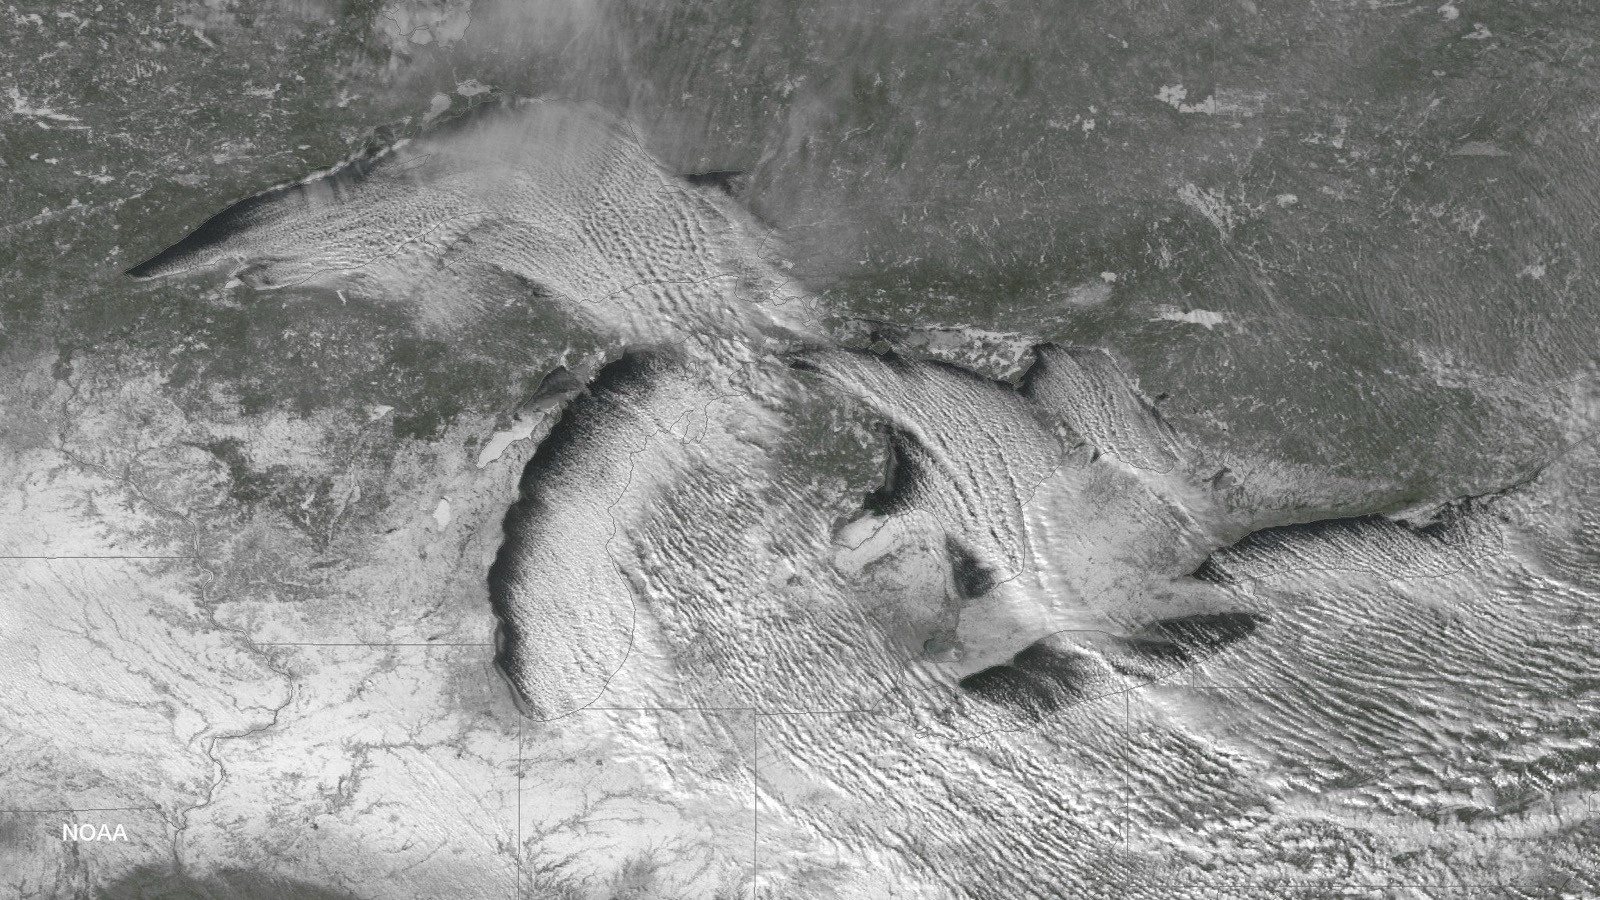
Wisconsin Lake Effect Snow
The Lake Superior south shore belt across Bayfield, Ashland and Iron Counties, the region NWS Duluth flatly calls "the Snowbelt". Door County and the Lake Michigan shore see a much weaker secondary version.
Driven by Lake Superior and Lake MichiganWisconsin snowbelt at a glance
NOAA NCEI normals, 1991-2020Seasonal snowfall normals from NOAA NCEI’s 1991-2020 U.S. Climate Normals, each attributed to its named station. Belt gradients are sharp enough that these single stations understate or overstate nearby towns by feet per season.
Where and why lake effect snow hits Wisconsin
Wisconsin's lake effect story is concentrated in its far north: Hurley averages about triple what Milwaukee or Madison records in the same NOAA normals. Because the flow that drives it, northerly winds behind cold fronts, is the default winter pattern, the south shore belt is one of the most reliable in the country.
The setup
Northerly flow behind arctic fronts, which crosses Lake Superior and lands on the Bayfield Peninsula and the Gogebic Range.
The geography
Rising terrain behind the south shore that adds lift, from the Penokee Hills eastward.
The off switch
Superior's enormous heat reserve: the biggest of the lakes rarely freezes over completely, so the belt runs deep into winter.
“In the Northland, the most common location for the lake snow to come onto land, is along the southern shore of Lake Superior across northern Wisconsin and upper Michigan. This region is also referred to as the Snowbelt. Typically, air cold enough to produce enough instability for lake effect snow is accompanied by winds with a northerly component.”
NWS Duluth, Lake Effect Snow Resources
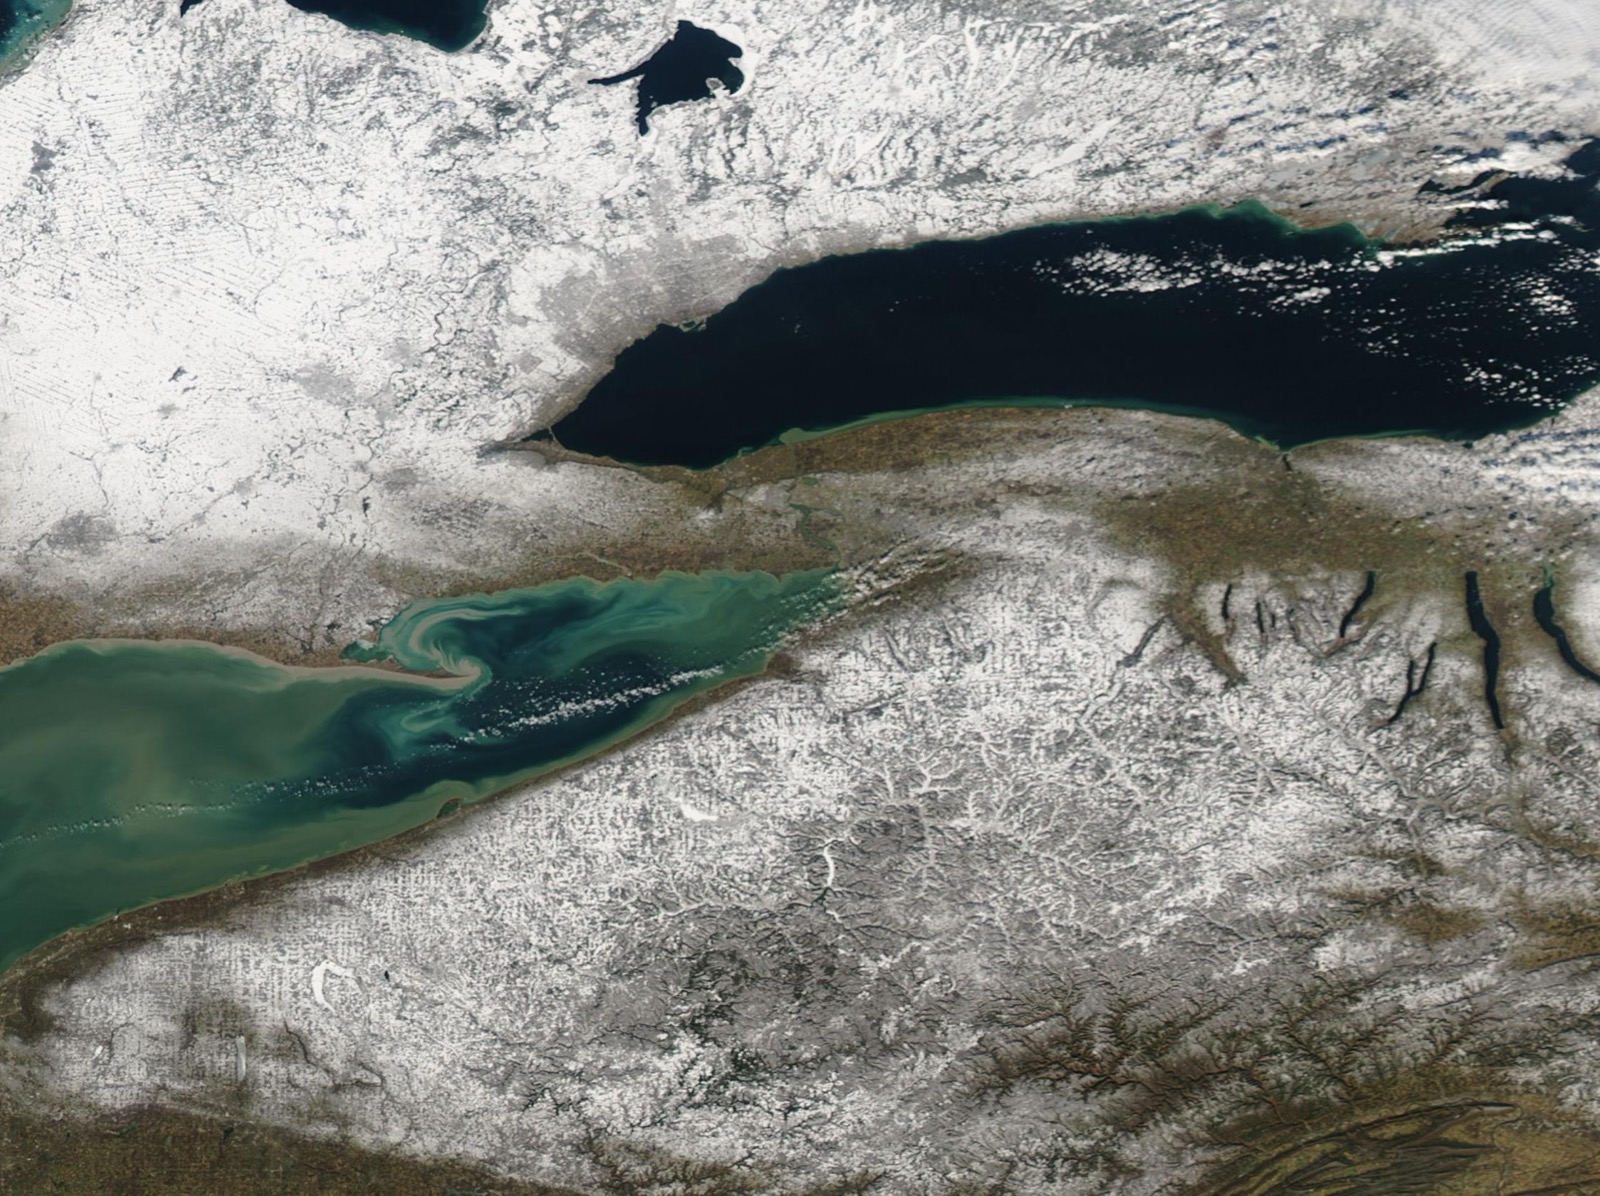
Wisconsin snowbelt cities
Each city page carries monthly NOAA normals for its named station, the local mechanism, and the live NWS product feed.
The season shape, at Hurley
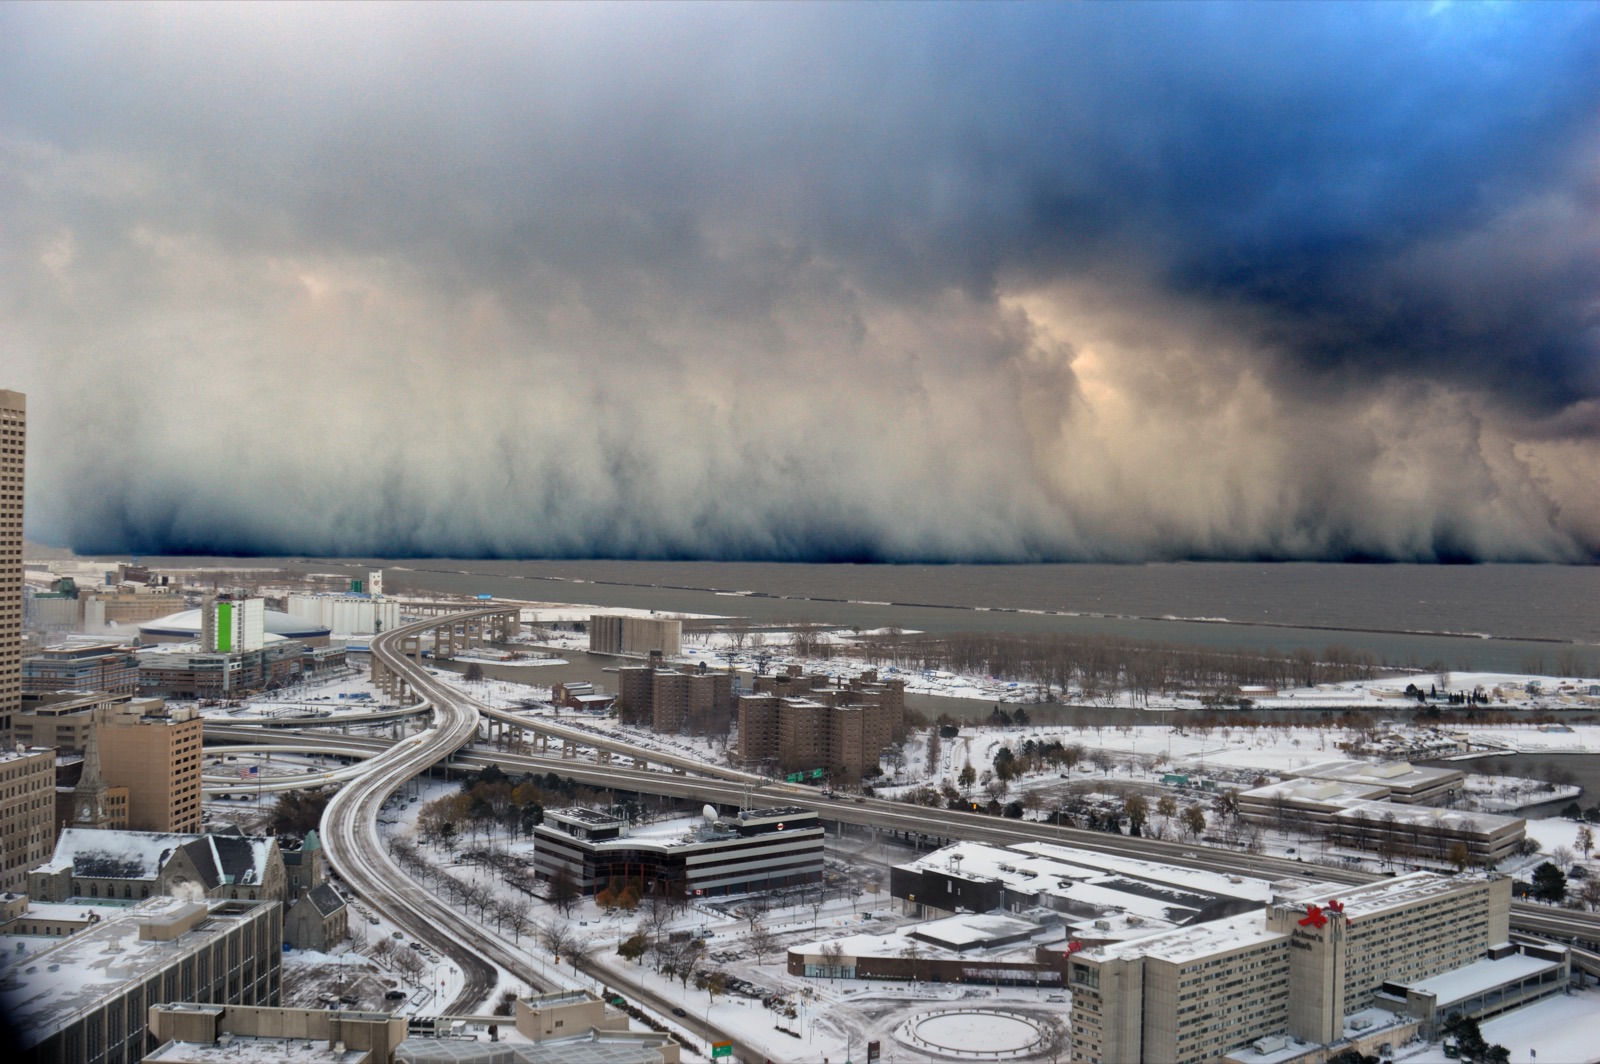
NWS winter products active in Wisconsin right now
Every active NWS winter product whose zones touch Wisconsin, read live from api.weather.gov and reproduced exactly as issued, with issuer and timestamps.
Checking api.weather.gov for active winter weather products…
Why the mixed product names: for the 2017-2018 winter the NWS consolidated its lake effect products into the general winter suite. The Lake Effect Snow Warning came back on October 1, 2019, but per Service Change Notice 19-63 its use is “optional at Regional discretion” and offices may still issue Winter Storm Warnings “with the lake effect component specified in the ‘What’ section”. The old Lake Effect Snow Watch and Advisory were never reinstated. So this page passes through every winter product for the area and tags the ones whose own NWS text names lake effect.
Whiteout and travel decisions belong with the National Weather Service (weather.gov winter safety) and the Wisconsin 511 system (511 road conditions). NWS products above are reproduced as issued.
Documented Wisconsin lake effect events
December 21-23, 2013: Ashland buried
NWS Duluth's month summary records "a long-duration lake effect snow event" that "dumped in excess of 30 inches on the northern Wisconsin community of Ashland" over three days. (NWS Duluth, December 2013 summary)
Wisconsin lake effect snow FAQ
Lake effect snow in other states
Snowfall normals: NOAA NCEI 1991-2020 U.S. Climate Normals, by named station (public domain). Alerts: api.weather.gov, reproduced as issued. Record events cite the NWS office write-ups linked inline. Ice statistics are our arithmetic on NOAA GLERL daily records, labeled as such. No road or safety advice of ours appears on this page.
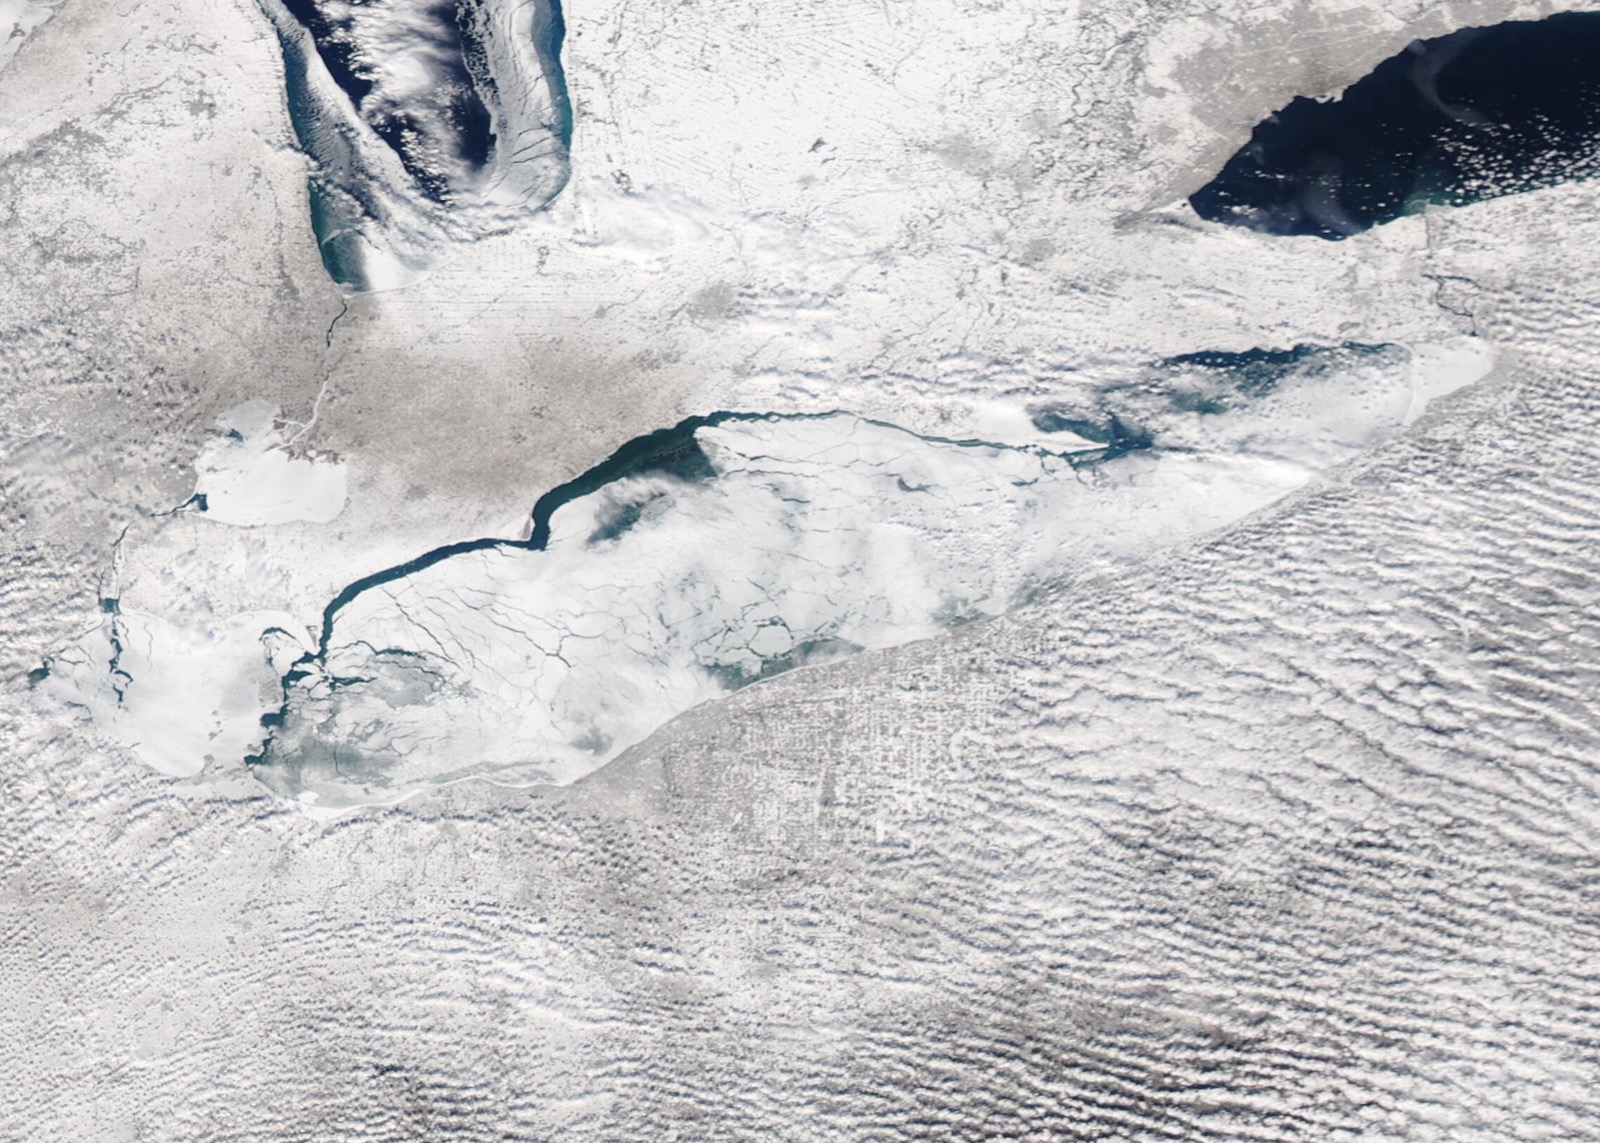
Hero image: “Lake effect snow bands over the Great Lakes region” — NOAA — Public domain