
Michigan Lake Effect Snow
Four distinct belts: the southwest lower peninsula (Grand Rapids to the Indiana line), the northwest lower (Traverse City, Petoskey, the Gaylord plateau), the eastern UP (Sault Ste. Marie), and the Superior shore of the western UP (Marquette, the Keweenaw).
Driven by Lake Michigan and Lake Superior and Lake HuronMichigan snowbelt at a glance
NOAA NCEI normals, 1991-2020Seasonal snowfall normals from NOAA NCEI’s 1991-2020 U.S. Climate Normals, each attributed to its named station. Belt gradients are sharp enough that these single stations understate or overstate nearby towns by feet per season.
Where and why lake effect snow hits Michigan
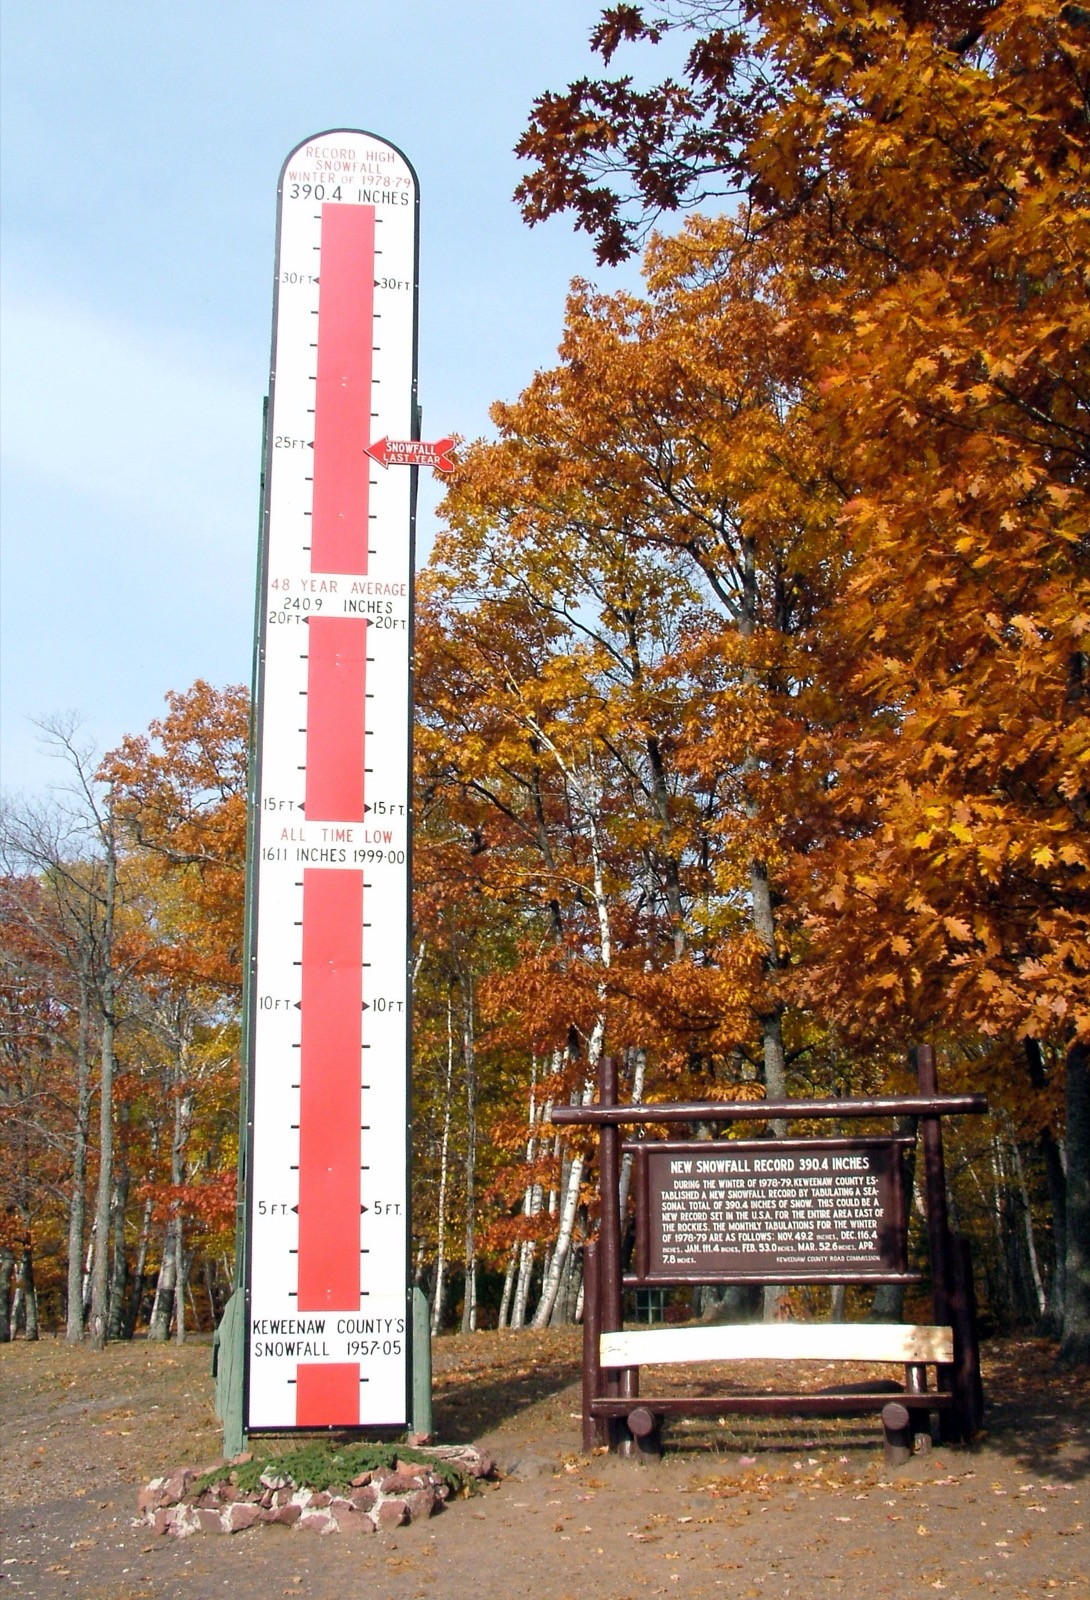
Michigan has more lake effect geography than any other state, and its numbers scale with latitude and elevation: from about 65 inches a year near the Indiana line to nearly 200 at the NWS Marquette office and far more up the Keweenaw, where the roadside snow thermometer near Mohawk commemorates 390.4 inches in the winter of 1978-79. Superior and Michigan are both deep enough to keep significant open water through most winters, so the northern belts run long.
The setup
Westerly flow across Lake Michigan feeding the southwest and northwest lower peninsula belts.
The geography
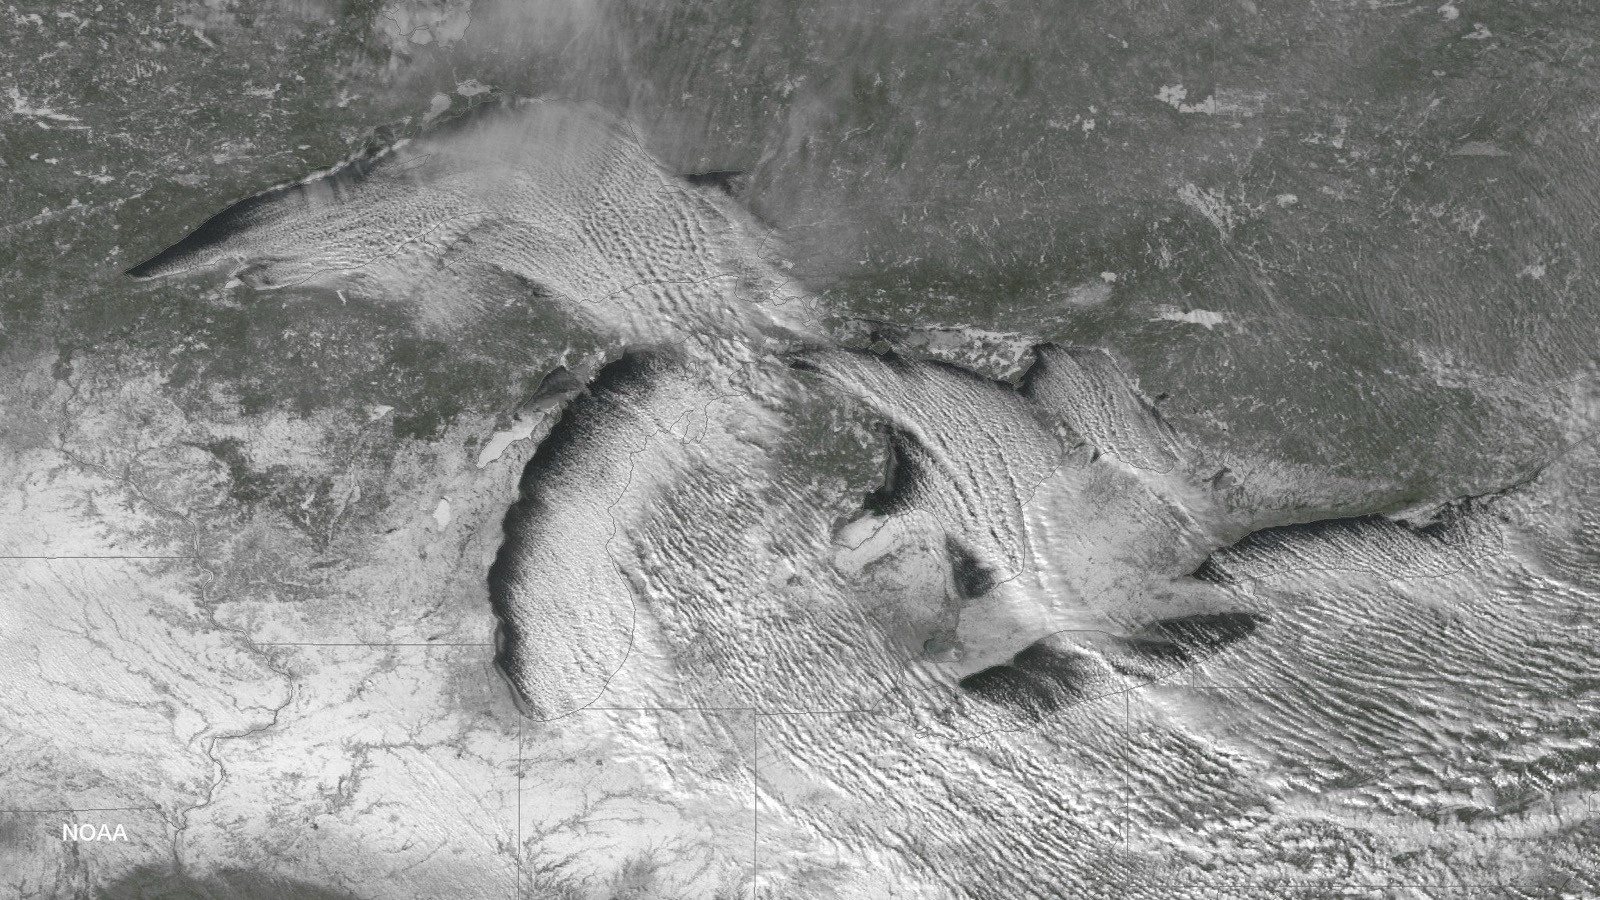
Northwest flow across Lake Superior burying the UP, with the Keweenaw Peninsula jutting into the best fetch.
The off switch
Terrain everywhere: the Otsego plateau, the Gogebic Range and the Keweenaw highlands all add lift.
“LES occurs when cold air, often originating from Canada, moves across the open waters of the Great Lakes. As the cold air passes over the unfrozen, and relatively warm waters of the Great Lakes, warmth and moisture is transferred into the lowest portion of the atmosphere. The air becomes warmer and less dense than the overriding cold air, so it rises. The rising air ultimately leads to cloudiness and snow on the leeward sides of the Great Lakes.”
NWS Gaylord, Science: Lake Effect Snow
Michigan snowbelt cities
Each city page carries monthly NOAA normals for its named station, the local mechanism, and the live NWS product feed.
The season shape, at Marquette
NWS winter products active in Michigan right now
Every active NWS winter product whose zones touch Michigan, read live from api.weather.gov and reproduced exactly as issued, with issuer and timestamps.
Checking api.weather.gov for active winter weather products…
Why the mixed product names: for the 2017-2018 winter the NWS consolidated its lake effect products into the general winter suite. The Lake Effect Snow Warning came back on October 1, 2019, but per Service Change Notice 19-63 its use is “optional at Regional discretion” and offices may still issue Winter Storm Warnings “with the lake effect component specified in the ‘What’ section”. The old Lake Effect Snow Watch and Advisory were never reinstated. So this page passes through every winter product for the area and tags the ones whose own NWS text names lake effect.
Whiteout and travel decisions belong with the National Weather Service (weather.gov winter safety) and the Michigan 511 system (511 road conditions). NWS products above are reproduced as issued.
Documented Michigan lake effect events
Winter 1978-79: the Keweenaw benchmark
The Keweenaw County Road Commission's snow thermometer beside US 41 near Mohawk, photographed on this page, records the winter of 1978-79 at 390.4 inches, the sign's all-time high for the county measurement it tracks. (Keweenaw County Road Commission roadside marker)
Michigan lake effect snow FAQ
Lake effect snow in other states
Snowfall normals: NOAA NCEI 1991-2020 U.S. Climate Normals, by named station (public domain). Alerts: api.weather.gov, reproduced as issued. Record events cite the NWS office write-ups linked inline. Ice statistics are our arithmetic on NOAA GLERL daily records, labeled as such. No road or safety advice of ours appears on this page.
Hero image: “Keweenaw Snow Thermometer” by Nick Nolte, CC BY-SA 2.5