
LaPorte Lake Effect Snow
Why Lake Michigan buries LaPorte, what NOAA's 1991-2020 normals show, and every active NWS winter product, as issued.
Season normal: 65.2 inches at LAPORTE, IN USLaPorte snowfall, by the numbers
NOAA NCEI normals, 1991-2020Every figure is NOAA NCEI’s official 1991-2020 climate normal for the named station, LAPORTE, IN US (USC00124837). Lake effect gradients are sharp: a few miles can change a season total by feet.
Month by month snowfall in LaPorte
NOAA’s 1991-2020 monthly snowfall normals for LAPORTE, IN US, laid out as a snow season from July to June. Lake effect climates load their totals into the cold months when the lake is still open water; watch how fast the bars rise in November and fall off late winter.
Why LaPorte gets lake effect snow
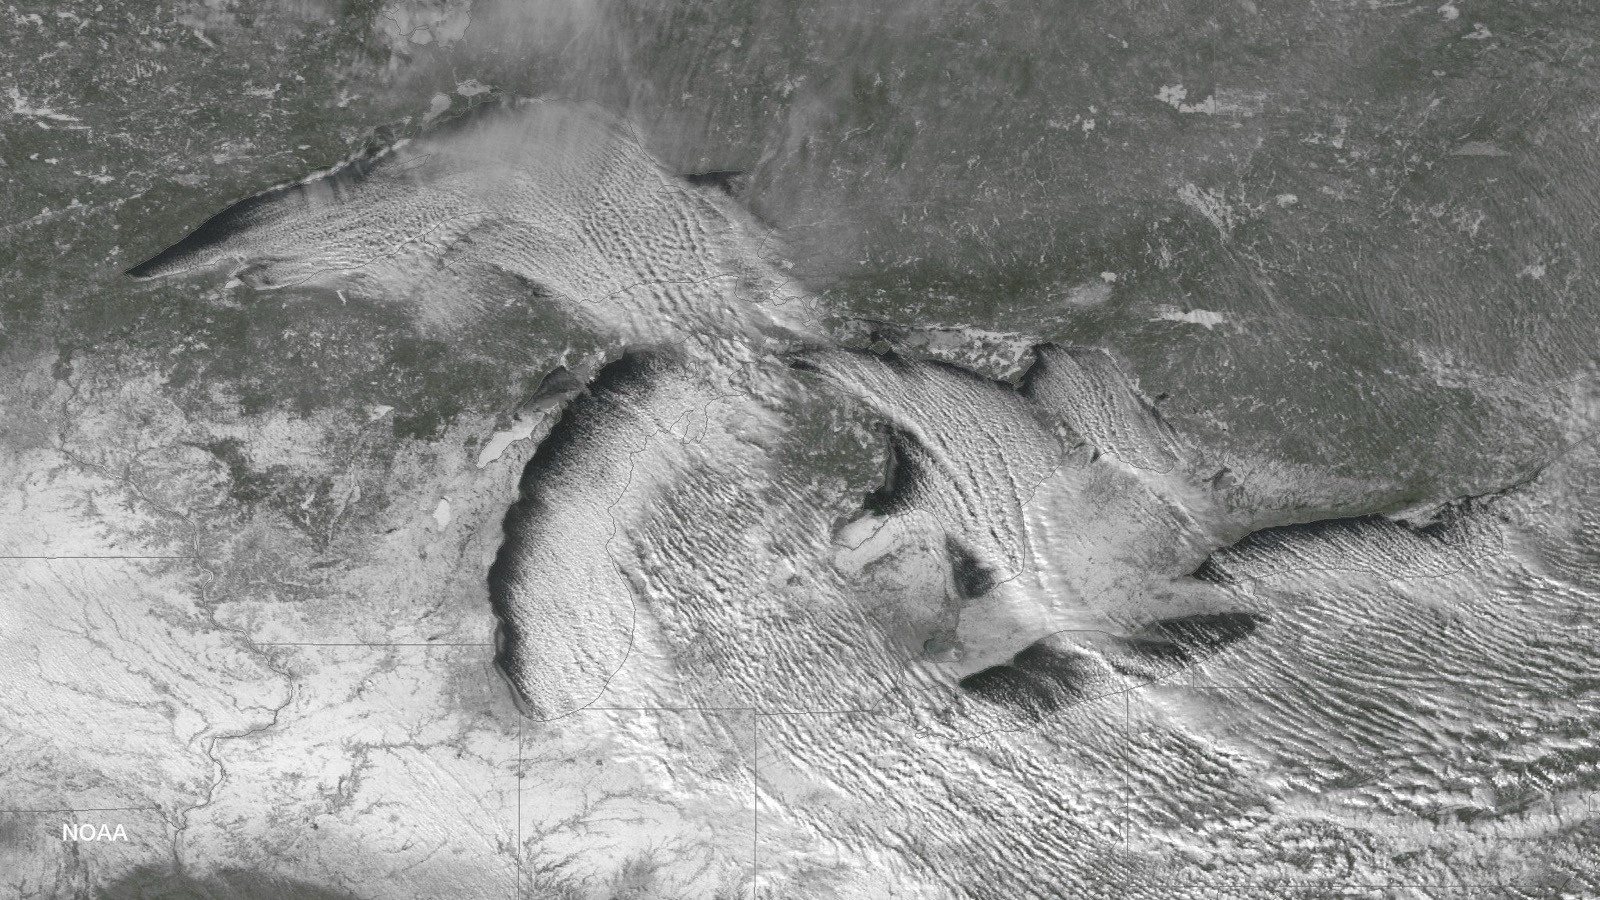
LaPorte and neighboring Porter County form the core of Indiana's small but genuine snowbelt, tucked against Lake Michigan's south shore where northerly flow crosses the lake end to end. NWS Chicago's event reviews document the pattern: in the January 30-31, 2026 event, northerly winds drove bands into Porter County with significant accumulations while the band only clipped northeast Illinois.
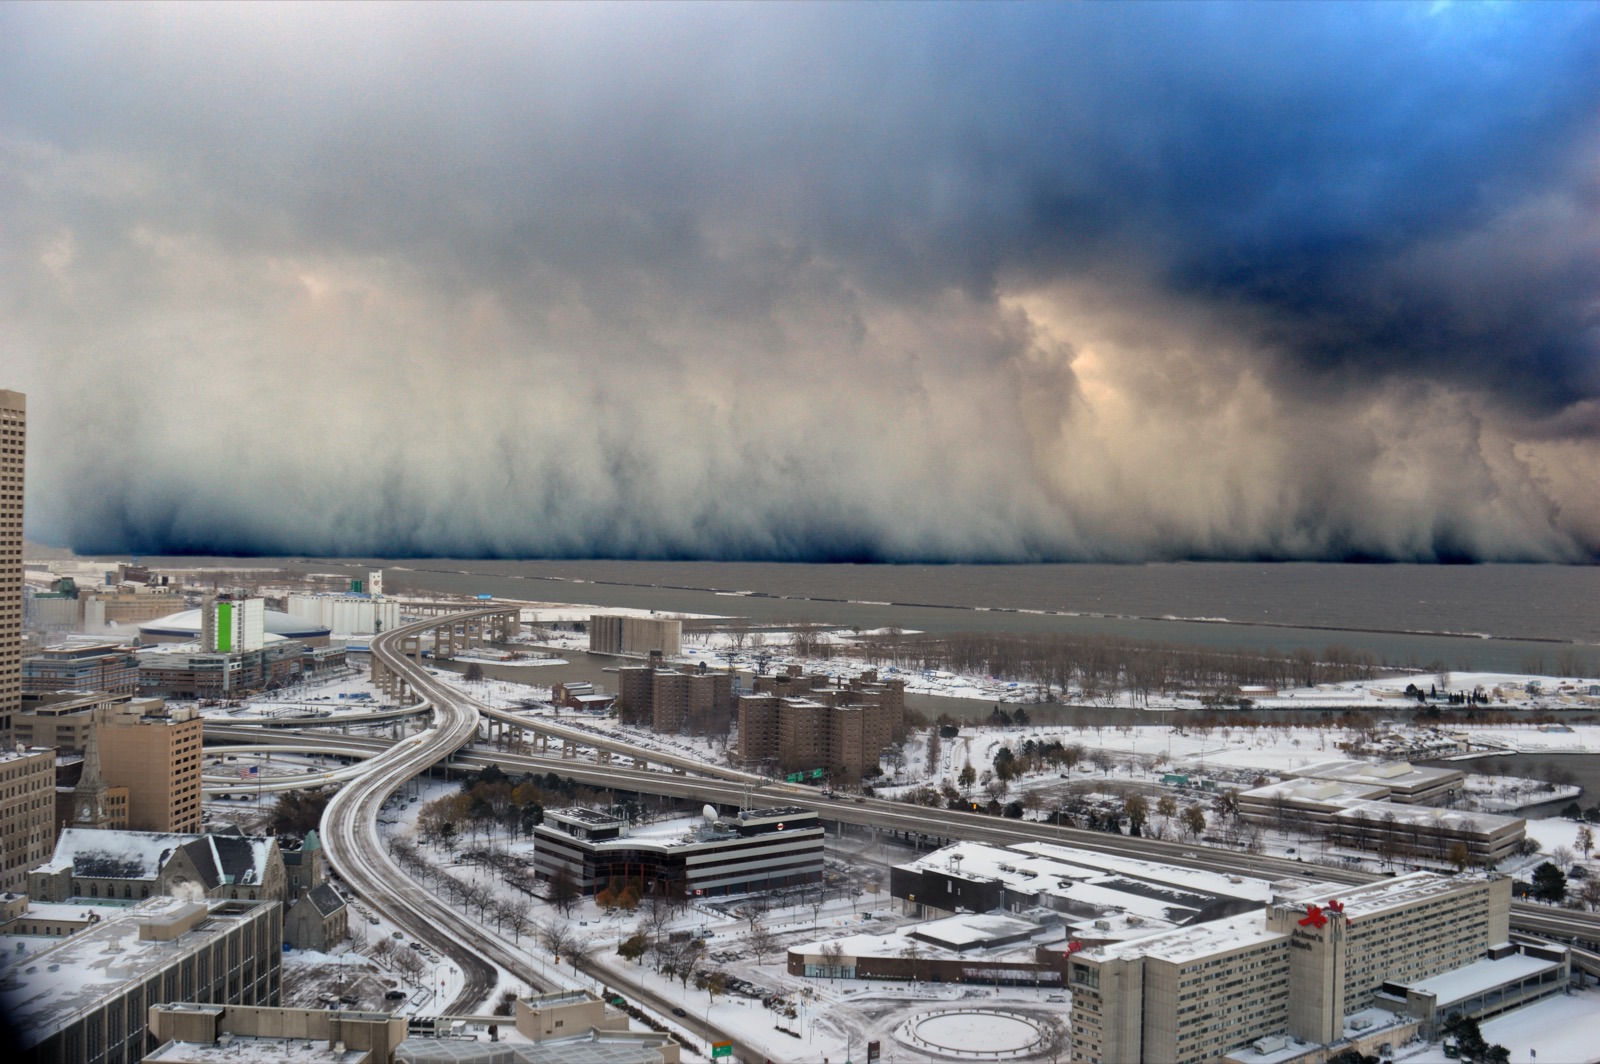
The physics, in the National Weather Service’s own words: “Lake Effect snow occurs when cold air, often originating from Canada, moves across the open waters of the Great Lakes... The air rises, clouds form and grow into narrow band that produces 2 to 3 inches of snow per hour or more.” And on location: “Wind direction is a key component in determining which areas will receive lake effect snow. Heavy snow may be falling in one location, while the sun may be shining just a mile or two away in either direction.” (NWS, What is Lake Effect Snow?)
Winter weather products covering IN right now
Every active National Weather Service winter product for Indiana, read live from api.weather.gov and reproduced exactly as issued. Zones are larger than the city, so confirm the listed areas include yours.
Checking api.weather.gov for active winter weather products…
Why the mixed product names: for the 2017-2018 winter the NWS consolidated its lake effect products into the general winter suite. The Lake Effect Snow Warning came back on October 1, 2019, but per Service Change Notice 19-63 its use is “optional at Regional discretion” and offices may still issue Winter Storm Warnings “with the lake effect component specified in the ‘What’ section”. The old Lake Effect Snow Watch and Advisory were never reinstated. So this page passes through every winter product for the area and tags the ones whose own NWS text names lake effect.
Whiteout and travel decisions belong with the National Weather Service (weather.gov winter safety) and the Indiana 511 system (511 road conditions). NWS products above are reproduced as issued.
When lake effect season runs, and what ends it
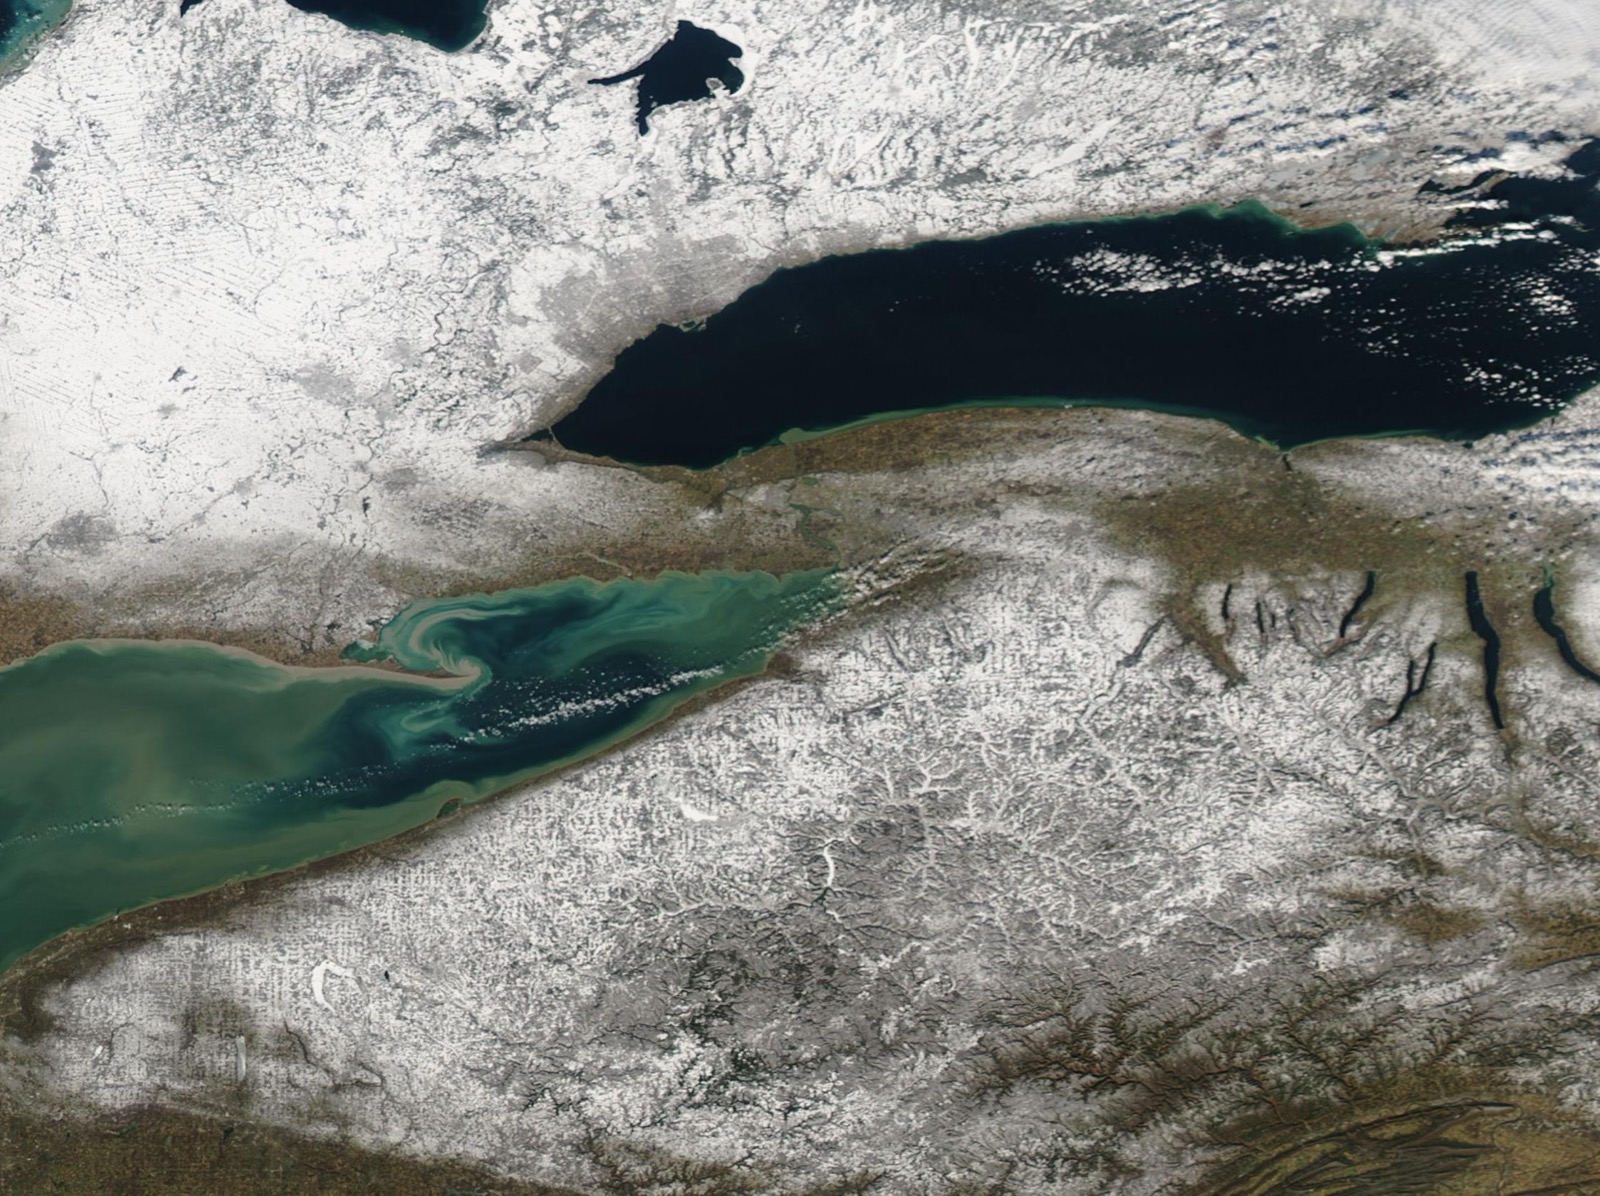
Lake effect season opens with the first arctic outbreaks over still-warm water, usually November, and the early-season events are often the most violent because the lake is warmest. What closes the season depends on the lake: shallow Lake Erie usually freezes and shuts its machine off, while deep Lake Ontario and Lake Superior stay mostly open and can produce all winter.
Lake Erie
average annual maximum ice cover; 34 of 53 winters peaked at 90% or more. The shallowest Great Lake freezes, and its snow machine stops.
Lake Ontario
average annual maximum ice cover; only 7 of 53 winters even reached 50%. The deep lake stays open, and its belt keeps running.
Our averages, computed from NOAA GLERL’s daily Great Lakes ice cover record (GLICD), ice years 1973 to 2025: for each winter we take the season’s peak daily lake-averaged ice cover, then average those peaks.
LaPorte lake effect snow FAQ
Other snowbelt cities
Snowfall figures are NOAA NCEI 1991-2020 U.S. Climate Normals for LAPORTE, IN US (public domain), refreshed with each new normals release. Alerts read live from api.weather.gov and reproduced as issued. Ice statistics computed by us from NOAA GLERL daily records and labeled as our arithmetic. No safety advice of ours appears on this page.
Hero image: “Grand Haven Pier Snow” — Andy Hanson — CC0