
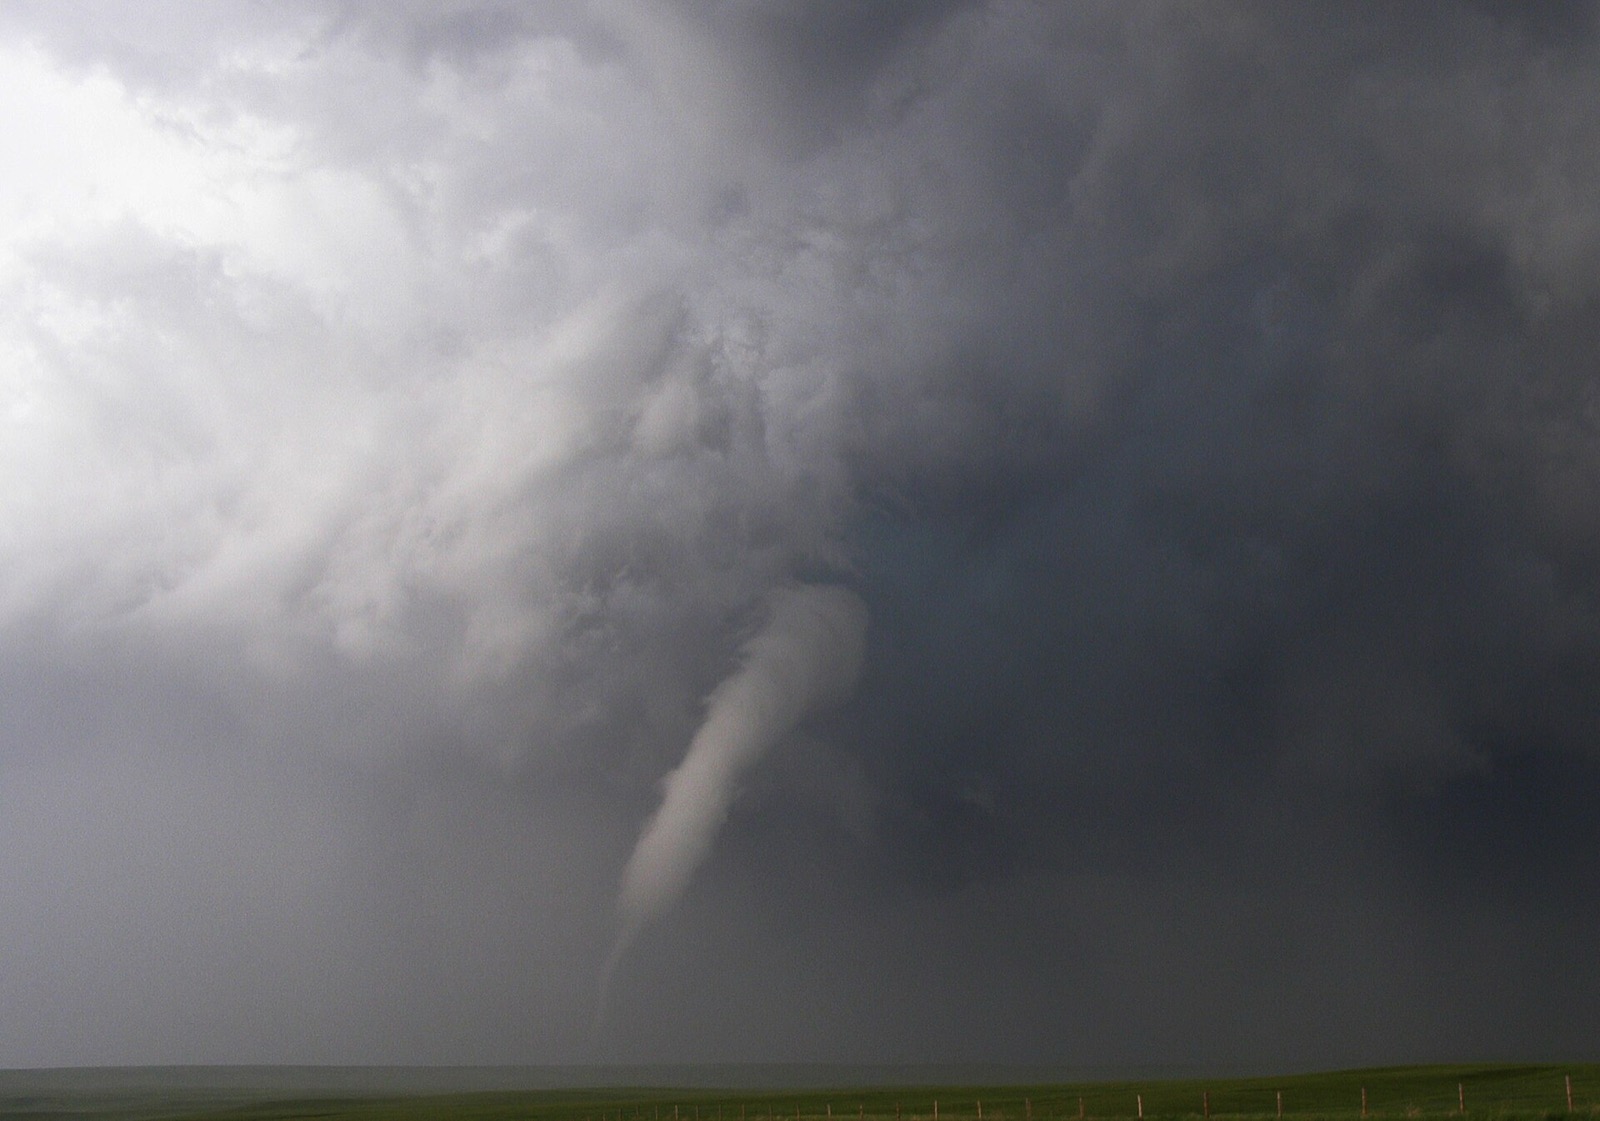
Tornado Season in Idaho
Tornadoes are uncommon in Idaho, and the 30 year record shows how uncommon. Here is how many days a year, how strong the record ones were, which counties they touched, and any live National Weather Service product.
Tornadoes reach Idaho on 2.6 days in an average yearHow often tornadoes actually reach Idaho
1996-2025, tornadoes counted once per state they touchedIdaho averages three or four brief tornadoes a year over the Snake River Plain and the eastern highlands, almost all in daylight and almost all weak: one EF2 is the only significant tornado in the 30 year record. Oddly, its longest track of the window came on Valentine's Day 2000.
When tornadoes come to Idaho
The bars count DAYS with at least one tornado, and the table carries the tornado counts beside them. The difference between the two is the outbreak story: across the 30 years from 1996 to 2025, Idaho recorded 103 tornadoes on 79 days, so an average tornado day here produced 1.3 of them. The biggest single day, 2000-02-14, produced 5. The months carrying at least a twelfth of the year's tornado days are April, May, June, July.
| Month | Tornado days, 30 years | Days a year | Tornadoes, 30 years |
|---|---|---|---|
| January | 0 | 0 | 0 |
| February | 2 | 0.1 | 6 |
| March | 2 | 0.1 | 2 |
| April | 9 | 0.3 | 11 |
| May | 20 | 0.7 | 27 |
| June | 17 | 0.6 | 17 |
| July | 12 | 0.4 | 12 |
| August | 6 | 0.2 | 10 |
| September | 6 | 0.2 | 8 |
| October | 3 | 0.1 | 8 |
| November | 1 | 0 | 1 |
| December | 1 | 0 | 1 |
Idaho tornadoes by rating
Most tornadoes everywhere are weak, and the shape of this ladder is how Idaho compares: 102 of its 103 tornadoes carry a rating, 2 reached EF2 or stronger, and none reached EF4. 1 tornadoes (1 percent) carry no rating at all, mostly brief touchdowns with nothing surveyable to rate, and they sit outside every intensity figure here.
The strongest on record here. Rated F2, beginning in Adams County on 2006-06-04, with a 12 mile path. The National Weather Service pairs that rating with estimated 3 second gusts of 111-135 mph.
| Rating | Estimated 3 second gust | SPC term |
|---|---|---|
| EF0 | 65-85 mph | Weak |
| EF1 | 86-110 mph | Weak |
| EF2Idaho's strongest since 1996 (rated F2 on the original scale) | 111-135 mph | Significant |
| EF3 | 136-165 mph | Significant |
| EF4 | 166-200 mph | Violent |
| EF5 | Over 200 mph | Violent |
National Weather Service Norman OK, The Enhanced Fujita Scale“The EF scale still is a set of wind estimates (not measurements) based on damage.”
National Weather Service Norman OK, The Enhanced Fujita Scale“The NWS is the only federal agency with authority to provide 'official' tornado EF Scale ratings.”
Where Idaho tornadoes have actually gone
Each tornado counts once for every county it touched, from the database's own county codes, including the continuation rows that a naive read of the file misses. Two caveats belong next to this table rather than under it. First, big counties collect more tornadoes than small ones for reasons of geometry alone. Second, the record is built from reports and surveys, so counties with more people and more roads verify more tornadoes than empty ones with the same weather.
| County | Tornadoes | EF2 or stronger | Tornado days | Strongest | Most recent |
|---|---|---|---|---|---|
| Bingham County | 11 | 0 | 9 | F1 | 2019-06-02 |
| Jefferson County | 9 | 0 | 9 | F1 | 2025-10-27 |
| Ada County | 8 | 0 | 5 | F0 | 2023-05-26 |
| Power County | 8 | 0 | 7 | F1 | 2014-05-21 |
| Cassia County | 7 | 0 | 6 | F0 | 2023-05-26 |
| Butte County | 5 | 0 | 5 | F0 | 2018-06-21 |
| Owyhee County | 5 | 0 | 5 | F0 | 2023-05-27 |
| Twin Falls County | 4 | 0 | 4 | F0 | 2019-05-07 |
| Bannock County | 3 | 0 | 3 | F0 | 2007-08-17 |
| Blaine County | 3 | 0 | 2 | F0 | 2006-10-04 |
NOAA Storm Prediction Center, Severe Weather Maps, Graphics, and Data Page“It should also be noted that these data are used by the NWS for verification purposes and may not accurately reflect all storm events.”
What the National Weather Service has out in Idaho
Everything below is read live from api.weather.gov when this page loads and shown exactly as the issuing office wrote it, including the office's own tag saying whether a tornado was observed or radar indicated.
Checking api.weather.gov for active tornado products.
Products are shown exactly as issued, with the office's own tornadoDetection tag saying whether the tornado was observed or radar indicated. A missing tag is shown as missing. Source: api.weather.gov
Tornado safety, in the agency's own words
Tornado safety guidance is the National Weather Service's. Here it is verbatim, starting with the two products every alert above belongs to.
National Weather Service, Understand Tornado Alerts“Tornado Watch: Be Prepared! Tornadoes are possible in and near the watch area. Review and discuss your emergency plans, take inventory of your supplies and check your safe room. Be ready to act quickly if a warning is issued or you suspect a tornado is approaching. Acting early helps to save lives! Watches are issued by the Storm Prediction Center for counties where tornadoes may occur. The watch area is typically large, covering numerous counties or even states.”
National Weather Service, Understand Tornado Alerts“Tornado Warning: Take Action! A tornado has been sighted or indicated by weather radar. There is imminent danger to life and property. Move to an interior room on the lowest floor of a sturdy building. Avoid windows. If in a mobile home, a vehicle, or outdoors, move to the closest substantial shelter and protect yourself from flying debris.”
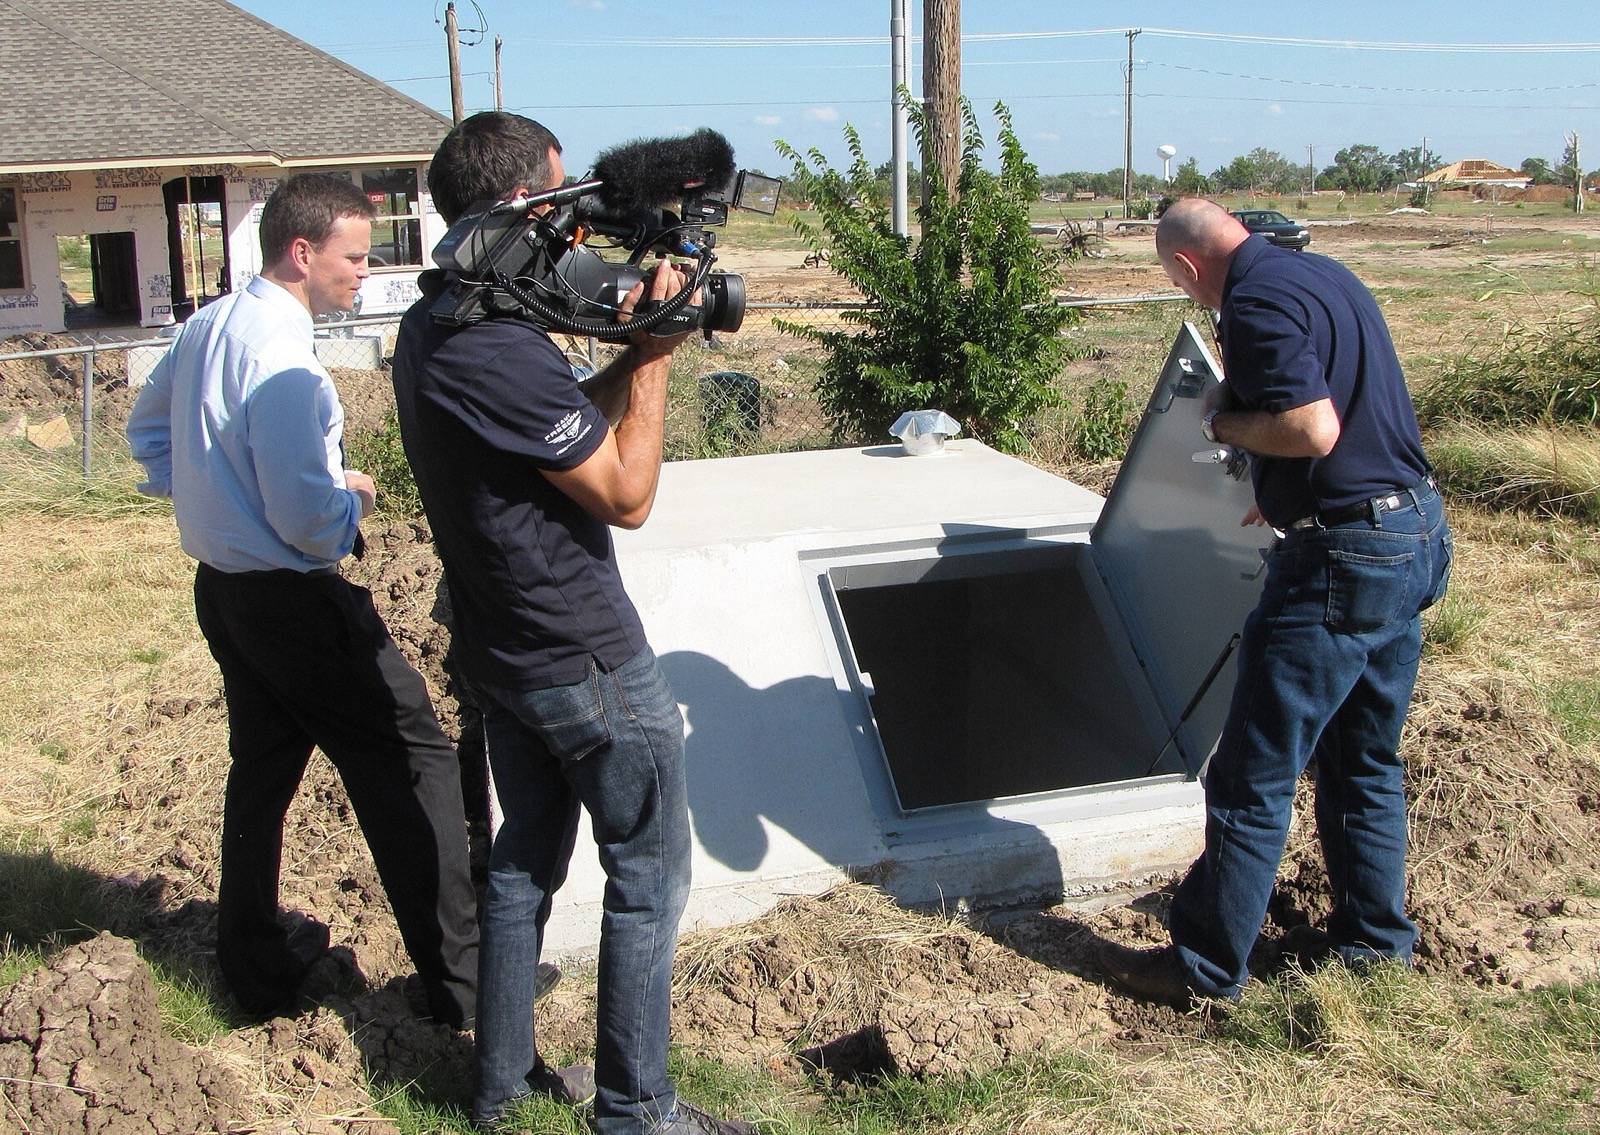
National Weather Service, What to do During a Tornado“At Your House: If you are in a tornado warning, go to your basement, safe room, or an interior room away from windows. Don't forget pets if time allows.”
National Weather Service, What to do During a Tornado“Outside: Seek shelter inside a sturdy building immediately if a tornado is approaching. Sheds and storage facilities are not safe. Neither is a mobile home or tent. If you have time, get to a safe building.”
National Weather Service, What to do During a Tornado“In a vehicle: Being in a vehicle during a tornado is not safe. The best course of action is to drive to the closest shelter. If you are unable to make it to a safe shelter, either get down in your car and cover your head, or abandon your car and seek shelter in a low lying area such as a ditch or ravine.”
Full guidance is at NWS Tornado Safety, and the Storm Prediction Center publishes the forward looking SPC Convective Outlooks for the next several days. Both are the place to look for what is going to happen; this page is the record of what has.
How the Idaho figures are calculated
The source. Every count on this page comes from the NOAA Storm Prediction Center Severe Weather Database, the National Weather Service's own record of every United States tornado since 1950, a US Government work in the public domain.
Tornadoes, not rows. The database stores each tornado track as segments: a tornado that crosses a county or state line appears as several rows, and counting rows double counts exactly the long track tornadoes people remember. Each tornado is counted once per state it touched, using the file's own segment flags, and the counting rule is verified against SPC's separate de-segmented tornado file every time this snapshot is rebuilt.
The window is the Doppler era. Everything is computed on 1996 to 2025, because the record before the NEXRAD radar network is not comparable with the record after it, and SPC says so itself:
NOAA Storm Prediction Center, The Online Tornado FAQ“Tornado reports have increased, especially around the installation of the NEXRAD Doppler radar system in the mid 1990s. This doesn't mean that actual tornado occurrence has gone up, however.”
NOAA Storm Prediction Center, The Online Tornado FAQ“The increase in tornado numbers is almost entirely in weak (EF0-EF1) events that are being reported far more often today due to a combination of better detection, greater media coverage, aggressive warning verification efforts, storm spotting, storm chasing, more developmental sprawl (damage targets), more people, and better documentation with cameras (including cell phones) than ever.”
NOAA Storm Prediction Center, Severe Weather Maps, Graphics, and Data Page“Monetary loss information is highly suspect and should be used with caution, if at all.”
Not on this page. A risk score, an index, a forecast, a trend line, or the database's monetary loss columns, on SPC's own advice below. Deaths and injuries appear only as the agency's own totals.
Page shape follows the data. A state clearing 10 tornado days a year AND 2 EF2 or stronger tornadoes a year leads with frequency; above 3 tornado days a year the page leads with the season window; below that it counts; and a state with tornadoes in fewer than 15 of the 30 years gets the whole record instead of a season window. Idaho is on the occasional shape, ranked 35 of 50 by tornado days a year. Sources: NOAA SPC Severe Weather Database, US Census Bureau 2020 county codes, NWS api.weather.gov active alerts. All are US Government works in the public domain. SPC last updated the database on 24 April 2026; this snapshot was built on 2026-09-02.
Idaho tornado season FAQ
The rest of Idaho's storm year
Tornado season in nearby states
Counts are ours, from the NOAA Storm Prediction Center Severe Weather Database, 1996 to 2025, tornadoes counted once per state they touched. Ratings, definitions and all safety text are quoted from the National Weather Service and the Storm Prediction Center. Live products come from api.weather.gov and are shown verbatim. National picture: tornado season in every state