
What Planting Zone Am I In? Your Zone and What to Plant Now
Your USDA zone from your ZIP code, how it moved since 2012, your frost dates, and the garden jobs for this month in your zone, each from an extension service.
Find your planting zone by ZIP code
Enter a ZIP code or a town. You get the zone on the 2023 USDA map for 40,502 ZIP codes, the frost dates at the nearest NOAA station, and what to sow, plant, prune and protect there this month.
Planting zone map of the US
Zones run from 1a in interior Alaska, where the coldest night of the winter averages -60°F to -55°F, to 13b in San Juan, Puerto Rico, at 65°F to 70°F. Each step is five degrees. The most common zone is 6b, with 5,271 ZIP codes in 33 states.
- 1 -60°F to -50°F
- 2 -50°F to -40°F
- 3 -40°F to -30°F
- 4 -30°F to -20°F
- 5 -20°F to -10°F
- 6 -10°F to 0°F
- 7 0°F to 10°F
- 8 10°F to 20°F
- 9 20°F to 30°F
- 10 30°F to 40°F
- 11 40°F to 50°F
- 12 50°F to 60°F
- 13 60°F to 70°F
What changed in 2023
Every ZIP on both mapsCompared ZIP by ZIP from the 2023 and 2012 tables the PRISM Climate Group publishes for the USDA; 40,021 ZIP codes appear in both.
Why your zone may have moved
The USDA’s summary of the new map:
“When compared to the 2012 map, the 2023 version reveals that about half of the country shifted to the next warmer half zone, and the other half of the country remained in the same half zone.”USDA Agricultural Research Service, November 15, 2023
Two things changed under it. The years: “The 2023 map includes data measured at weather stations from 1991 to 2020.” And the stations: “The 2023 map incorporates data from 13,412 weather stations compared to the 7,983 that were used for the 2012 map.” More stations draw the cold valleys and warm cities more finely, which is why a few hundred ZIP codes went the other way.
The USDA is careful about what the shift means: “Temperature updates to plant hardiness zones are not necessarily reflective of global climate change because of the highly variable nature of the extreme minimum temperature of the year, as well as the use of increasingly sophisticated mapping methods and the inclusion of data from more weather stations.”
What a planting zone means
In the USDA’s words: “The map is based on the average annual extreme minimum winter temperature, displayed as 10-degree F zones and 5-degree F half zones.” A zone is the coldest night a plant has to live through, so it tells you which perennials, shrubs, trees and fruit come back next spring. It says nothing about heat, rain or soil.
It does not say when to plant, either. That comes from the frost dates, which is why the calendars on the zone pages are counted from the last spring frost and the first fall frost. And a zone is an average, not a record: “Put another way, the designations do not reflect the coldest it has ever been or ever will be at a specific location, but simply the average lowest winter temperature for the location over a specified time.”
Each zone page has its range, its states and cities, a twelve month calendar and the plants rated for it.
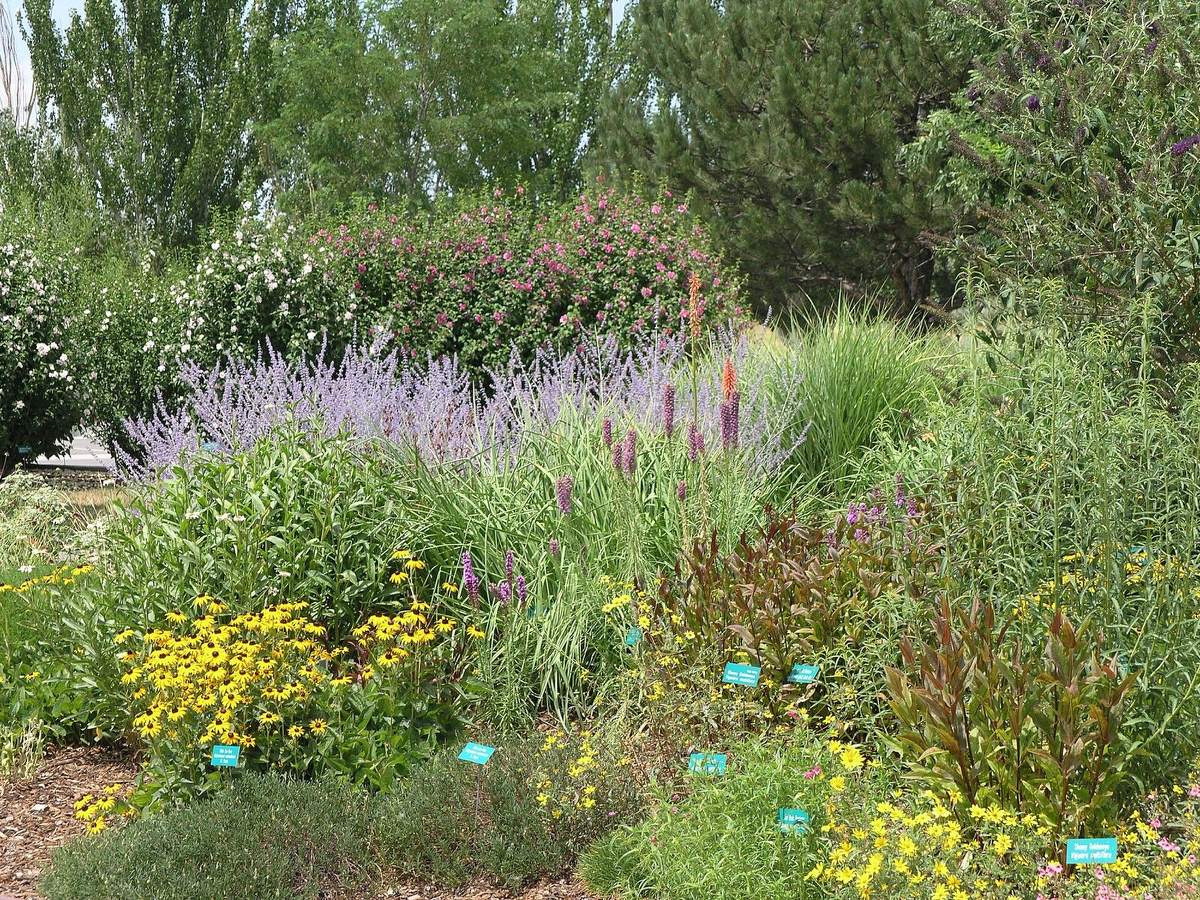
Where the monthly jobs come from
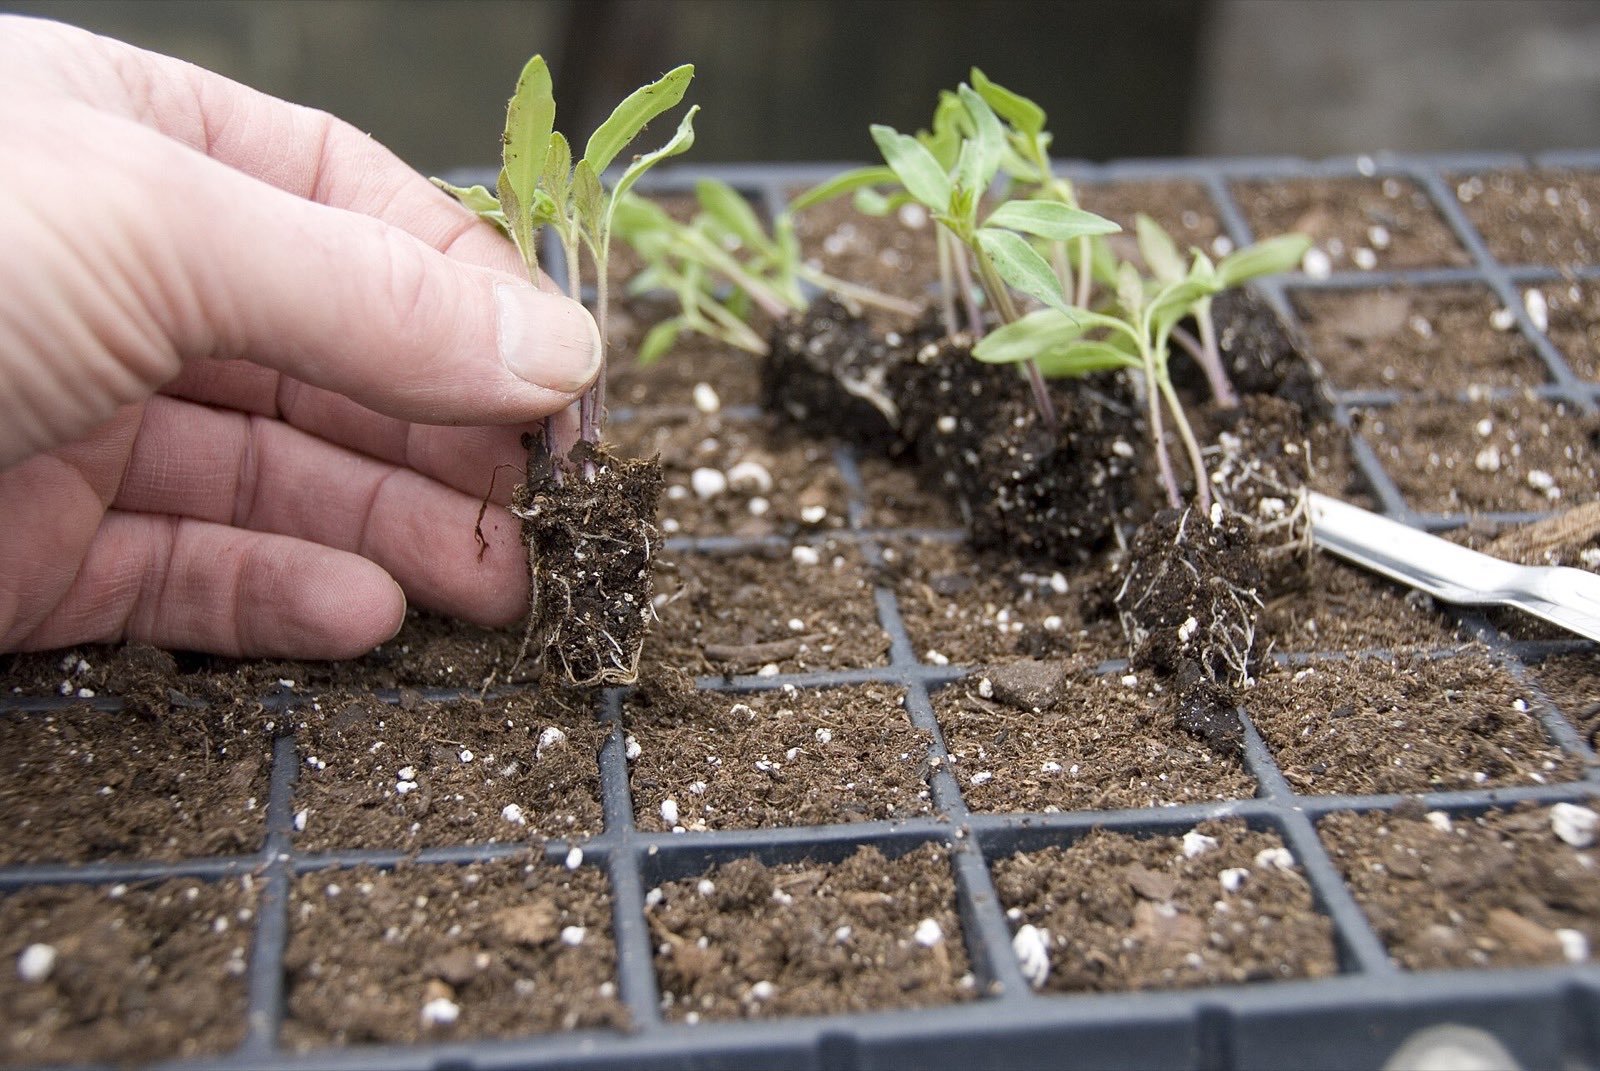
Vegetables are timed the same way as the seed starting calendar: weeks from seed to transplant counted back from the median last frost, and fall crops counted back from the first frost by their days to harvest plus two weeks for the shortening days. Perennials, pruning, mulch, bulbs and winter protection follow the extension pages below. Where a page gives a season rather than a date, the calendar places it by the frost dates and says so. In South Florida and Hawaii, where there is no frost to count from, the vegetable months come from the University of Florida and University of Hawaii planting guides.
- UNH Cooperative Extension, Growing Vegetables: When to Plant your Vegetable Garden, read Sep 21, 2026.
- University of Minnesota Extension, Planting vegetables in midsummer for a fall harvest, read Oct 9, 2026.
- University of Illinois Extension, Planting a fall vegetable garden (Good Growing), read Oct 9, 2026.
- University of Minnesota Extension, Dividing perennials, read Oct 9, 2026.
- Iowa State University Extension and Outreach, How should I prepare my perennial beds for winter?, read Oct 9, 2026.
- University of Minnesota Extension, Pruning trees and shrubs, read Oct 9, 2026.
- Rutgers NJAES Cooperative Extension, Pruning Flowering Shrubs (FS1221), read Oct 9, 2026.
- University of Maryland Extension, Planting a Tree or Shrub, read Oct 9, 2026.
- University of Wisconsin-Madison Division of Extension, Preparing Landscape Plants for Winter, read Oct 9, 2026.
- University of Wisconsin-Madison Division of Extension, Storing Tender Bulbs for Winter, read Oct 9, 2026.
- Iowa State University Extension and Outreach, All About Tulips, read Oct 9, 2026.
- UF/IFAS Gardening Solutions, Tulips, read Oct 9, 2026.
- UF/IFAS Gardening Solutions, Preparing the Landscape for Cold Weather, read Oct 9, 2026.
- UF/IFAS Gardening Solutions, Treating Cold-Damaged Plants, read Oct 9, 2026.
Planting zone questions, answered
Planting zones by state
Frost dates, seeds and bulbs
Sources. USDA Plant Hardiness Zone Map, ZIP code tables (2023 and 2012), PRISM Climate Group, Oregon State University; USDA Plant Hardiness Zone Map; USDA Unveils Updated Plant Hardiness Zone Map (USDA Agricultural Research Service, November 15, 2023); NOAA NCEI U.S. Climate Normals 1991-2020, annual/seasonal, by station (v1.0.1); NC State Extension Gardener Plant Toolbox. Zones and the 2012 comparison are read from the PRISM ZIP code tables; frost dates are the NOAA 1991 to 2020 normals, read Sep 21, 2026; plant ratings are from each plant’s NC State Extension page, read Oct 9, 2026.
A ZIP code’s zone is the zone at its center; a garden on a hilltop or in a frost pocket can sit half a zone either side.