
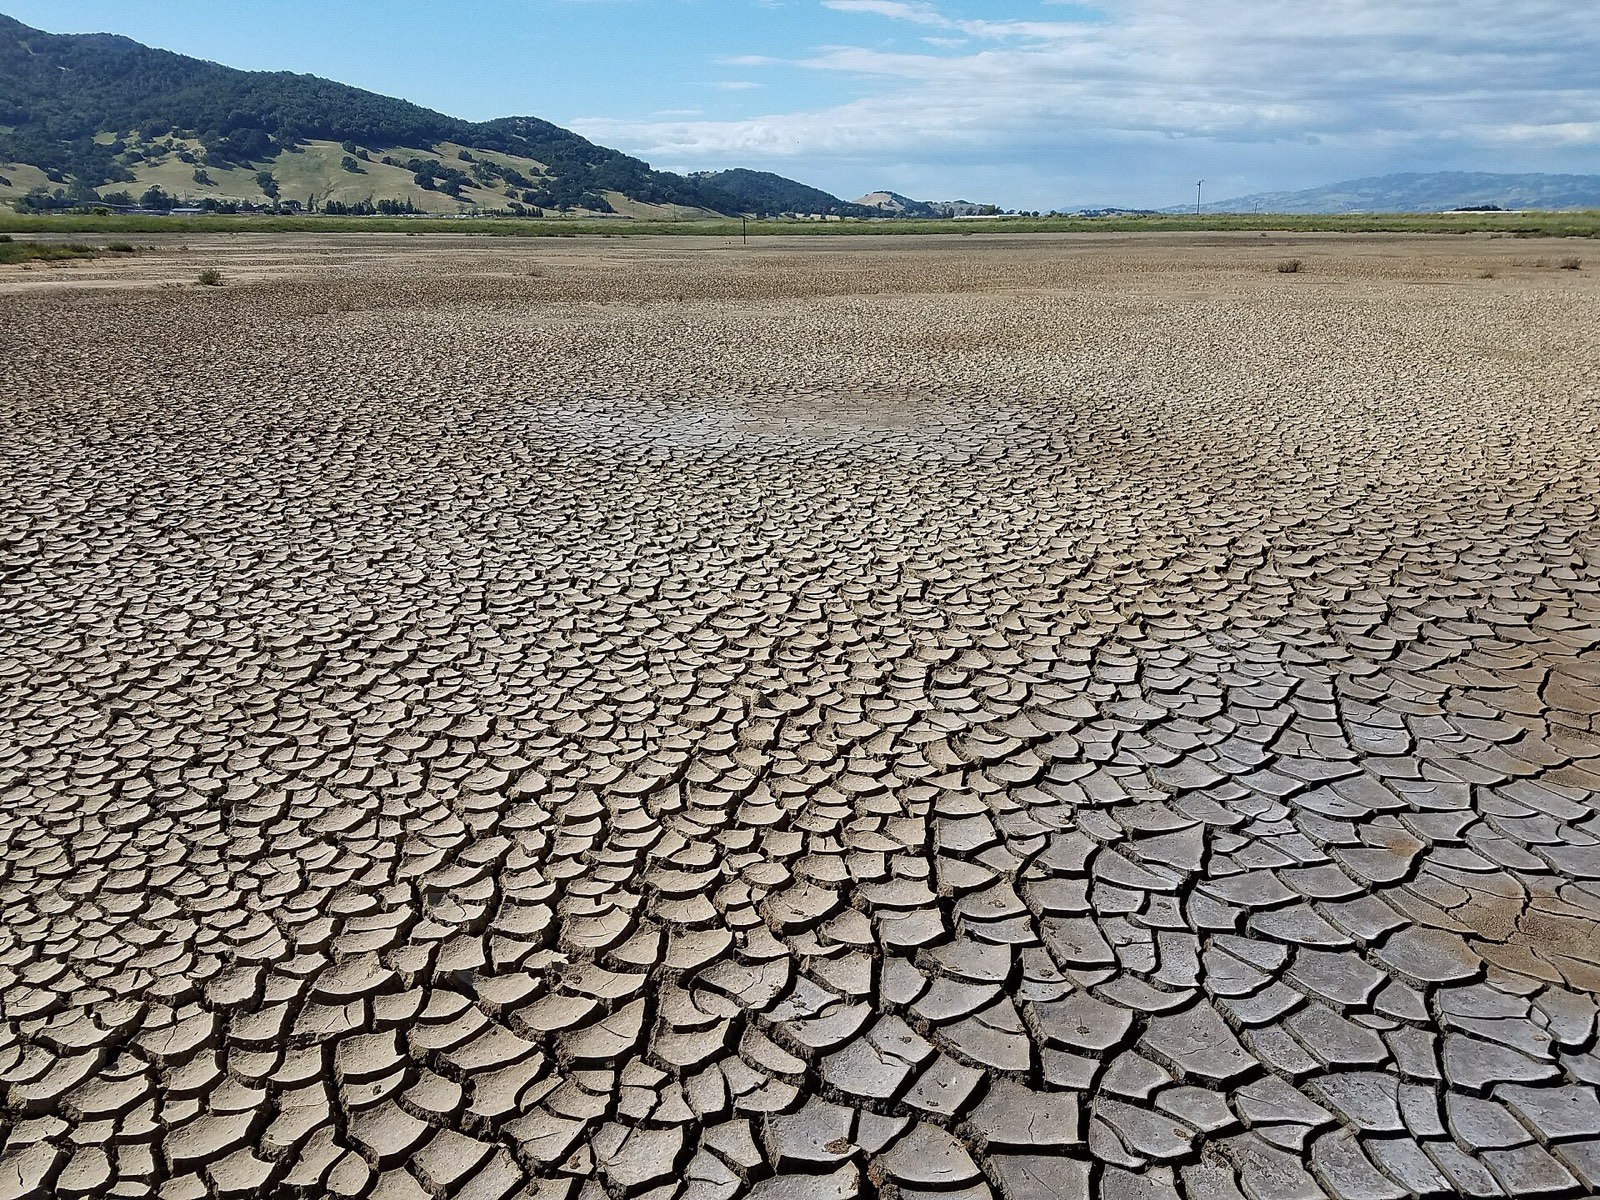
Drought in New Mexico
New Mexico is short of water in a normal year, which changes what a drought even means here. Here is how little precipitation Albuquerque normally gets, the current U.S. Drought Monitor categories, how deep the record goes, and live USGS river readings.
A normal year at Albuquerque brings 8.8 inches of precipitationWhere New Mexico stands in the U.S. Drought Monitor
Everything in the panel below is the U.S. Drought Monitor's own published area percentage for the week valid August 25, 2026, drawn here as numbers and as our own bars. The USDM is released Thursday mornings for conditions valid the preceding Tuesday, so this is a weekly product and this page is refreshed weekly to match it.
| Category | Share of New Mexico | At this level or worse |
|---|---|---|
| D0 Abnormally Dry | 3.6% | 99.2% |
| D1 Moderate Drought | 19.6% | 95.6% |
| D2 Severe Drought | 37.3% | 75.9% |
| D3 Extreme Drought | 31% | 38.7% |
| D4 Exceptional Drought | 7.7% | 7.7% |
33 of New Mexico's 33 counties carry some area in moderate drought or worse this week, and 33 carry some area at least abnormally dry.
Drought category percentages are published by the U.S. Drought Monitor, produced by the National Drought Mitigation Center at the University of Nebraska-Lincoln, the U.S. Department of Agriculture, NOAA and NASA, and republished here as numbers with attribution. See the current map at droughtmonitor.unl.edu.
What 3 New Mexico rivers are doing today
Read live from waterservices.usgs.gov when this page loaded. For each gauge the panel shows the most recent daily mean discharge USGS published, and where that value sits inside USGS's own percentiles for the same calendar day over that gauge's full period of daily record. The comparison is arithmetic on two agency numbers, and a low reading at one gauge is not a statement about the state.
Reading current daily mean discharge from waterservices.usgs.gov.
Discharge and percentiles are the U.S. Geological Survey's own published values, read live in your browser when this page loaded and shown without adjustment. The percentile is USGS's comparison of today's daily mean against its record for this same calendar day at this same gauge. Most large American rivers are managed to some degree, so a reading is never a pure weather signal. Source: USGS Water Data for the Nation
A river reading is one link in a chain, and it is worth seeing the whole chain, because it is the reason a drought can be over on paper and still be a problem at the tap. USGS:
USGS Water Science School, Droughts: Things to Know“When little or no rain falls, soils can dry out and plants can die. When rainfall is less than normal for several weeks, months, or years, the flow of streams and rivers declines, water levels in lakes and reservoirs fall, and the depth to water in wells increases. If dry weather persists and water-supply problems develop, the dry period can become a drought (Moreland, 1993).”
USGS Water Science School, Droughts: Things to Know“The first evidence of drought usually is seen in records of rainfall. Within a short period of time, the amount of moisture in soils can begin to decrease. The effects of a drought on flow in streams and reservoirs may not be noticed for several weeks or months. Water levels in wells may not reflect a shortage of rainfall for a year or more after a drought begins (Moreland, 1993).”
The end of that chain is the part nobody can see. Where New Mexico households are on their own wells rather than a public system, the water level in the well is the last thing to fall and the last thing to come back:
USGS Water Science School, Droughts: Things to Know“The water level in the aquifer that supplies a well does not always stay the same. Droughts, seasonal variations in rainfall, and pumping affect the height of the underground water levels. If a well is pumped at a faster rate than the aquifer around it is recharged by precipitation or other underground flow, then water levels in the well can be lowered.”
The lag runs in both directions, and it is the single most useful thing to know about river readings during a dry spell. A New Mexico river can look completely ordinary several weeks into a drought, and can still be running low weeks after the rain came back. Which gauges appear here is our choice, made once: active surface water sites with at least 30 years of daily record, filtered to drop canals, ditches and diversions, then spread across the state so all three are not on the same river. That filter does not make a river unregulated. Most large American rivers are managed to some degree, so treat a reading as a river measurement rather than as a pure weather signal.
How little water a normal New Mexico year brings
Albuquerque averages 8.8 inches of precipitation a year. Put that next to the sixty odd inches a Gulf Coast station gets and the arithmetic of a drought changes completely: two missing inches is a rounding error in Louisiana and a large share of the annual budget here. It is also why a state this dry can be short of water in a year with perfectly normal precipitation, if the shortfall landed on the snowpack.
| NOAA station | Yearly normal | Wettest month | Driest month | Driest 3 months | Share of the year |
|---|---|---|---|---|---|
| Albuquerque | 8.8 in | July (1.6 in) | January (0.4 in) | Jan to Mar | 14.1% |
| Roswell | 11.6 in | July (1.8 in) | February (0.4 in) | Jan to Mar | 10.7% |
| Farmington | 7.8 in | September (1.1 in) | June (0.2 in) | Apr to Jun | 16.6% |
Yearly and monthly normals are quoted from NOAA NCEI's published 1991 to 2020 U.S. Climate Normals for New Mexico's reference stations. The driest and wettest month and the driest three consecutive months are our own reductions of those twelve published values.
Wettest month
the highest monthly normal once NOAA's published values are averaged across 3 New Mexico reference stations.
Our reduction of NOAA normalsDriest month
on the same average. 1 of the 3 stations pick that month individually too. The driest three month run at Albuquerque is Jan to Mar.
Our reduction of NOAA normalsWettest to driest station
between Roswell and Farmington. A statewide drought percentage hides this entirely.
NOAA annual normals
How deep the New Mexico record goes
U.S. Drought Monitor, January 4, 2000 to nowNew Mexico takes its driest stretch in late winter and early spring, ahead of a monsoon that arrives in July or does not. The Rio Grande through Albuquerque runs on upstream storage and on a compact with two other states, so its flow is only partly a weather signal.
What D0 through D4 actually mean
The five category codes on this page are the U.S. Drought Monitor's, and they are the scale that federal disaster designations, many state drought plans, and a lot of utility and insurance triggers actually run on. The authoritative definitions live with the people who write them, at droughtmonitor.unl.edu. The short descriptions below are ours, written from scratch.
- D0 Abnormally Dry
- Not yet drought in USDM terms. This is the band on either end of a drought: soil drying out on the way in, or refilling on the way out.
- D1 Moderate Drought
- The first true drought category. Where most state agencies start paying attention and where voluntary conservation asks tend to begin.
- D2 Severe Drought
- Water supply and agriculture are both taking a measurable hit. Restrictions and USDA disaster designations cluster around here and worse.
- D3 Extreme Drought
- Uncommon anywhere. A state with a lot of area in D3 is having a year people will still be talking about in a decade.
- D4 Exceptional Drought
- The top of the scale, and rare. Several states have never recorded any D4 area at all since the record opened in 2000.
Category codes and names are the U.S. Drought Monitor's; the descriptions are ours.
One more distinction worth having, because it explains how New Mexico can be out of one kind of drought and deep in another at the same time. The National Weather Service names four kinds:
National Weather Service, Drought Safety“Meteorological drought is based on the degree of dryness (rainfall deficit) and the length of the dry period.”
National Weather Service, Drought Safety“Hydrologic drought is based on the impact of rainfall deficits on the water supply such as stream flow, reservoir and lake levels, and ground water table decline.”
National Weather Service, Drought Safety“Agricultural drought is based on the impacts to agriculture by factors such as rainfall deficits, soil water deficits, reduced groundwater, or reservoir levels needed for irrigation.”
They move on different clocks. Rain fixes the meteorological one first, the agricultural one next, and the hydrologic one last, which is why reservoirs and wells are still recovering long after the lawns have gone green again.
Drought category percentages are published by the U.S. Drought Monitor, produced by the National Drought Mitigation Center at the University of Nebraska-Lincoln, the U.S. Department of Agriculture, NOAA and NASA, and republished here as numbers with attribution. See the current map at droughtmonitor.unl.edu.
Where the New Mexico figures come from
Three sources, kept apart. The drought categories are the U.S. Drought Monitor's own published area percentages, produced by the National Drought Mitigation Center at the University of Nebraska-Lincoln, the U.S. Department of Agriculture, NOAA and NASA, republished here as numbers with attribution and refreshed weekly. The precipitation figures are NOAA NCEI's published 1991 to 2020 climate normals; the driest month, the driest three month run and the state rollup are our own reductions of NOAA's twelve published monthly values and are labelled as ours every time they appear. The river readings are live from USGS.
The thing that is missing on purpose: there is no drought score, index or rating of ours anywhere on this site. USDM already publishes the category scale everyone uses and USGS already publishes streamflow percentiles, so a competing number of ours would add confusion and nothing else.
The USDM numbers are a committed weekly snapshot rather than a live read, and that is a constraint rather than a preference. The USDM data service sends no cross origin header, so a browser cannot read it at all; we verified that from a real browser session on this site's own origin rather than assuming it. Since the product itself is weekly, a weekly snapshot is exactly as current as the map it mirrors, and every panel on this page stamps the week it is showing. The river panel is genuinely live, because the USGS services are open.
This page is shaped by the data rather than by editorial taste. New Mexico is on the “dry by default” shape because its primary station averages under 20 inches a year with no warm season dry season. Those thresholds are judgements and are stated as judgements; each one sits in a real gap in the data rather than in the middle of a cluster, and the test suite fails the build if a data refresh closes one.
Sources: U.S. Drought Monitor, NOAA NCEI 1991-2020 U.S. Climate Normals, USGS Water Data for the Nation, and NOAA NIDIS drought.gov for the national picture and outlooks.
A note on what the USDM is, in our words rather than theirs. It is not a model output. A rotating group of authors builds each week's map by reconciling several drought indices with soil moisture, streamflow, snowpack and reservoir data and with reports from local observers, and the result is a judgement informed by all of it. That is a strength when you want a number that reflects conditions on the ground, and it is worth knowing when you are comparing one week to the next.
Our summary of information published by U.S. Drought Monitor
New Mexico drought FAQ
What a dry year in New Mexico touches next
Drought in nearby states
Drought category percentages are published by the U.S. Drought Monitor, produced by the National Drought Mitigation Center at the University of Nebraska-Lincoln, the U.S. Department of Agriculture, NOAA and NASA, and are republished here as numbers with attribution; the map itself is at droughtmonitor.unl.edu. Precipitation normals are quoted from NOAA NCEI, and the monthly reductions are ours. River readings come live from the U.S. Geological Survey. National picture: drought in every state