
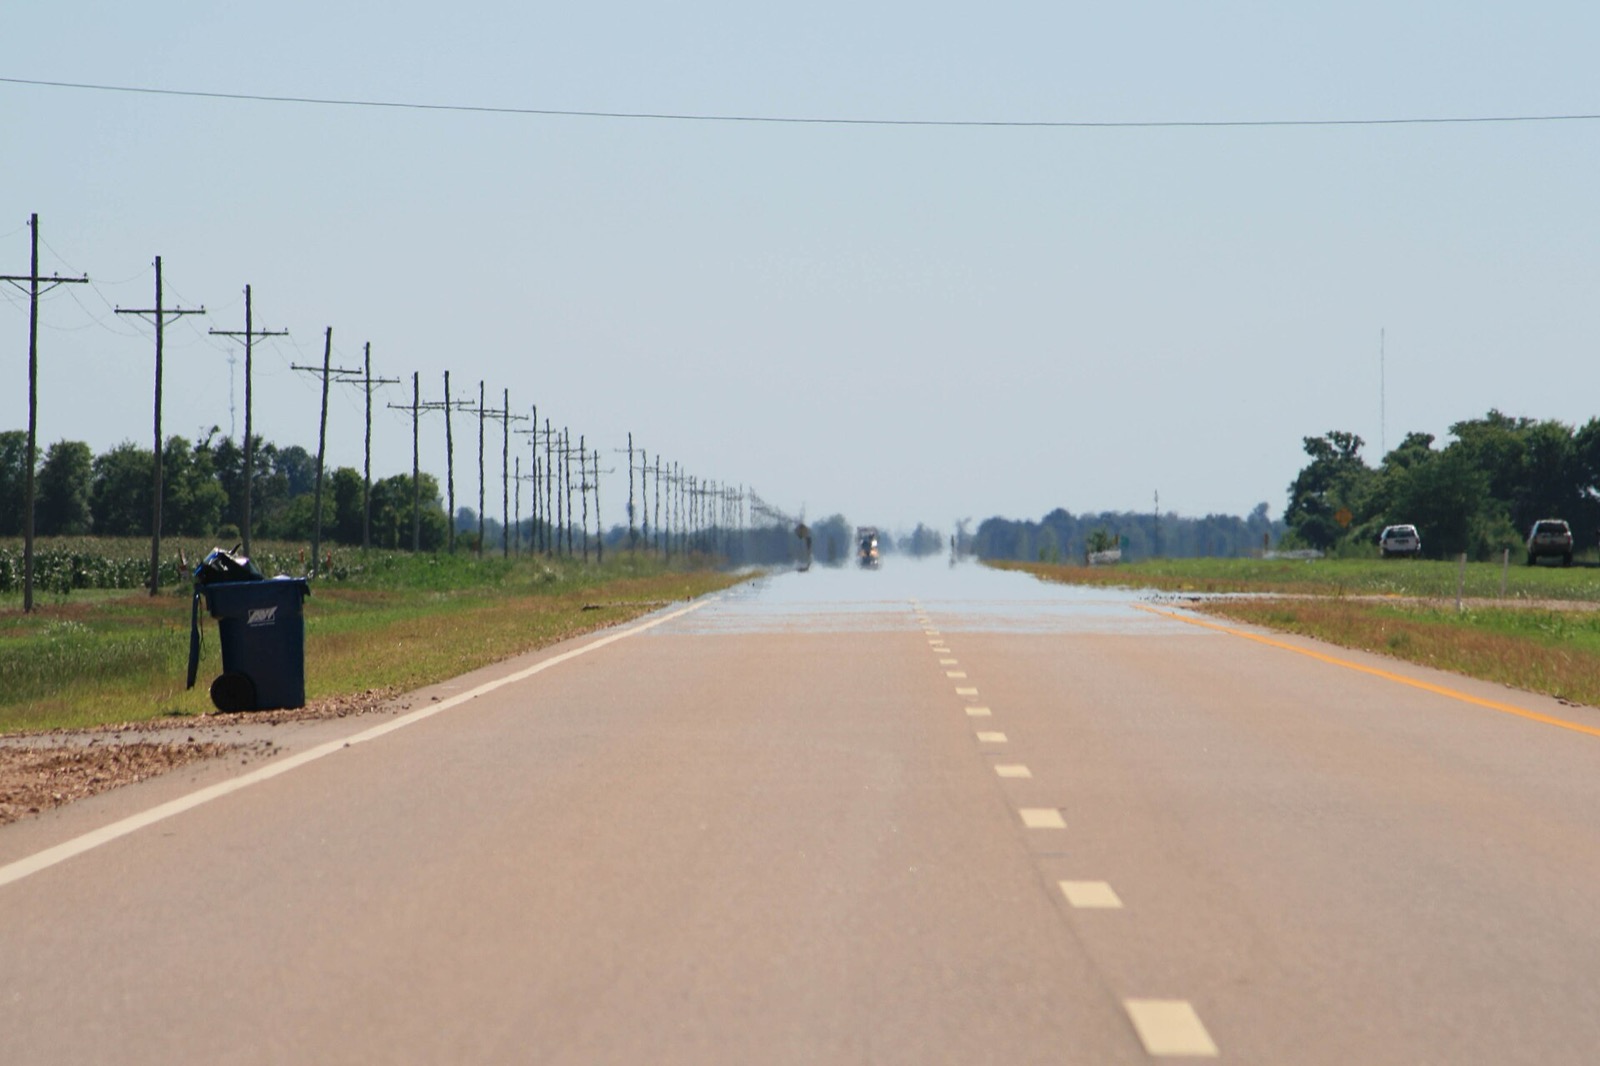
Heat Season in Arkansas
In Arkansas, 90 F is not an event, it is most of the summer. Here is how long the hot season actually runs at Little Rock, how many days clear 100 F, how many nights never drop below 75 F, and what the National Weather Service has issued right now.
Little Rock averages 76 days a year at or above 90 FArkansas's 90 degree season
1991-2020, Little RockLittle Rock sits where Delta humidity meets the Ouachitas, and El Dorado in the south pine country is hotter still. Fayetteville on the Ozark Plateau is the state's cool corner by about a thousand feet of elevation.
Heat across Arkansas, station by station
A single state number would hide the thing that actually matters: elevation, latitude and distance from water move these figures further inside Arkansas than a whole decade of warming does. Each row is one NOAA reference station. The day counts are quoted from NOAA's published 1991 to 2020 normals; the dates and the warm night counts are our own derivation from the same agency's daily observations, because NOAA publishes no date shaped heat normal.
| Station | Days 90 F or hotter | Days 100 F or hotter | First 90 F day | Last 90 F day | Nights 75 F or warmer |
|---|---|---|---|---|---|
| Little Rock | 76 | 7.5 | May 20 | September 30 | 25 |
| Fayetteville | 41 | 2.3 | June 19 | September 12 | 2.8 |
| El Dorado | 88 | 7 | May 18 | October 6 | 12 |
Hottest days
days a year at or above 90 F at El Dorado, the highest of this page's Arkansas stations.
Quoted NOAA normalWarmest nights
nights a year at Little Rock whose low never falls below 75 F.
Our derivationHottest on record
at Little Rock on August 3, 2011, in a station record running 1938 to 2026.
Our derivation
The nights are the story, not the afternoons
Almost every heat page on the internet counts hot days. Very few count hot nights, and the overnight low is the half of the day that decides what a hot spell actually does. A 98 degree afternoon followed by a 68 degree night is a completely different event from a 94 degree afternoon followed by a night that never leaves the 80s: buildings shed their stored heat overnight, air conditioning gets its only break overnight, and the body's recovery happens overnight.
In Arkansas, Little Rock averages 25 nights a year whose low never falls below 75 F, and its warmest night on record bottomed out at 85 F. NOAA's published normals stop at 70 F, so the 75 F count is our own arithmetic on NOAA's daily minimum temperatures over the same 30 years as every quoted normal on this page.
Nights that stay above 75 F
a year at Little Rock. Derived from NOAA daily minimum temperatures, 1991 to 2020.
Our derivationNights that stay above 70 F
a year at Little Rock, on the same derivation. The gap between this and the 75 F figure is the band where a night is warm but still recovering.
Our derivationCross check against NOAA
This site's count of 90 F days at Little Rock against NOAA's published normal for the same station and years. The check runs on every station in this dataset; the warm night counts use the same method against a threshold NOAA does not publish.
Derived vs NOAA's
What the National Weather Service has out in Arkansas
Everything below is read live from api.weather.gov when this page loads and is shown exactly as the issuing forecast office wrote it, with the office named.
Checking api.weather.gov for active heat products.
Product text, issuing office, area and times are passed through exactly as the National Weather Service issued them. As of 2025 the NWS uses three heat products: Extreme Heat Warning, Extreme Heat Watch and Heat Advisory. Read . Source: api.weather.gov
Loading the National Weather Service gridpoint forecast.
When Arkansas actually needs cooling
Cooling degree days are the measure utilities and mechanical engineers plan against, and NOAA publishes them directly, so every figure in this section is quoted rather than calculated by us. One cooling degree day is one degree of daily mean temperature above 65 F, added up. At Little Rock the peak month is July, and the months carrying real cooling demand run May through October.
NOAA's 1991 to 2020 normals publish four things these pages quote directly: annual and monthly cooling degree days, the mean number of days a year at or above 90 F, the same at 100 F, and the mean number of days whose low stays under 70 F. NOAA publishes nothing date shaped for heat and nothing about nights warmer than 70 F, so the dates and the 75 F counts on this page are this site's derivation, labelled as such.
Our summary of information published by NOAA NCEI 1991-2020 U.S. Climate Normals
What the agencies say, in their own words
The heat index is a National Weather Service product. Where a heat index appears on this page it is the value the NWS itself published for that gridpoint. Here is the NWS defining it, and here is the caveat that gets left out most often:
National Weather Service, Heat Forecast Tools“The Heat Index is a measure of how hot it really feels when relative humidity is factored in with the actual air temperature.”
National Weather Service, Heat Forecast Tools“Since heat index values were devised for shady, light wind conditions, exposure to full sunshine can increase heat index values by up to 15°F. Also, strong winds, particularly with very hot, dry air, can be extremely hazardous.”
That second quote is the one worth rereading. A heat index is a shade figure. The NWS publishes the full heat index chart, which pairs air temperature against relative humidity, at weather.gov/safety/heat-index, and that chart is the thing to read rather than any version of it we could redraw.
Heat and health: the agencies, in their own words
Health guidance on heat comes from the National Weather Service and the CDC. Their words are below, and their full guidance is linked.
The National Weather Service on who heat affects: “Heat can be very taxing on the body and can lead to heat related illnesses or make existing health conditions worse. Everyone can be vulnerable to heat, but some more so than others.” (National Weather Service, Heat Safety Tips and Resources)
The CDC on knowing when something is wrong: “If your body gets too hot, you can get sick. Know the symptoms of your body overheating and know when to seek medical care.” (CDC, About Heat and Your Health)
Full guidance: NWS heat safety and CDC Heat and Health. The CDC also runs a CDC HeatRisk Dashboard for forecast heat by ZIP code.
On the warning signs of heat illness, the National Weather Service is quoted directly below. We have nothing to add to it and no business rephrasing it.
National Weather Service, Heat Cramps, Exhaustion, Stroke“Symptoms: Heavy sweating; weakness or tiredness; cool, pale, clammy skin; fast, weak pulse; muscle cramps; dizziness, nausea or vomiting; headache; fainting.”
National Weather Service, Heat Cramps, Exhaustion, Stroke“Symptoms: Throbbing headache; confusion; slurred speech; nausea; dizziness; body temperature above 103°F; hot, red, dry or damp skin; rapid and strong pulse; fainting; loss of consciousness.”
National Weather Service, Heat Cramps, Exhaustion, Stroke“Call 911 or get the victim to a hospital immediately. Heat stroke is a severe medical emergency. Delay can be fatal.”
CDC, About Heat and Your Health“Use fans, but only if indoor temperatures are less than 90°F. In temperatures above 90°F, a fan can increase body temperature.”
National Weather Service, Heat Safety Tips and Resources“It is NEVER safe to leave a child, disabled person or pet locked in a car, even in the winter.”

How the Arkansas figures are calculated
Two registers, kept apart. Quoted: the day counts and the cooling degree days are NOAA NCEI's published 1991 to 2020 U.S. Climate Normals, printed here as NOAA publishes them. Derived: the first and last 90 F dates, the season span and the warm night counts are ours, computed from NOAA NCEI GHCN-Daily station observations over the same 30 years, because the normals product publishes no date shaped heat variable and stops at 70 F for nights.
The rules are the same at every station. A 90 F day is a day whose high reached 90 F or more with a clean NOAA quality flag. A warm night is a day whose low never fell below 75 F. A year only counts if at least 85 percent of its days reported; incomplete years are excluded rather than filled in. Percentile dates are the 10th, 50th and 90th over the years that qualified, and where a percentile lands on a year that never reached 90 F at all, no date is printed. Records use each station's full period of record, which runs decades further back than the normals period.
The cross check: NOAA publishes a 90 F day count, and this site computes its own from the daily records. Across all 150 stations in this dataset the two agree within two days a year at 149 of them, and the single exception is a station missing eight of its thirty years. The warm night counts use exactly the same counting rule against a threshold NOAA does not publish, which is the best evidence available that they are right. One detail matters if you try to reproduce this: a station reports whole degrees Fahrenheit, and NOAA's day count normals include the threshold itself, so a night recorded at exactly 75 F counts as a 75 F night here, as it does for NOAA.
The page's shape follows those numbers. Where a state's primary station clears 90 F on 30 or more days a year, a first 90 F date carries almost no information and the page leads with season length and nights instead. Where the station reaches 90 F in fewer than half of years, there is no median and the page leads with cooling degree days, records and warm nights. Arkansas is on the routine heat shape.
Live conditions come from api.weather.gov, read in your browser at page load. Sources: NOAA NCEI 1991-2020 U.S. Climate Normals, NOAA NCEI GHCN-Daily. Both are US Government works in the public domain.
Arkansas heat season FAQ
The rest of Arkansas's summer
Heat season in nearby states
Day counts and cooling degree days are quoted from NOAA NCEI's 1991-2020 U.S. Climate Normals. Dates, season spans and warm night counts are our derivation from NOAA NCEI GHCN-Daily observations over the same period. Live products come from the National Weather Service and are shown verbatim. National picture: heat season in every state