
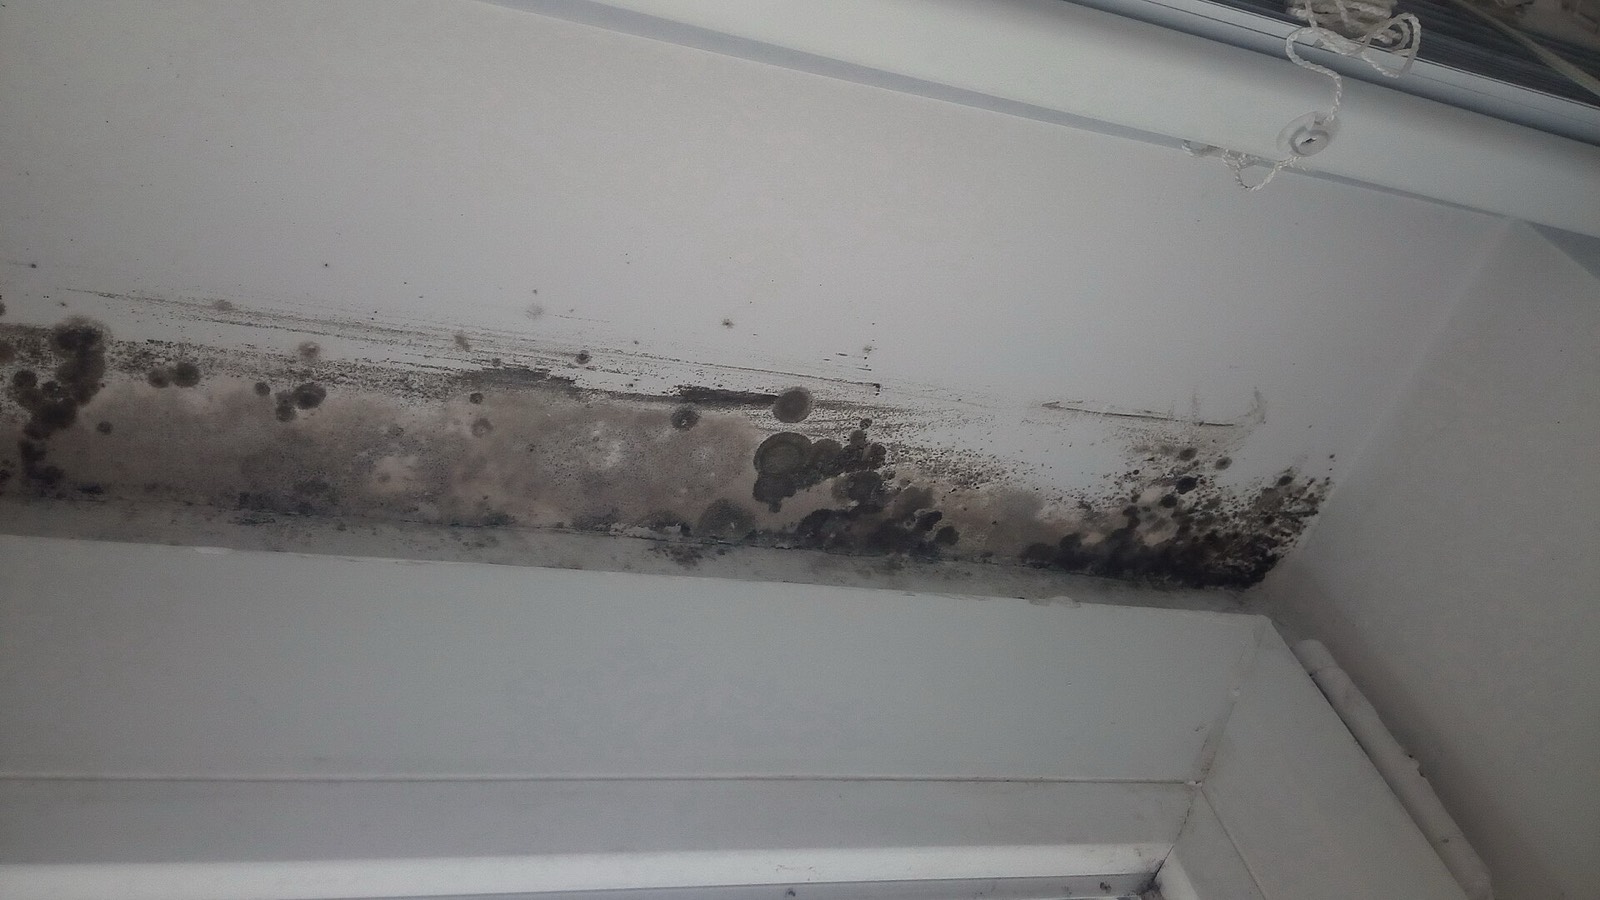
New Jersey Mold Season: The Moisture Calendar
Shore humidity over old basements. Which months make indoor moisture hardest to control in New Jersey, and why, from NOAA's published normals.
Warmest dew point of the year: July, averaging 64.9°FNew Jersey moisture at a glance
NOAA normals, 1991-2020Averaged across 3 NOAA stations in New Jersey that publishes dew point normals around the clock: Newark, Atlantic City, Millville. These are outdoor measurements. They describe the moisture load a building here has to work against, not the conditions inside any particular building.
When the air in New Jersey carries the most water
The chart below is NOAA’s 1991-2020 hourly dew point normals for New Jersey, folded into a single year. Each bar is the month’s mean dew point; the dashed tick above it is NOAA’s published 90th percentile, the level the dew point passes in roughly one hour in ten. Bar colour is the National Weather Service band the monthly mean falls in.
The chart uses dew point rather than relative humidity. Relative humidity tells you how close air is to saturation at its own temperature, which changes the moment the air moves indoors. Dew point tells you how much water is actually in it, and it does not change when you heat or cool the air. It is the number that decides whether a cold surface will get wet.
Why the National Weather Service says to watch dew point“So if you want a real judge of just how "dry" or "humid" it will feel outside, look at the dew point instead of the RH. The higher the dew point, the muggier it will feel.”
NOAA National Weather Service, La Crosse WI, Dew Point vs Humidity, quoted verbatim.
In New Jersey the warmest month for dew point is July, averaging 64.9°F, with a 90th percentile of 72.6°F. The driest is January at 22.6°F. Months whose mean sits at or above the National Weather Service "sticky" line: June through September.
New Jersey has more than one moisture season
Almost every state runs two of these, and they are not the same problem in different weather. One is outdoor moisture pushing in during the warm months. The other is indoor moisture condensing on cold surfaces during the cold ones, and it is driven by the temperature difference rather than by anything happening outside the walls. The order of the two cards below is the order they matter in New Jersey.
The warm season: moisture arrives from outside
July is the top of the New Jersey year at a mean dew point of 64.9°F, and NOAA's 90th percentile for the month reaches 72.6°F. Air carrying that much water gives up some of it on any surface colder than its dew point, and in a house the cold surfaces are the ones nobody looks at: the slab, the cold water line, the duct running through an unconditioned space.
This is the season where ventilating a basement or a crawl space with outdoor air can leave it wetter than it started.
The cold season: moisture is already inside
January averages 33°F outside with a mean dew point of 22.6°F. Bring that air indoors and warm it to 70F without adding anything and it lands at about 17% relative humidity. Outdoor air is not the moisture source in January; showers, cooking, laundry and breathing are.
That moisture then finds the coldest interior surface it can reach, which is why the cold-season pattern shows up on window glass, in corners on exterior walls and behind furniture pushed against them.
What actually drives it here
New Jersey mixes a dense older housing stock in the north with resort and shore construction in the south, and the two respond very differently. Newark and the Highlands are full basement territory with masonry walls that stay cool and damp, and the cold months add the usual interior condensation on glass and exterior corners. Down toward Atlantic City and Millville the water table is high and the humid season is longer, so ground coupling and slow drying carry more weight. Coastal wind driven rain finds gaps in siding that inland rain never reaches.
- Warm season air from the Atlantic and the Delaware Valley stays humid for a long stretch, and a cool basement pulls water out of it on contact.
- Cooled interiors chill wall cavities below the outdoor dew point, so humid air entering through gaps in the envelope condenses inside the assembly.
- The Pine Barrens sit on sandy soil over a shallow aquifer, so ground moisture is close beneath a great many buildings across the southern counties.
The dew point scale, in the Weather Service’s words
Every band on this page is one of the three below, quoted from the National Weather Service office in La Crosse and applied to the published dew point for each month.
General comfort levels USING DEW POINT that can be expected during the summer months:
| Dew point, degrees F | What the National Weather Service calls it |
|---|---|
| less than or equal to 55 | dry and comfortable |
| between 55 and 65 | becoming "sticky" with muggy evenings |
| greater than or equal to 65 | lots of moisture in the air, becoming oppressive |
Wording, cut points and ordering quoted exactly from NOAA National Weather Service, La Crosse WI, Dew Point vs Humidity. The colours are ours, for the chart only.
What a dew point actually is“The dew point is the temperature the air needs to be cooled to (at constant pressure) in order to achieve a relative humidity (RH) of 100%. At this point the air cannot hold more water in the gas form.”
NOAA National Weather Service, La Crosse WI, Dew Point vs Humidity, quoted verbatim.
Every month in New Jersey, with the numbers behind it
| Month | Mean dew point | 90th pct dew point | Mean temperature | Warmed to 70F indoors | NWS band |
|---|---|---|---|---|---|
| January | 22.6°F | 40.8°F | 33°F | 17% RH | dry and comfortable |
| February | 23.8°F | 41.2°F | 35.4°F | 17% RH | dry and comfortable |
| March | 29.3°F | 46.3°F | 42.4°F | 22% RH | dry and comfortable |
| April | 38.7°F | 53.4°F | 52.5°F | 32% RH | dry and comfortable |
| May | 49.5°F | 61.5°F | 62°F | 48% RH | dry and comfortable |
| June | 59.8°F | 69.3°F | 71.6°F | 70% RH | becoming "sticky" with muggy evenings |
| July | 64.9°F | 72.6°F | 76.7°F | 84% RH | becoming "sticky" with muggy evenings |
| August | 64.3°F | 72.4°F | 74.6°F | 82% RH | becoming "sticky" with muggy evenings |
| September | 57.9°F | 69.2°F | 67.7°F | 66% RH | becoming "sticky" with muggy evenings |
| October | 46.7°F | 61.4°F | 56.6°F | 43% RH | dry and comfortable |
| November | 36.5°F | 54.3°F | 47°F | 29% RH | dry and comfortable |
| December | 27.3°F | 45.9°F | 37.5°F | 20% RH | dry and comfortable |
The “warmed to 70F indoors” column answers the winter half of the question and it is our arithmetic, not NOAA’s: take outdoor air at that month’s mean dew point, warm it to 70F, add no moisture, and that is the relative humidity it lands at. It is why a cold month outdoors makes a dry room indoors, and why the moisture that fogs a window in January came from inside the house.
What EPA says about mold and moisture
This section is EPA’s words. MyWild publishes the calendar; the subject itself belongs to the agency that has written about it, and every block below is reproduced exactly with a link to the source.
The whole subject in one sentence“The key to mold control is moisture control.”
US EPA, A Brief Guide to Mold, Moisture and Your Home, quoted verbatim.
What starts it“Mold may begin growing indoors when mold spores land on surfaces that are wet. There are many types of mold, and none of them will grow without water or moisture.”
US EPA, A Brief Guide to Mold, Moisture and Your Home, quoted verbatim.
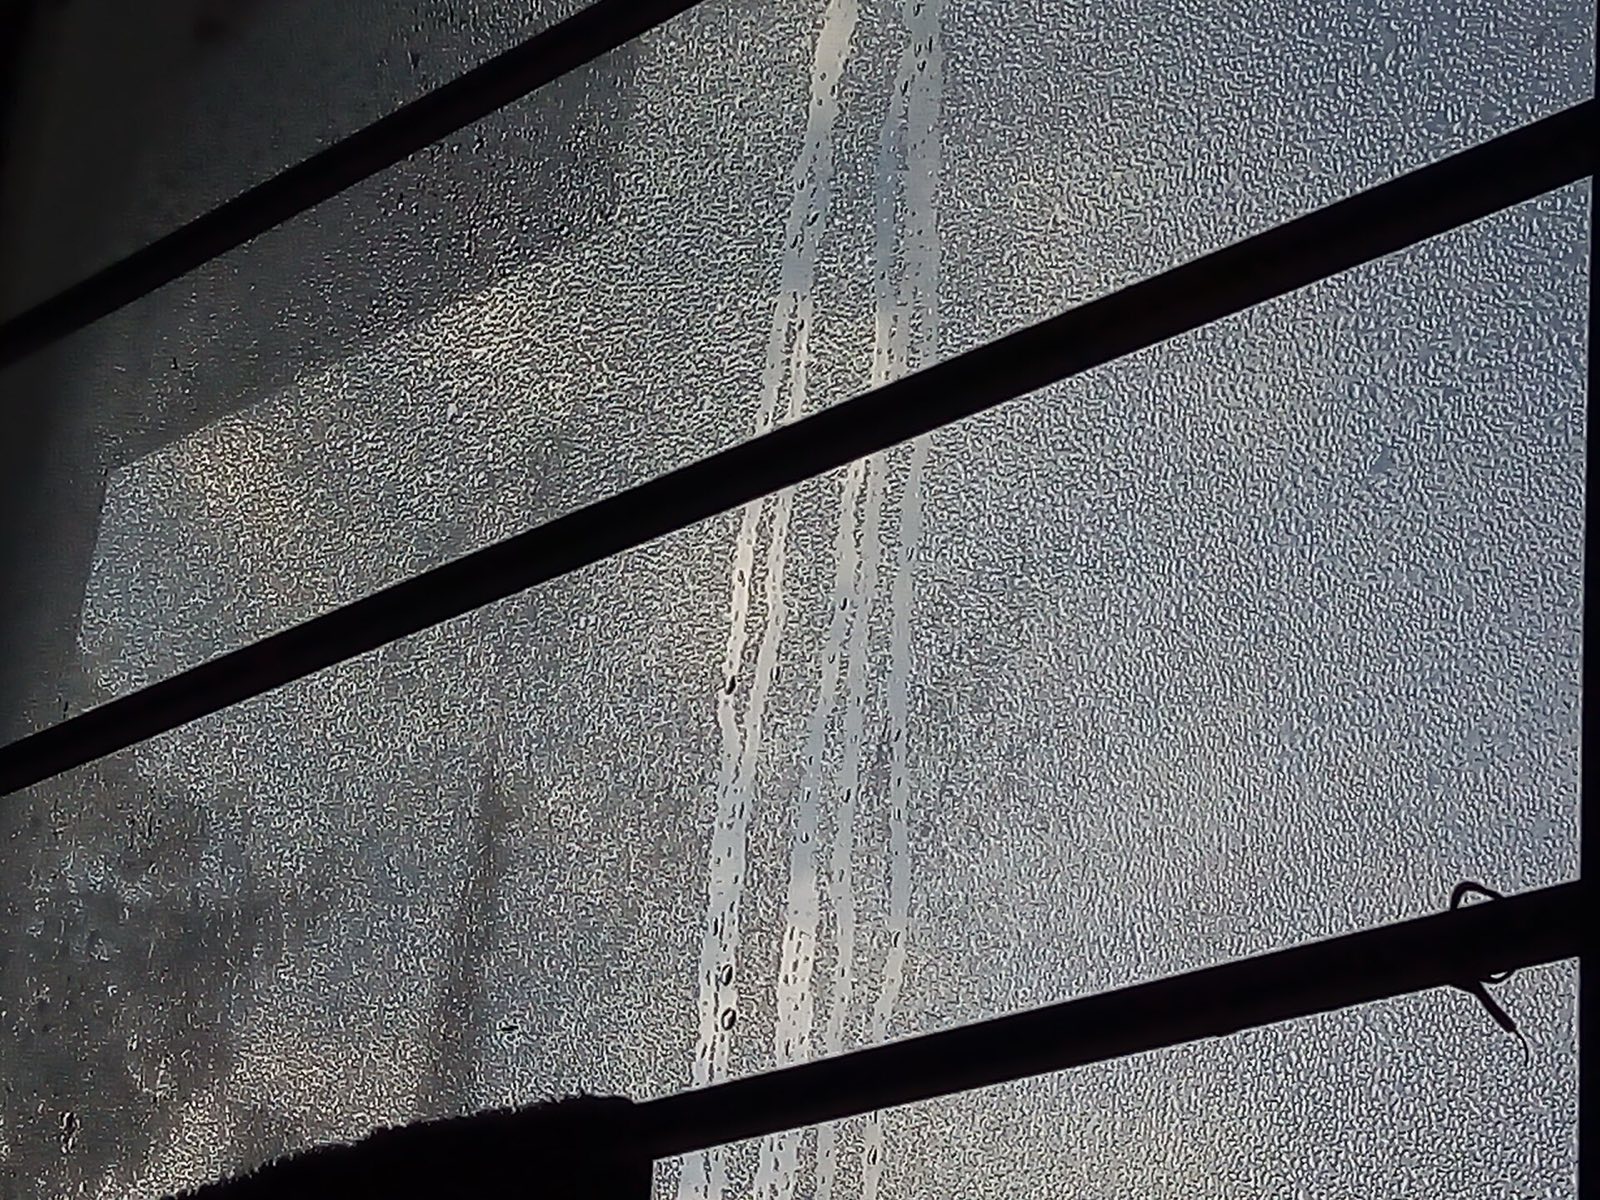
How condensation makes a wet surface“Condensation can be a sign of high humidity. When warm, humid air contacts a cold surface, condensation may form.”
US EPA, Mold Course, Chapter 2, quoted verbatim.
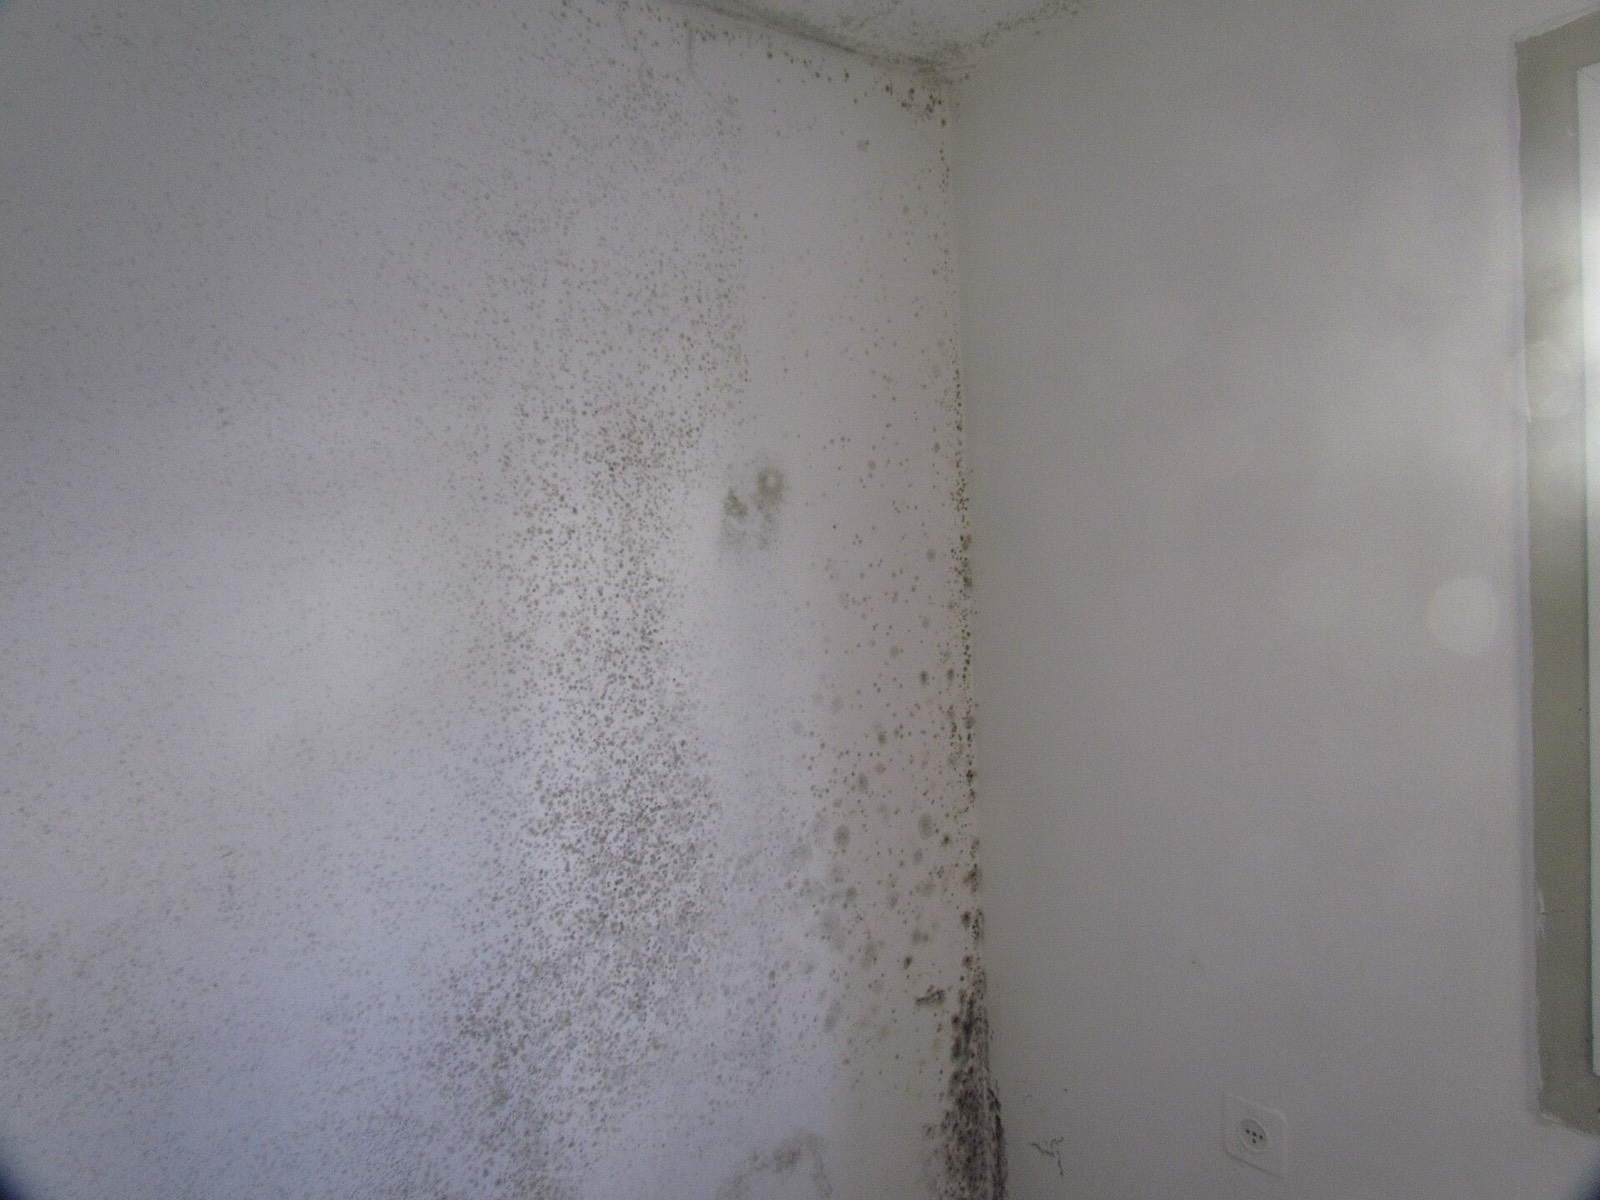
Where it turns up in a cold house“Mold is frequently found on walls in cold corners behind furniture where condensation forms.”
US EPA, Mold Course, Chapter 2, quoted verbatim.
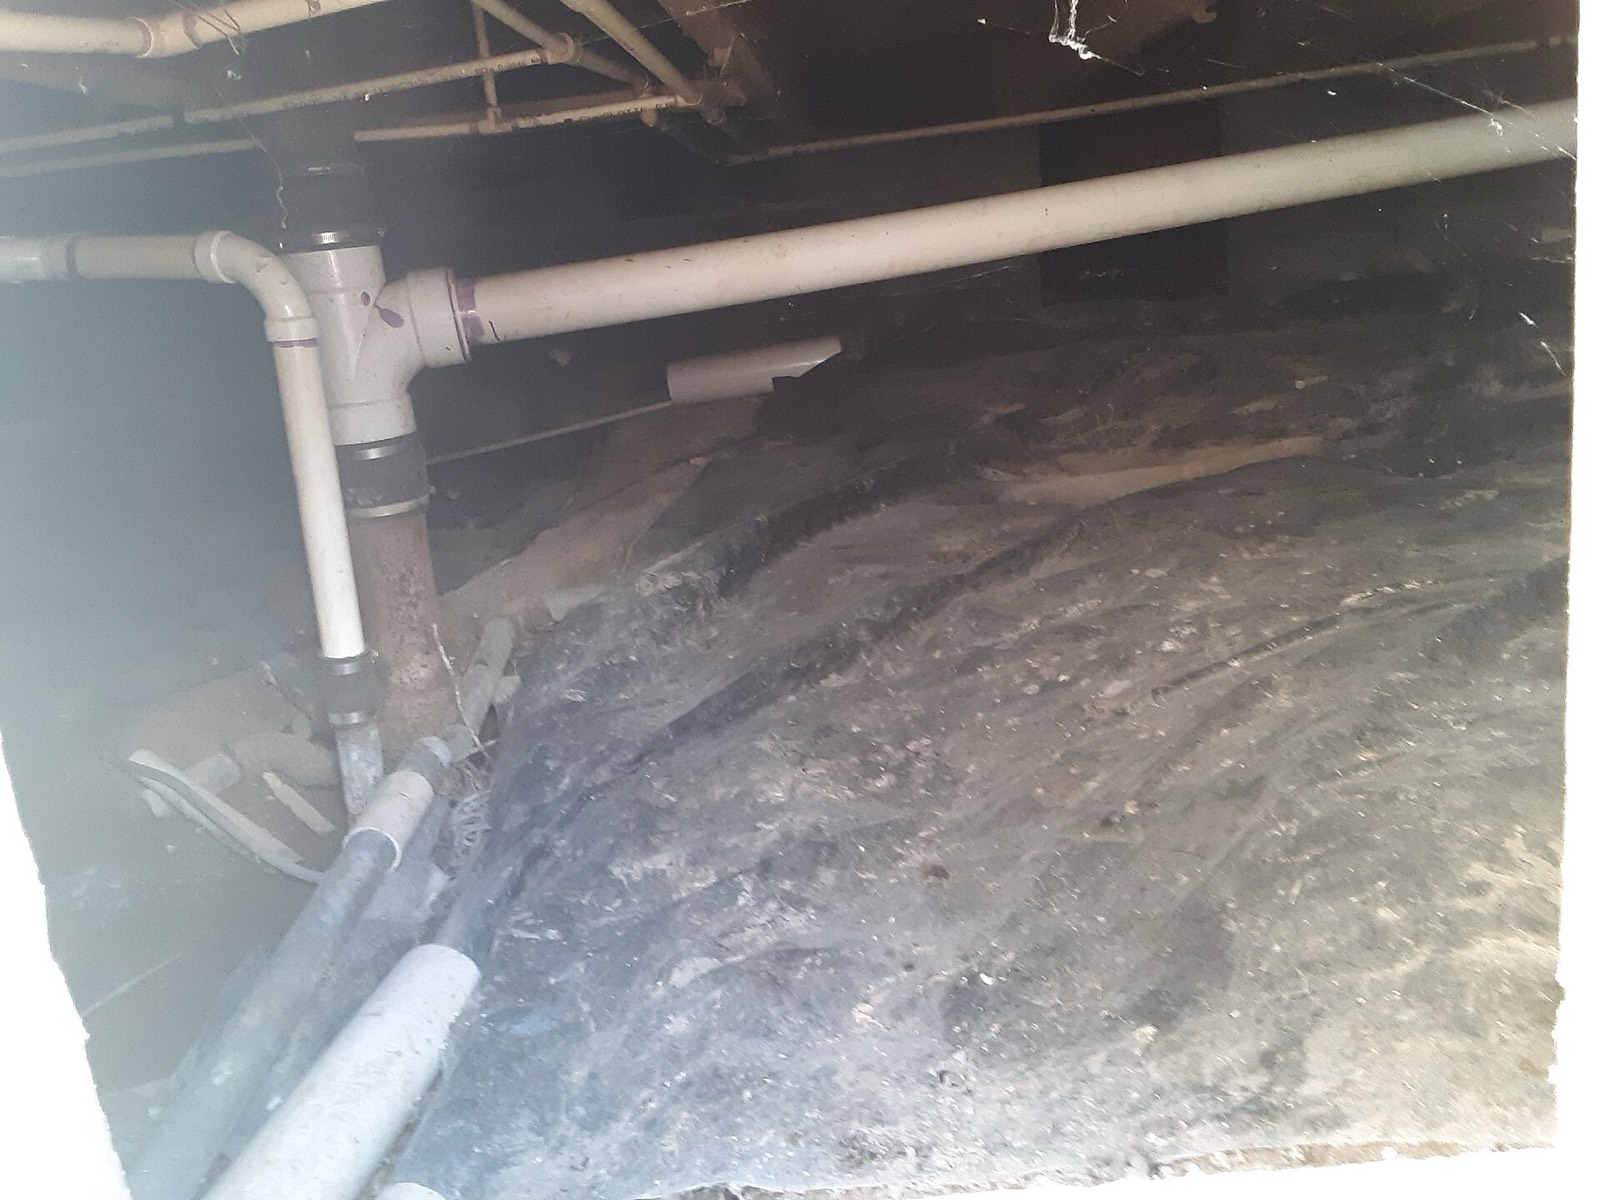
Where it turns up under a warm house“Crawl spaces where relative humidity (RH) is high are common sites of hidden mold growth, particularly if the crawl space has a bare earth floor. The soil will wick moisture, through capillary action, from moist to dry areas. The relative warmth of the crawl space will dry the soil by evaporation, adding this moisture to the air in the crawl space where it can cause mold to grow.”
US EPA, Mold Course, Chapter 2, quoted verbatim.
How long a wet thing has“Buildings and building furnishings will often get wet. They must be dried or "allowed to dry" quickly (within 24-48 hours) in order to avoid mold growth. In general, increasing air circulation and temperature will increase the speed of drying.”
US EPA, Mold Course, Chapter 2, quoted verbatim.
On indoor humidity“Keep indoor humidity low. If possible, keep indoor humidity below 60 percent (ideally between 30 and 50 percent) relative humidity. Relative humidity can be measured with a moisture or humidity meter, a small, inexpensive ($10-$50) instrument available at many hardware stores.”
US EPA, A Brief Guide to Mold, Moisture and Your Home, quoted verbatim.
On condensation“If you see condensation or moisture collecting on windows, walls or pipes act quickly to dry the wet surface and reduce the moisture/water source. Condensation can be a sign of high humidity.”
US EPA, A Brief Guide to Mold, Moisture and Your Home, quoted verbatim.
On “black mold” and “toxic mold”
This is the most searched claim in the subject, and EPA has answered it directly.
“Molds come in many colors including white. "Black mold" is not a species or specific kind of mold, and neither is "toxic mold." Sometimes the news media use the terms "toxic mold" and "black mold" to refer to molds that may produce mycotoxins or for a specific mold, Stachybotrys chartarum. Molds that produce mycotoxins are often referred to as toxigenic fungi.”
US EPA, Mold Course, Chapter 1, quoted verbatim.
“No one can tell whether a mold is producing mycotoxins just by looking at it.”
US EPA, Mold Course, Chapter 1, quoted verbatim.
On testing, and on who does a cleanup
“Is sampling for mold needed? In most cases, if visible mold growth is present, sampling is unnecessary. Since no EPA or other federal limits have been set for mold or mold spores, sampling cannot be used to check a building’s compliance with federal mold standards.”
US EPA, A Brief Guide to Mold, Moisture and Your Home, quoted verbatim.
“Who should do the cleanup depends on a number of factors. One consideration is the size of the mold problem. If the moldy area is less than about 10 square feet (less than roughly a 3 ft. by 3 ft. patch), in most cases, you can handle the job yourself, follow the guidelines.”
US EPA, A Brief Guide to Mold, Moisture and Your Home, quoted verbatim.
“If there has been a lot of water damage, and/or mold growth covers more than 10 square feet, consult EPA’s Mold Remediation in Schools and Commercial Buildings. Although focused on schools and commercial buildings, this document is applicable to other building types.”
US EPA, A Brief Guide to Mold, Moisture and Your Home, quoted verbatim.
EPA’s wording is more careful than the version of it that circulates. It does not say to hire someone above ten square feet; it says the smaller job is usually a homeowner job, and it routes the larger one to a second EPA document.
“If you have health concerns, consult a health professional before starting cleanup.”
US EPA, A Brief Guide to Mold, Moisture and Your Home, quoted verbatim.
“Please note that this document presents recommendations. EPA does not regulate mold or mold spores in indoor air”
US EPA, A Brief Guide to Mold, Moisture and Your Home, quoted verbatim.
EPA’s own prevention lists
EPA’s prevention lists, reproduced with attribution. Remediation is a licensed trade covered by EPA’s cleanup guidance above; the lists below are about keeping moisture out of a building in the first place.
- When water leaks or spills occur indoors - act quickly. If wet or damp materials or areas are dried 24-48 hours after a leak or spill happens, in most cases mold will not grow.
- Clean and repair roof gutters regularly.
- Make sure the ground slopes away from the building foundation, so that water does not enter or collect around the foundation.
- Keep air conditioning drip pans clean and the drain lines unobstructed and flowing properly.
- Vent appliances that produce moisture, such as clothes dryers, stoves, and kerosene heaters to the outside where possible. (Combustion appliances such as stoves and kerosene heaters produce water vapor and will increase the humidity unless vented to the outside.)
- Use air conditioners and/or de-humidifiers when needed.
- Run the bathroom fan or open the window when showering. Use exhaust fans or open windows whenever cooking, running the dishwasher or dishwashing, etc.
- Reduce the humidity (see preceding page)
- Increase ventilation or air movement by opening doors and/or windows, when practical. Use fans as needed.
- Cover cold surfaces, such as cold water pipes, with insulation.
- Increase air temperature.
Where the health question goes
“This [guidance] provides a brief overview; it does not describe all potential health effects related to mold exposure. For more detailed information consult a health professional. You may also wish to consult your state or local health department.”
US EPA, A Brief Guide to Mold, Moisture and Your Home, quoted verbatim.
Health guidance on this page is EPA’s, quoted. For the health side of this subject the sources are EPA’s mold pages, CDC’s mold pages, your state or local health department, and your own clinician.
The method
The data. NOAA NCEI’s 1991-2020 U.S. Climate Normals, hourly product: an official normal dew point and temperature for every hour of a normal year at each station, plus NOAA’s published 90th percentile dew point. Public domain, no key, no registration, read as a committed snapshot because normals move once a decade.
What is ours. The monthly means, the state averages, and the “warmed to 70F indoors” column. Stations are weighted equally, so a state figure is the average of the named cities below and nothing more. Stations that publish dew point for only part of the day are excluded, because a daytime-only record would tilt every monthly mean on this page.
What outdoor dew point measures. Outdoor dew point is a proxy for the moisture load a building has to fight, not a measurement of the air inside your house or of mold. Grading, gutters, foundation drainage, insulation, air sealing, the ventilation you have, whether the air conditioning runs, and whether anything is leaking will each move the indoor outcome further than the difference between two neighbouring states on this map. The climate sets the difficulty. The building decides the result.
A climatology, not a forecast. It says what July is usually like in New Jersey; the week ahead is a question for the weather forecast.
The stations behind New Jersey
- Newark (Newark Liberty Intl AP)
- Atlantic City (Atlantic City Intl AP)
- Millville (Millville Muni AP)
| Reference city | NOAA station | Warmest dew point month | Coldest month | Annual mean dew point |
|---|---|---|---|---|
| Newark | Newark Liberty Intl AP | Jul, 63.3°F | Jan, 32.4°F | 41.8°F |
| Atlantic City | Atlantic City Intl AP | Jul, 65.7°F | Jan, 33.3°F | 44.5°F |
| Millville | Millville Muni AP | Jul, 65.8°F | Jan, 33.4°F | 44.3°F |
Source: NOAA NCEI U.S. Climate Normals (1991-2020), read through the NCEI Access Data Service. Rebuilt by scripts/fetch-mold-dewpoint-normals.mjs when NOAA publishes the next normals period.
Further reading
Two mechanisms on this page are documented best by a land-grant extension service whose material is copyrighted, so each is described here in our own words and linked.
- University of Minnesota Extension explains that opening basement windows for fresh air on a warm humid day can make a basement wetter rather than drier, because outdoor air at a high dew point condenses on the cool wall and floor, and that homeowners often mistake the result for a leak. Read it at University of Minnesota Extension.
- University of Minnesota Extension covers the cold-climate side of the same physics: how much moisture a heated house can carry without condensing depends on how cold it is outside, which is why the indoor humidity that is fine in October is not fine in January. Read it at University of Minnesota Extension.
New Jersey mold season FAQ
Mold season in other states
Monthly figures computed from NOAA NCEI 1991-2020 U.S. Climate Normals, hourly product (public domain), for the named New Jersey stations, and refreshed when NOAA publishes a new normals period. Dew point band names and cut points are the National Weather Service’s, quoted verbatim. Everything on this page about mold itself is quoted from EPA with a link. Outdoor dew point is a proxy for the moisture load on a building, not a measurement of indoor conditions and not a measurement of mold. Anything on this page about health is EPA’s, quoted and linked.
Hero image: “Indoor Mold” by Alexander Davronov, CC BY-SA 4.0