
Fresno Air Quality: The Seasonal Shape
Which months are worst in Fresno, the mechanism behind them, and what five years of EPA monitoring actually shows.
Worst stretch in the EPA record: July through SeptemberFresno air quality at a glance
EPA record, 2020 to 2024Computed from EPA's daily AQI record for the Fresno, CA metro area, 2020 to 2024. The metro AQI for a day is the highest reading among its monitors, so this is the calendar as the whole metro experiences it.
Which months are worst for air quality in Fresno
Five years of EPA's official record for the Fresno, CA metro, 2020 to 2024, folded into one year: each bar splits the month's days into EPA's six categories, in EPA's exact colors, and beneath it sits the pollutant that most often set the index. Read the pollutant row and you can watch the mechanism change season: ozone is summer chemistry, winter PM2.5 is trapped air, late summer PM2.5 is usually smoke.
The three worst months, ranked
September
43.3% of monitored days reached Unhealthy for Sensitive Groups or worse, and 91% at least Moderate. The index was most often set by ozone. Worst single day: AQI 346 on September 13, 2020.
August
41.3% of monitored days reached Unhealthy for Sensitive Groups or worse, and 97% at least Moderate. The index was most often set by ozone. Worst single day: AQI 254 on August 21, 2020.
July
38.7% of monitored days reached Unhealthy for Sensitive Groups or worse, and 97% at least Moderate. The index was most often set by ozone. Worst single day: AQI 169 on July 11, 2024.
Why Fresno air goes bad when it does
The San Joaquin Valley is the hardest place in America to keep air clean: a deep bowl walled by the Sierra and Coast Ranges, with agriculture, trucking and heat inside it. Fresno gets winter PM2.5 under persistent inversions, long summer ozone, and smoke on top in fire years.
Air quality alerts covering Fresno right now
Active National Weather Service air quality products for California, reproduced exactly as issued. NWS relays Air Quality Alerts on behalf of the state and local air agencies; the dust, smoke and stagnation advisories are its own. Zones are larger than the metro, so confirm the listed areas include yours.
Checking api.weather.gov for active air quality alert products…
Today's AQI is at AirNow
AirNow.gov publishes EPA's official live reading and forecast for Fresno, and during smoke events its Fire and Smoke Map adds monitor-by-monitor detail. This page carries the calendar above: which months do this every year, and why.
The AQI scale, in EPA's words
| AQI | Category | What it means |
|---|---|---|
| 0 to 50 | Good | Air quality is satisfactory, and air pollution poses little or no risk. |
| 51 to 100 | Moderate | Air quality is acceptable. However, there may be a risk for some people, particularly those who are unusually sensitive to air pollution. |
| 101 to 150 | Unhealthy for Sensitive Groups | Members of sensitive groups may experience health effects. The general public is less likely to be affected. |
| 151 to 200 | Unhealthy | Some members of the general public may experience health effects; members of sensitive groups may experience more serious health effects. |
| 201 to 300 | Very Unhealthy | Health alert: The risk of health effects is increased for everyone. |
| 301 and higher | Hazardous | Health warning of emergency conditions: everyone is more likely to be affected. |
Category names, index ranges and colors are reproduced exactly from the US EPA, Technical Assistance Document for the Reporting of Daily Air Quality (EPA-454/B-24-002, May 2024), Tables 1 and 2. Meanings quoted from AirNow.gov, AQI Basics.
Who EPA means by sensitive groups
| When this pollutant has an AQI above 100 | EPA lists these sensitive groups |
|---|---|
| Ozone | People with lung disease, such as asthma; children, including teenagers; people who are active outdoors; and older adults. |
| Fine particle pollution (PM2.5) and particle pollution (PM10) | People with heart or lung disease; older adults; and children, including teenagers. In addition, some minority groups, people with lower incomes, and outdoor workers may experience higher exposure that can worsen underlying health conditions. |
| Carbon monoxide (CO) | People with heart disease. |
| Nitrogen dioxide (NO2) | People with lung disease, such as asthma; children, including teenagers; and older adults. |
| Sulfur dioxide (SO2) | People with asthma; children, including teenagers; and older adults. |
What EPA says sensitive groups should do on an orange day
Sensitive groups: Make outdoor activities shorter and less intense. Take more breaks. Watch for symptoms such as coughing or shortness of breath. Plan outdoor activities in the morning when ozone is lower. People with asthma: Follow your asthma action plan and keep quick-relief medicine handy.
EPA cautionary statement for Ozone (8-hour), Unhealthy for Sensitive Groups, quoted from the US EPA, Technical Assistance Document for the Reporting of Daily Air Quality (EPA-454/B-24-002, May 2024), Table 5.
Sensitive groups: Make outdoor activities shorter and less intense. It's OK to be active outdoors but take more breaks. Watch for symptoms such as coughing or shortness of breath. People with asthma: Follow your asthma action plan and keep quick relief medicine handy. People with heart disease: Symptoms such as palpitations, shortness of breath, or unusual fatigue may indicate a serious problem. If you have any of these, contact your health care provider.
EPA cautionary statement for PM2.5 (24-hour), Unhealthy for Sensitive Groups, quoted from the US EPA, Technical Assistance Document for the Reporting of Daily Air Quality (EPA-454/B-24-002, May 2024), Table 5.
Everything above is EPA’s language, quoted. On any day that matters, the decision belongs with the official product for your location and your own clinician.
Fresno air quality FAQ
Air quality calendars for other metros
Monthly figures computed from EPA Air Quality System daily AQI files for the Fresno, CA CBSA (public domain regulatory data), 2020 to 2024, refreshed annually. Alerts read live from api.weather.gov and reproduced as issued. Today's measured reading is on EPA's AirNow. Statewide picture: California air quality seasons
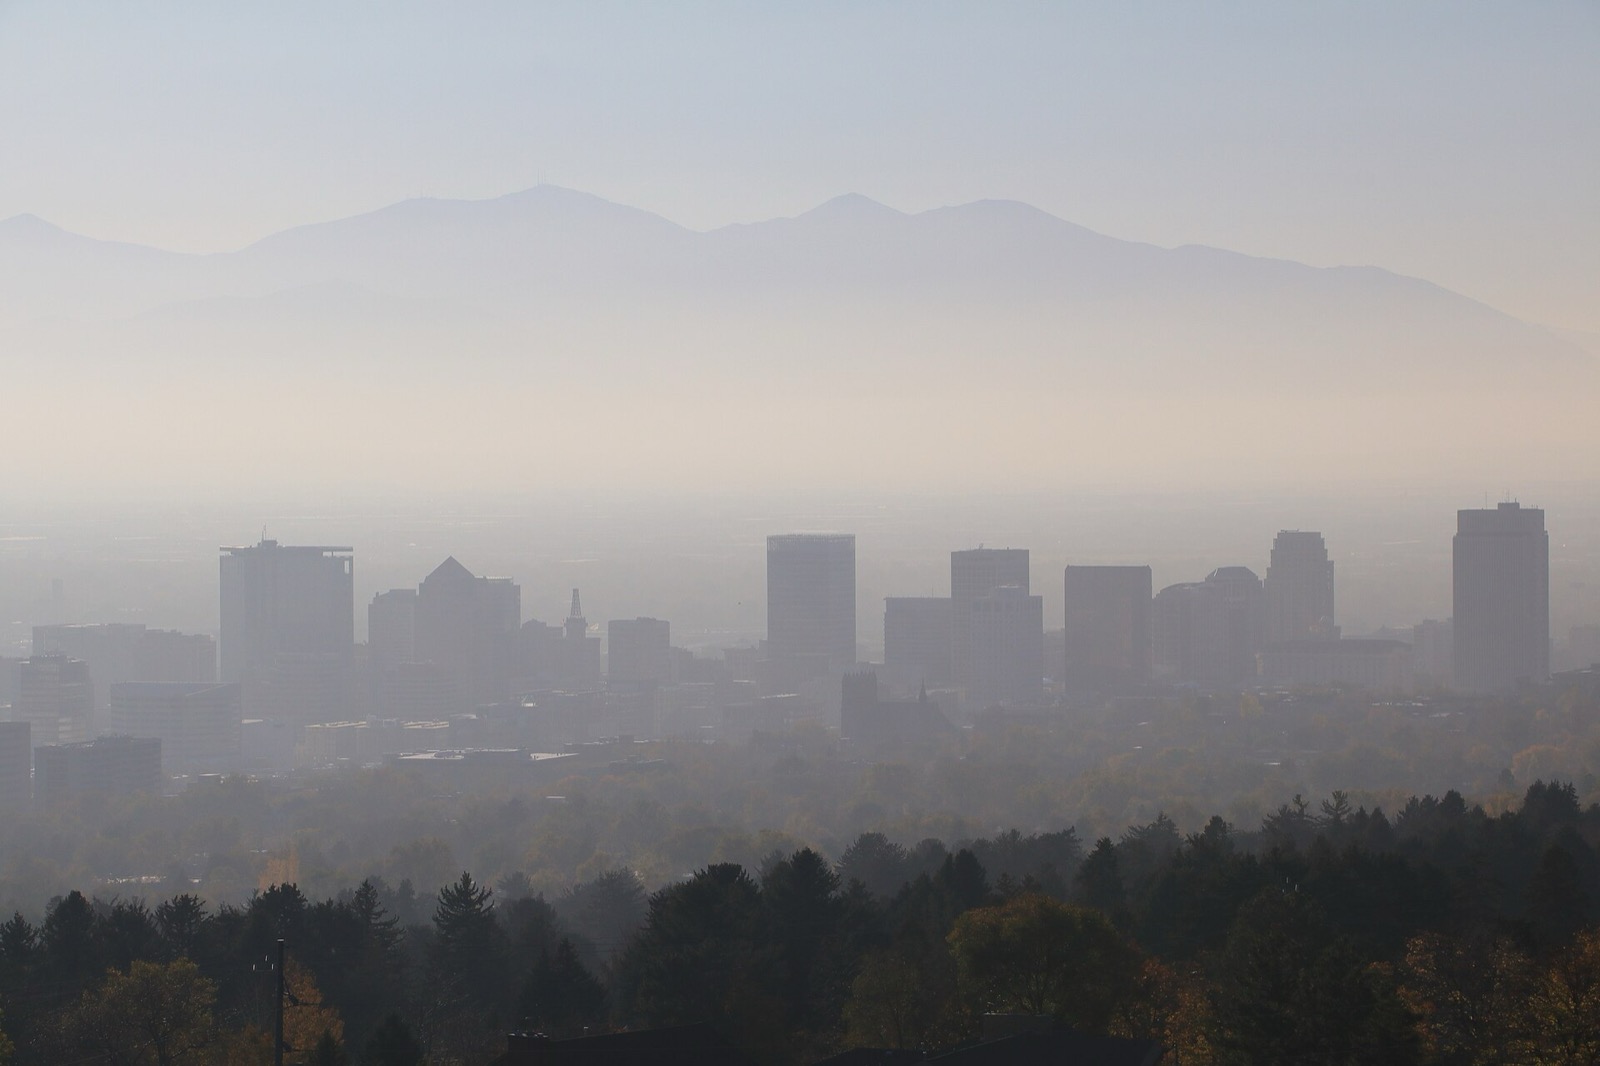
Hero image: “Salt Lake City smog haze skyline 01” by Eltiempo10, CC BY-SA 4.0