
Hawaii Hurricane Season
Central Pacific season dates and every tropical cyclone NOAA has tracked near the islands, from the agency record.
Hurricane season is open right now: it runs June 1 to November 30. For anything live, use the National Hurricane Center, not this page.Is there a storm near Hawaii right now? Go to the National Hurricane Center.
The panel just below republishes the National Hurricane Center’s own latest advisories and outlook, verbatim and timestamped. Tracks, cones and forecasts are the National Hurricane Center’s. If a storm is active or approaching, NHC is the source of official forecasts and warnings, and your emergency management agency is the source of evacuation and shelter decisions.
- National Hurricane Center for current storms, forecasts, watches, and warnings
- Your state emergency management agency for evacuation orders and shelter information
- Ready.gov hurricane preparedness for how to prepare, in FEMA’s own words
“It only takes one hurricane (or tropical storm) to cause a disaster.” NOAA Climate Prediction Center
What NHC is saying right now
Republished verbatim from the National Hurricane Center via the National Weather Service API, with NHC’s own issuance times. For anything that matters, read it at nhc.noaa.gov where it is always current.
Loading the latest NHC products…
Hawaii hurricane season at a glance
Climatology and history, never a forecastHawaii sits alone in the central Pacific, a small target in a big ocean, monitored by the Central Pacific Hurricane Center rather than Miami. Direct hits are rare and near-misses are the usual story, but Iniki's 1992 passage over Kauai shows what a direct hit means here.
When is hurricane season in Hawaii?
The season dates are set by NOAA, they are the same for the whole central Pacific, and they are worth quoting rather than paraphrasing:
“NOAA's outlook for the 2026 hurricane season, which runs June 1 to November 30, predicts a 70% chance of an above-normal season, a 20% chance of a near-normal season, and a 10% chance of a below-normal season.”NOAA / NWS Honolulu (Central Pacific Hurricane Center), source
“Moderate to strong El Nino years are correlated with increased tropical cyclone activity in the Central Pacific and the occurrence of late season storms.”National Hurricane Center, Central Pacific climatology, source
Those are basin-wide dates. What they mean for Hawaii specifically is in the month histogram below: the calendar of storms that have actually arrived here, which is narrower than the season and different for every state.
The season dates are also not walls. CPHC notes that reliable central Pacific climatologies begin with continuous satellite coverage in 1971, and El Nino years are correlated with late season storms.
NOAA’s outlook for the 2026 season
NOAA Central Pacific Hurricane Center / NWS Honolulu, issued May 2026. Snapshot taken 2026-08-27; always current at the source.
“Forecasters with NOAA's National Weather Service are predicting an above-normal hurricane season for the central Pacific basin this year.”
- 5 to 13 tropical cyclones in the central Pacific
“NOAA's outlook is for overall seasonal activity based on large-scale weather and climate patterns. It does not indicate where or when any storms may affect land, as that is determined by short-term and variable weather patterns, and is not a landfall forecast.” NOAA Central Pacific Hurricane Center / NWS Honolulu
Which months hurricanes actually come close in Hawaii
This histogram counts tropical cyclones passing within 75 statute miles of the main Hawaiian Islands since 1949, derived from NOAA's HURDAT2 best-track file. The 75-mile radius mirrors the chart CPHC itself publishes. Distances are measured at NOAA's recorded track points, so a fast moving storm's true closest approach can be nearer than the points show.
August accounts for 6 of the 12 events in the record here.
Every tropical cyclone NOAA has tracked near Hawaii
The table lists every system at tropical storm strength or greater that passed within 75 statute miles of the main islands in NOAA’s best track record, 1949 to 2025. The standout is Iniki, and the agency’s own words carry it:
“INIKI was to be the costliest and most powerful hurricane to strike the Hawaiian Islands. The hurricane did close to $3 billion dollars worth of damage as its eye passed directly over the island of Kauai and was one of the costliest storms in the history of the United States.”Central Pacific Hurricane Center, 1992 seasonal tropical cyclone report, source
| Year | Month | Name | Closest recorded point | Strength at that point | Winds |
|---|---|---|---|---|---|
| 2024 | August | Hone | 49 miles | Hurricane | 75 kt |
| 2020 | July | Douglas | 36 miles | Hurricane | 75 kt |
| 2018 | September | Olivia | 22 miles | Tropical storm | 40 kt |
| 2016 | July | Darby | 33 miles | Tropical storm | 35 kt |
| 2014 | August | Iselle | 27 miles | Tropical storm | 50 kt |
| 1992 | September | Iniki | 34 miles | Hurricane | 115 kt |
| 1989 | July | Dalilia | 61 miles | Tropical storm | 55 kt |
| 1983 | August | Gil | 35 miles | Tropical storm | 40 kt |
| 1972 | August | Diana | 61 miles | Tropical storm | 60 kt |
| 1959 | August | Dot | 6 miles | Hurricane | 75 kt |
| 1958 | August | Unnamed | 24 miles | Tropical storm | 45 kt |
| 1957 | July | Kanoa | 54 miles | Hurricane | 75 kt |
How complete is this record?
“Continuous satellite coverage has been available in the Central Pacific since 1971 so many climatologies start with that date.”National Hurricane Center, Central Pacific climatology, source

What the categories mean
NHC’s definitions, in its own words: a tropical storm has maximum sustained winds of 39 to 73 mph, a hurricane 74 mph or higher, and a major hurricane 111 mph or higher, corresponding to Category 3, 4 or 5 on the Saffir-Simpson Hurricane Wind Scale. Category measures wind only: water, historically the deadlier hazard, is not in the number, which is one more reason a history page must never stand in for the National Hurricane Center during a real storm.
Hawaii hurricane season FAQ
More for the Hawaii coast
Hurricane season by state
Hurricane season by month
Strike counts and categories are reproduced from NOAA AOML’s continental US hurricane landfall list (Revised in March 2026 to add in the 2025 season) and NOAA HURDAT2. Season dates and peak are NHC’s, quoted. These are historical records and season climatology. For a live forecast or watch: nhc.noaa.gov.
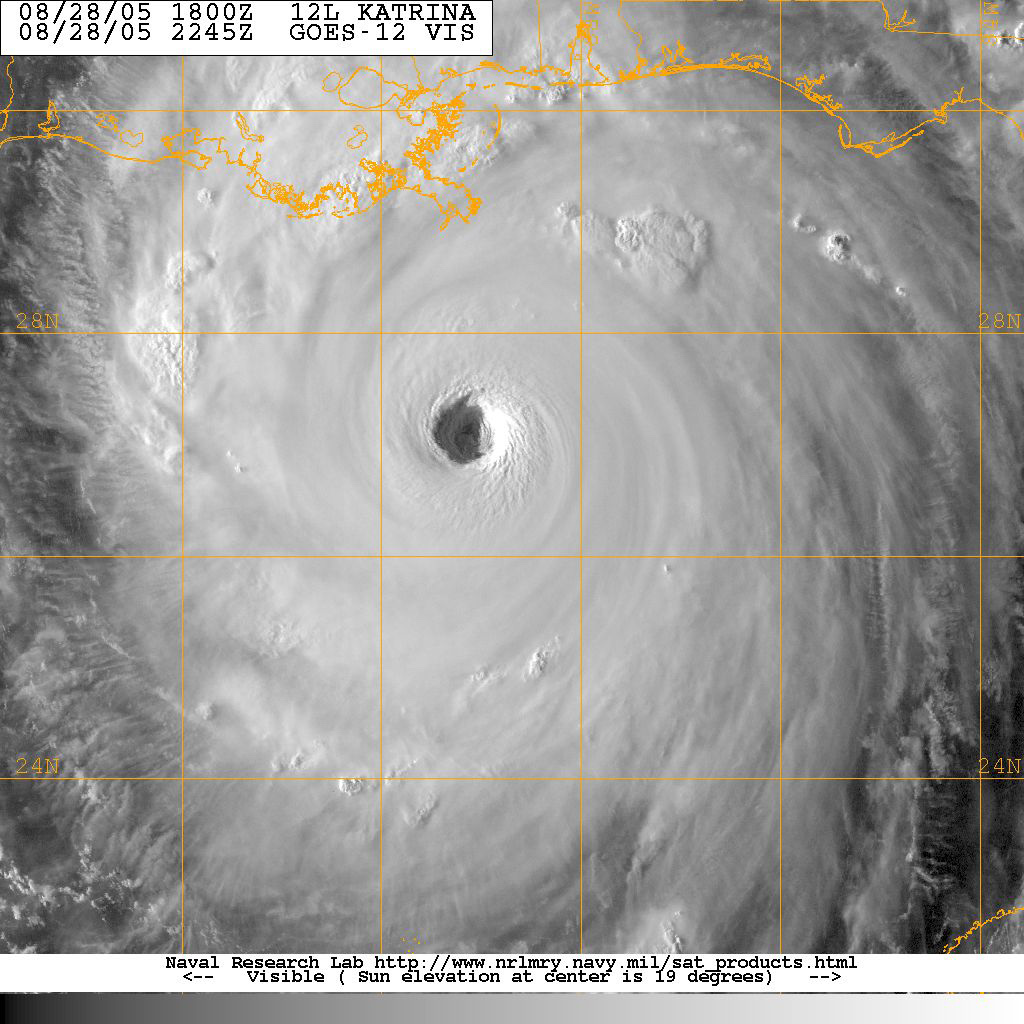
Hero image: “Katrina 2005-08-28 2245Z” — U.S. Navy / Naval Research Laboratory — Public domain