
Texas Hurricane Season
Season dates, the months storms have actually arrived, and every strike NOAA has recorded, from the agency record.
Hurricane season is open right now: it runs June 1 to November 30. For anything live, use the National Hurricane Center, not this page.Is there a storm near Texas right now? Go to the National Hurricane Center.
The panel just below republishes the National Hurricane Center’s own latest advisories and outlook, verbatim and timestamped. Tracks, cones and forecasts are the National Hurricane Center’s. If a storm is active or approaching, NHC is the source of official forecasts and warnings, and your emergency management agency is the source of evacuation and shelter decisions.
- National Hurricane Center for current storms, forecasts, watches, and warnings
- Your state emergency management agency for evacuation orders and shelter information
- Ready.gov hurricane preparedness for how to prepare, in FEMA’s own words
“It only takes one hurricane (or tropical storm) to cause a disaster.” NOAA Climate Prediction Center
What NHC is saying right now
Republished verbatim from the National Hurricane Center via the National Weather Service API, with NHC’s own issuance times. For anything that matters, read it at nhc.noaa.gov where it is always current.
Loading the latest NHC products…
Texas hurricane season at a glance
Climatology and history, never a forecastThe Texas coast runs roughly 370 miles from the Mexican border to the Sabine River, and NOAA's landfall list splits it into south, central, and north stretches because a storm that comes ashore at Brownsville and one at Beaumont are different events. Galveston 1900 opens the modern era of the record here.
When is hurricane season in Texas?
The season dates are set by NOAA, they are the same for the whole Atlantic basin, and they are worth quoting rather than paraphrasing:
“The Atlantic hurricane season runs from June 1 to November 30.”National Hurricane Center, source
“The peak of the Atlantic hurricane season is September 10, with most activity occurring between mid-August and mid-October.”National Hurricane Center, source
Those are basin-wide dates. What they mean for Texas specifically is in the month histogram below: the calendar of storms that have actually arrived here, which is narrower than the season and different for every state.
The season dates are also not walls. NHC is explicit that storms sometimes form outside the official window; the off season page counts exactly how often. See the December to May record.
NOAA’s outlook for the 2026 season
NOAA Climate Prediction Center, issued 6 August 2026. Snapshot taken 2026-08-27; always current at the source.
“NOAA's updated outlook for the 2026 Atlantic Hurricane Season indicates that a below-normal season is the most likely outcome, with low chances for a near-normal season, and a very small chance that the season would be above-normal.”
- 7 to 13 named storms
- 2 to 6 hurricanes
- 0 to 2 major hurricanes
“NOAA does not make seasonal hurricane landfall predictions. Hurricane landfalls are largely determined by the weather patterns in place as the hurricane approaches, and those patterns are usually only predictable when the storm is within several days of making landfall.” NOAA Climate Prediction Center
Which months hurricanes actually hit in Texas
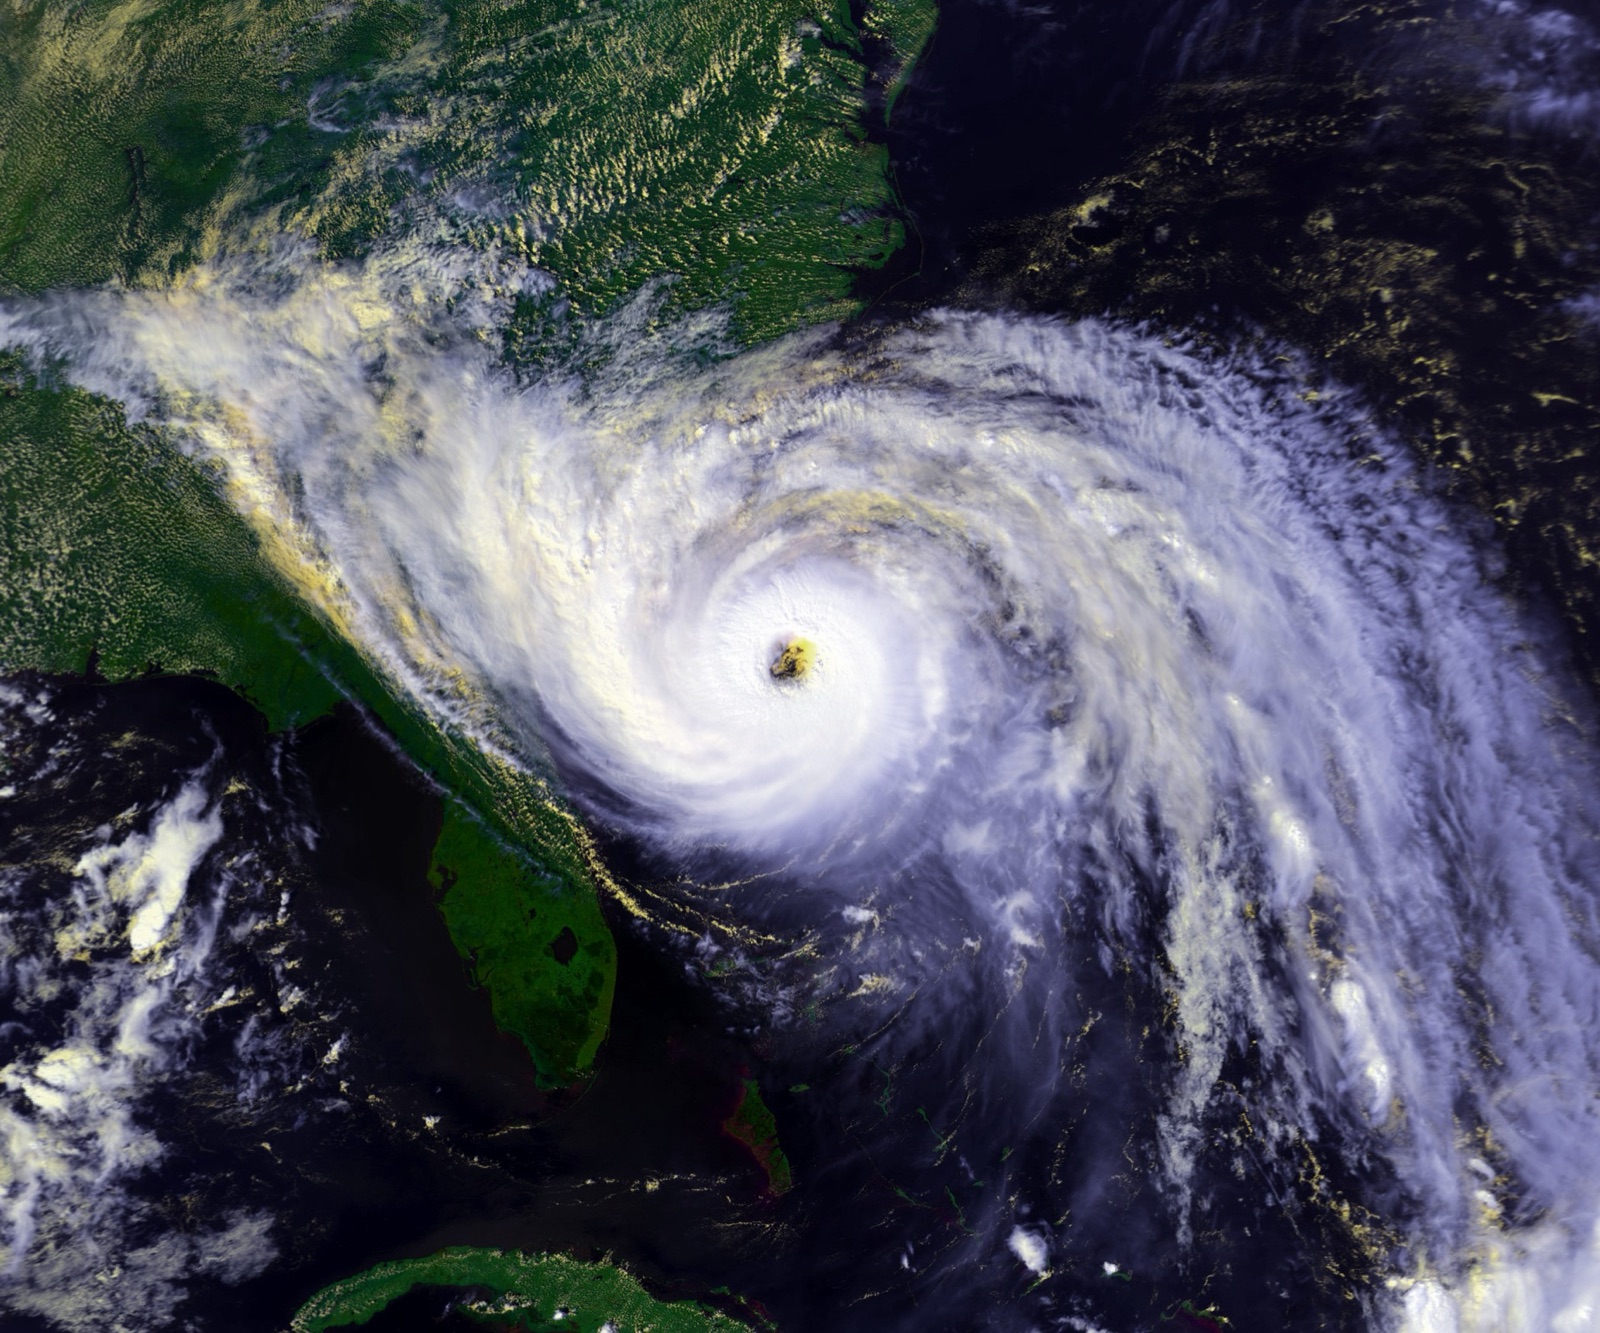
This histogram counts the hurricane strikes NOAA's landfall list attributes to Texas, by month, across the whole 1851 to 2025 record. It is a record of what happened, not a forecast of any year.
August accounts for 22 of the 67 events in the record here. A month with zero strikes is not a month with zero risk: the basin-wide season runs June through November everywhere, and the routing block at the top of this page applies in all of them.
Every hurricane strike NOAA has recorded on Texas
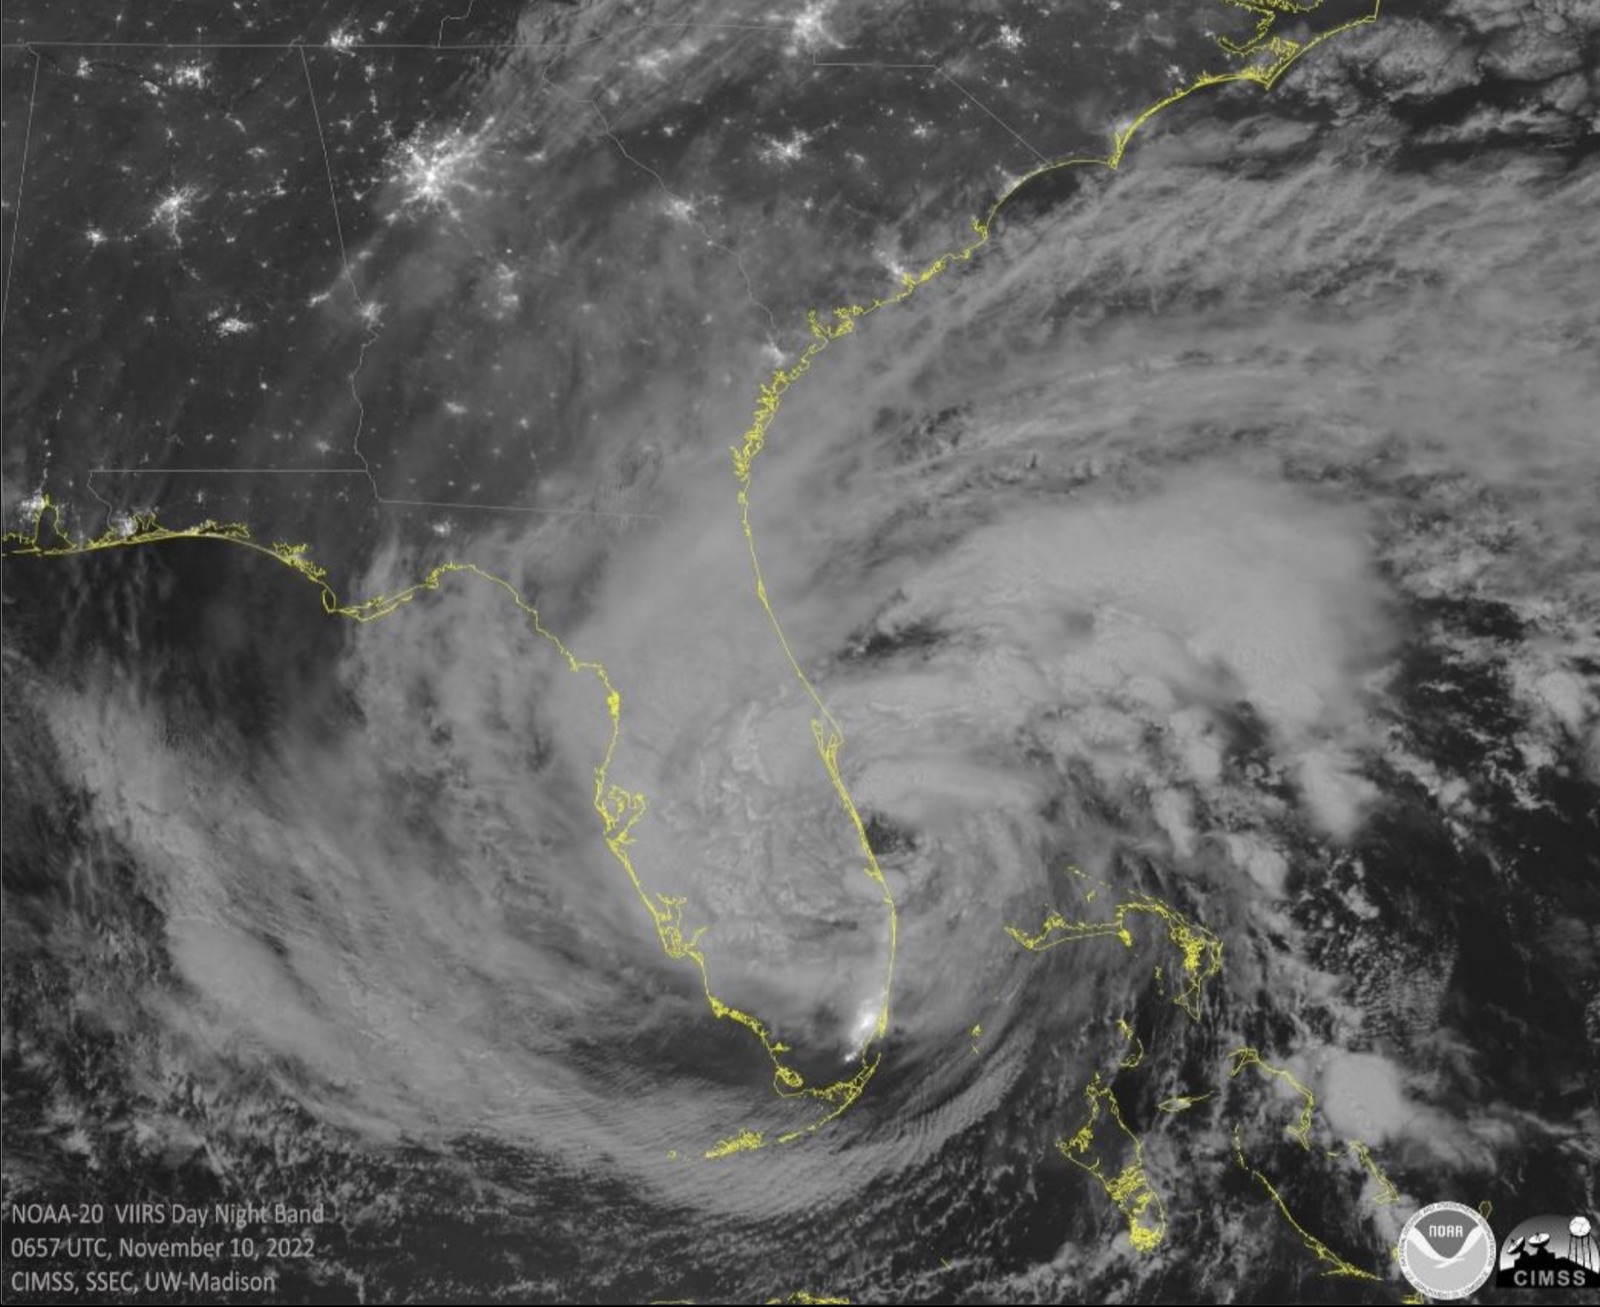
Reproduced from NOAA AOML’s continental US hurricane landfall list, with NOAA’s own per-state category attribution. “Category in Texas” is the Saffir-Simpson category NOAA assigns for this state specifically, which is often lower than the storm’s landfall category elsewhere. NOAA splits this state into coastal zones; the strongest zone category is shown.
| Year | Month | Name | Category in Texas | Highest US category | Pressure | Max wind |
|---|---|---|---|---|---|---|
| 2024 | Jul | Beryl | Category 1 | Cat 1 | 978 mb | 80 kt |
| 2024 | Jul | Beryl | Category 1 | Cat 1 | 978 mb | 80 kt |
| 2021 | Sep | Nicholas | Category 1 | Cat 1 | 991 mb | 65 kt |
| 2020 | Jul | Hanna | Category 1 | Cat 1 | 973 mb | 80 kt |
| 2020 | Aug | Laura | Category 1 | Cat 4 | 939 mb | 130 kt |
| 2017 | Aug | Harvey | Category 4 | Cat 4 | 937 mb | 115 kt |
| 2008 | Jul | Dolly | Category 1 | Cat 1 | 967 mb | 75 kt |
| 2008 | Sep | Ike | Category 2 | Cat 2 | 950 mb | 95 kt |
| 2007 | Sep | Humberto | Category 1 | Cat 1 | 985 mb | 80 kt |
| 2005 | Sep | Rita | Category 2 | Cat 3 | 937 mb | 100 kt |
| 2003 | Jul | Claudette | Category 1 | Cat 1 | 979 mb | 80 kt |
| 1999 | Aug | Bret | Category 3 | Cat 3 | 951 mb | 100 kt |
| 1989 | Aug | Chantal | Category 1 | Cat 1 | 986 mb | 70 kt |
| 1989 | Oct | Jerry | Category 1 | Cat 1 | 983 mb | 75 kt |
| 1986 | Jun | Bonnie | Category 1 | Cat 1 | 990 mb | 75 kt |
| 1983 | Aug | Alicia | Category 3 | Cat 3 | 962 mb | 100 kt |
| 1980 | Aug | Allen | Category 3 | Cat 3 | 945 mb | 100 kt |
| 1971 | Sep | Fern | Category 1 | Cat 1 | 979 mb | n/a |
| 1970 | Aug | Celia | Category 4 | Cat 4 | 944 mb | 120 kt |
| 1967 | Sep | Beulah # | Category 3 | Cat 3 | 940 mb | 100 kt |
| 1961 | Sep | Carla | Category 4 | Cat 4 | 931 mb | 125 kt |
| 1959 | Jul | Debra | Category 1 | Cat 1 | 980 mb | 75 kt |
| 1957 | Jun | Audrey | Category 2 | Cat 3 | 946 mb | 110 kt |
| 1949 | Oct | Unnamed | Category 2 | Cat 2 | 965 mb | 95 kt |
| 1947 | Aug | Unnamed | Category 1 | Cat 1 | 984 mb | 70 kt |
| 1945 | Aug | Unnamed | Category 2 | Cat 3 | 963 mb | 100 kt |
| 1943 | Jul | Unnamed | Category 2 | Cat 2 | 967 mb | 90 kt |
| 1942 | Aug | Unnamed | Category 1 | Cat 1 | 992 mb | 65 kt |
| 1942 | Aug | Unnamed | Category 3 | Cat 3 | 950 mb | 100 kt |
| 1941 | Sep | Unnamed | Category 3 | Cat 3 | 942 mb | 110 kt |
| 1940 | Aug | Unnamed | Category 2 | Cat 2 | 972 mb | 85 kt |
| 1936 | Jun | Unnamed | Category 1 | Cat 1 | 987 mb | 70 kt |
| 1934 | Jul | Unnamed | Category 1 | Cat 1 | 979 mb | 75 kt |
| 1933 | Sep | Unnamed | Category 3 | Cat 3 | 940 mb | 110 kt |
| 1932 | Aug | Freeport | Category 4 | Cat 4 | 935 mb | 130 kt |
| 1929 | Jun | Unnamed | Category 1 | Cat 1 | 982 mb | 80 kt |
| 1921 | Jun | Unnamed | Category 1 | Cat 1 | 980 mb | 80 kt |
| 1919 | Sep | Unnamed | Category 3 | Cat 4 | 927 mb | 130 kt |
| 1918 | Aug | Unnamed | Category 1 | Cat 3 | 955 mb | 105 kt |
| 1916 | Aug | Unnamed | Category 4 | Cat 4 | 932 mb | 115 kt |
| 1915 | Aug | Galveston | Category 4 | Cat 4 | 940 mb | 115 kt |
| 1913 | Jun | Unnamed | Category 1 | Cat 1 | 986 mb | 65 kt |
| 1912 | Oct | Unnamed | Category 2 | Cat 2 | 970 mb | 85 kt |
| 1910 | Sep | Unnamed | Category 2 | Cat 2 | 965 mb | 90 kt |
| 1909 | Jun | Unnamed | Category 2 | Cat 2 | 972 mb | 85 kt |
| 1909 | Jul | Velasco | Category 3 | Cat 3 | 959 mb | 100 kt |
| 1909 | Aug | Unnamed # | Category 1 | Cat 1 | 955 mb | 65 kt |
| 1900 | Sep | Galveston | Category 4 | Cat 4 | 936 mb | 120 kt |
| 1897 | Sep | Unnamed | Category 1 | Cat 1 | 978 mb | 75 kt |
| 1895 | Aug | Unnamed # | Category 1 | Cat 1 | 963 mb | 65 kt |
| 1891 | Jul | Unnamed | Category 1 | Cat 1 | 974 mb | 80 kt |
| 1888 | Jun | Unnamed | Category 1 | Cat 1 | 982 mb | 70 kt |
| 1887 | Sep | Unnamed | Category 1 | Cat 1 | 973 mb | 75 kt |
| 1886 | Jun | Unnamed | Category 2 | Cat 2 | 970 mb | 85 kt |
| 1886 | Aug | Indianola | Category 4 | Cat 4 | 925 mb | 130 kt |
| 1886 | Sep | Unnamed # | Category 1 | Cat 1 | 973 mb | 80 kt |
| 1886 | Oct | Unnamed | Category 2 | Cat 3 | 950 mb | 105 kt |
| 1880 | Aug | Unnamed # | Category 3 | Cat 3 | 931 mb | 110 kt |
| 1879 | Aug | Unnamed | Category 2 | Cat 2 | 964 mb | 90 kt |
| 1875 | Sep | Unnamed | Category 3 | Cat 3 | 955 mb | 100 kt |
| 1869 | Aug | Lower Texas Coast | Category 2 | Cat 2 | 965 mb | 90 kt |
| 1867 | Oct | Galveston | Category 1 | Cat 2 | 965 mb | 90 kt |
| 1866 | Jul | Unnamed | Category 2 | Cat 2 | 965 mb | 90 kt |
| 1865 | Sep | Sabine River | Category 1 | Cat 2 | 965 mb | 90 kt |
| 1854 | Jun | Unnamed | Category 1 | Cat 1 | 982 mb | 70 kt |
| 1854 | Sep | Matagorda | Category 2 | Cat 2 | 965 mb | 90 kt |
| 1851 | Jun | Unnamed | Category 1 | Cat 1 | 974 mb | 80 kt |
# landfall in Mexico with hurricane-force winds in Texas. Flags and wording are NOAA AOML’s own. “(inland)” marks AOML’s I-prefix entries: hurricane conditions reaching a state whose coast the center did not strike.
How complete is this record?
“Because of the sparseness of towns and cities before 1900 in some coastal locations along the United States, the above list is not complete for all states. Before the Gulf of Mexico and Atlantic coasts became settled, hurricanes may have been underestimated in their intensity or missed completely for small-sized systems (i.e., 2004's Hurricane Charley).”NOAA Atlantic Oceanographic and Meteorological Laboratory, Hurricane Research Division, source
NOAA AOML estimates reliable records begin around 1880 for south Texas and 1860 for north Texas; earlier decades are likely incomplete.

What the categories mean, and how they land in Texas
NHC’s definitions, in its own words: a tropical storm has maximum sustained winds of 39 to 73 mph, a hurricane 74 mph or higher, and a major hurricane 111 mph or higher, corresponding to Category 3, 4 or 5 on the Saffir-Simpson Hurricane Wind Scale. Category measures wind only: water, historically the deadlier hazard, is not in the number, which is one more reason a history page must never stand in for the National Hurricane Center during a real storm.
Hurricane strikes on Texas by NOAA-attributed category in this state, 1851 to 2025.
Texas hurricane season FAQ
More for the Texas coast
Hurricane season by state
Hurricane season by month
Strike counts and categories are reproduced from NOAA AOML’s continental US hurricane landfall list (Revised in March 2026 to add in the 2025 season) and NOAA HURDAT2. Season dates and peak are NHC’s, quoted. These are historical records and season climatology. For a live forecast or watch: nhc.noaa.gov.
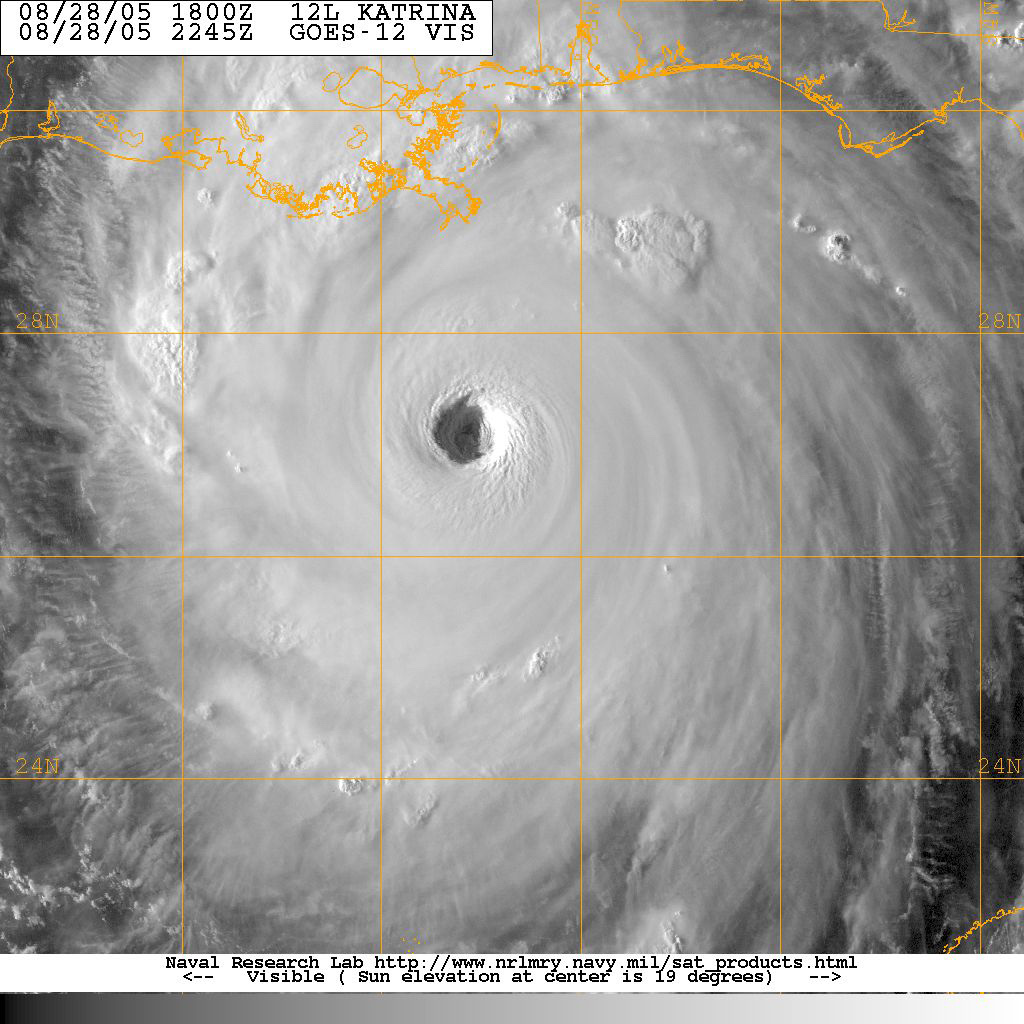
Hero image: “Katrina 2005-08-28 2245Z” — U.S. Navy / Naval Research Laboratory — Public domain