

Skip to content
Tilted early for March to May, near normal on the water

Pennsylvania Spring Forecast 2027

Which way spring 2027 leans in Pennsylvania, what the last freeze normally does at 157 weather stations, how wide the window is between leaf-out and the end of freeze season, and a live reading for your own ZIP.

Tilted early
Spring 2027 timing
90 of 100 on the outlook and the pattern
Near normal
Spring water
49 of 100 on the outlook, the pack and the deficit
April 29
Median last freeze
statewide median across 157 stations
31 days
Leaf-out to last freeze
two to five weeks exposed
Your own place

How spring is running where you are in Pennsylvania

A statewide number is a starting point, not an answer: Pennsylvania runs 55 days from one end of its freeze normals to the other. Enter a ZIP for the forecast lows from the National Weather Service, the last 30 days measured against the same days in recent years, and the soil temperature at the depth the planting guides use.

Pennsylvania

Pennsylvania normals, from the NOAA 1991 to 2020 Climate Normals
How it is runningEnter a ZIPthe last 30 days against the same days in recent years
Freeze in the forecastEnter a ZIPnothing at or below 32 F in the gridded forecast
The groundEnter a ZIPsoil temperature at 6 cm, the depth the planting guides use
Median last freezeApril 29the statewide median across 157 stations

Enter a ZIP code above for the live reading: the forecast lows, the last 30 days against recent years, and the soil temperature.

The outlook

Will spring 2027 be early or late in Pennsylvania?

The outlook leans warm through spring here. Nothing in the outlook pushes this spring wet or dry.

Timing

How Pennsylvania leans

Tilted early 90 of 100

The outlook leans warm through spring here.

  • March to May temperature outlook+16.4 of 26CPC tilts the spring season warm here, at 50 percent odds.
  • February to April temperature outlook+10.1 of 16The early window tilts warm, at 50 percent odds.
  • ENSO state through spring+14 of 14CPC has an El Nino advisory in effect and favors it through spring, and its documented spring tendency here runs warm.
Water

What spring brings Pennsylvania

Near normal 49 of 100

Nothing in the outlook pushes this spring wet or dry.

  • March to May precipitation outlook0 of 30CPC gives this state equal chances of a wet, near normal or dry spring.
  • Drought already on the ground-0.9 of 145 percent of the state was in moderate drought or worse on the Drought Monitor map behind this reading.

What the Climate Prediction Center put over Pennsylvania

March to May 2027 temperaturewarm at 50 percent
February to April 2027 temperaturewarm at 50 percent
March to May 2027 precipitationEqual chances, on the edge of the tilt
February to April 2027 precipitationEqual chances, on the edge of the tilt

Read off the Climate Prediction Center’s own outlook polygons for Pennsylvania, issued October 15, 2026. The outer 33% contour is the boundary of the shaded area, where the odds sit close to even and only the direction is on the map. On the edge of the tilt means the state straddles two probability bands, so one part of it carries the higher number.

A seasonal outlook is a probability, never a promise. NOAA’s Climate Prediction Center issued the March to May 2027 outlook on October 15, 2026 and shifts the odds between three categories, warmer than normal, near normal and cooler than normal, measured against 1991 to 2020. Equal chances means the outlook has no usable signal there.

Advertisement
The window

How risky an early warm spell is in Pennsylvania

A warm spell in March costs nothing by itself. It costs something when it pulls buds and blossom out ahead of the last freeze, because once a plant has broken dormancy the same 28 F night it shrugged off in February takes the crop. The two dates below are both normals, and the distance between them is the exposure.

Mar 29normal first leaf31 daysApr 29median last freeze

Two to five weeks exposed. Plants normally leaf out well before freeze season ends.

In Pennsylvania the USA National Phenology Network’s Spring Leaf Index normally fires on March 29, and the freeze normals put the coin flip at April 29, with a 1 in 10 chance of a freeze still ahead on May 17. That gap is how long plants are normally out while a freeze is still on the table: 31 days to the coin flip, 49 to the 1 in 10 date. Both ends are published normals for 1991 to 2020. Neither is a forecast.

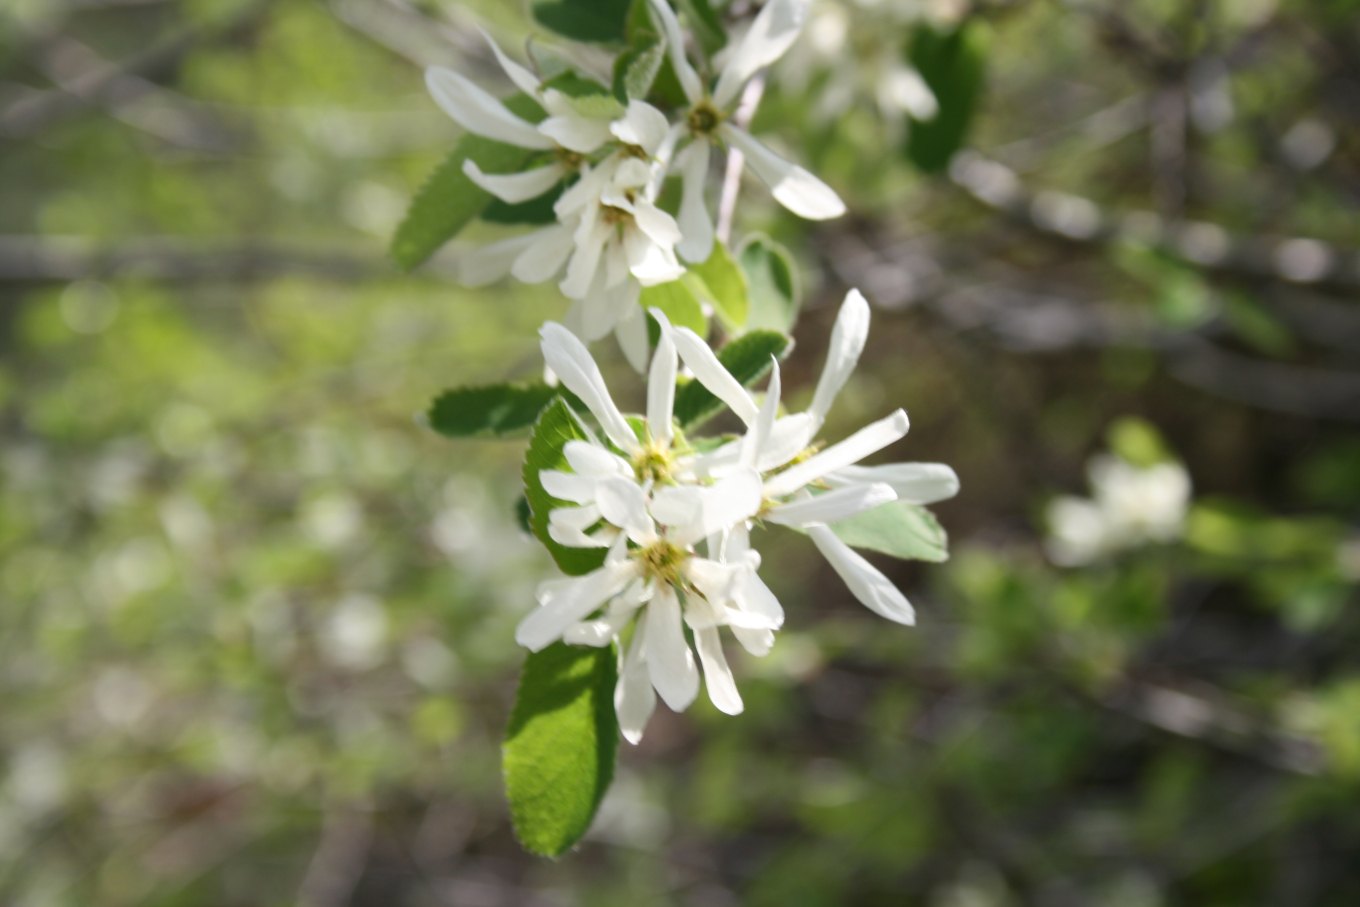
White serviceberry flowers open on a bare branch
Serviceberry opens early, ahead of its own leaves, which is what makes the shrub a calendar. The Spring Leaf Index tracks the same accumulated warmth that sets it off, and so does the clock on anything in the garden.Amelanchier-ovalis-flower, Sten Porse, CC BY-SA 3.0
The last freeze

When the last frost normally ends in Pennsylvania

Every date here is a 1991 to 2020 normal, which means it is what the station did over 30 years and not what it will do in 2027. The 1 in 10 column is the one a tender crop plants against.

The date a 32 F freeze has a 10, 50 and 90 percent chance of still being ahead, from the NOAA 1991 to 2020 Climate Normals.
StationElevation1 in 10 later thanMedian1 in 10 earlier than
Phila Franklin Inst, Philadelphia60 ftApr 12Mar 30Mar 15
Pittsburgh Allegheny County Airport, Pittsburgh1,248 ftMay 6Apr 18Apr 2
Altoona Blair County Airport1,480 ftMay 11Apr 23Apr 8
Selinsgrove Penn Vly Airport444 ftMay 12Apr 27Apr 13
Bradford 4SW Rsch 5, Bradford1,660 ftMay 31May 18Apr 30

Read the median as the coin flip and the 1 in 10 column as the one to plant against. Across all 157 Pennsylvania stations in the normals the median runs from Mar 30 at Marcus Hook to May 24 at Kane 1NNE, 1,750 feet up, a spread of 55 days inside one state.

Frost on a grass meadow at sunrise, with low sun behind bare hedgerow trees
A clear calm night after a warm week is the one that does the damage. Radiational frost settles into low ground, so a reading taken at the airport can sit several degrees above the hollow a garden is in.Dülmen, Kirchspiel, Dernekamp, Sonnenaufgang -- 2023 -- 6308-12, Dietmar Rabich, CC BY-SA 4.0
What spring does here

Spring hazards in Pennsylvania

  • A warm spell, then a freeze

    Leaf-out normally happens around March 29 in Pennsylvania, and a freeze still has an even chance of coming after it until about April 29. That is 31 days of plants being out while a freeze is still on the table, which is what makes an early warm spell here expensive rather than welcome.

  • Spring arrives at different times inside the state

    Across 157 NOAA stations in Pennsylvania, Marcus Hook normally sees its last freeze by March 30 while Kane 1NNE at 1,750 feet normally waits until May 24. That is 55 days between two ends of the same state.

Drought figures are the United States Drought Monitor map for August 25, 2026. Flood and snowmelt outlooks for Pennsylvania are issued by the National Weather Service office in Philadelphia/Mt Holly.

Planting

When planting starts in Pennsylvania

Cool-season crops are the first ones to plant in the garden year. This can be anytime from several weeks to a couple of months before the last frost date.

Counting from Pennsylvania’s statewide median last freeze of April 29, cool season seed goes in while the soil is at 50 F and warm season transplants wait for 60 F. The live reading above gives the soil temperature for your own ZIP at the depth the guides use.

Planting dates are Penn State Extension’s. Its yard and garden pages carry the full guides, by crop and by region.

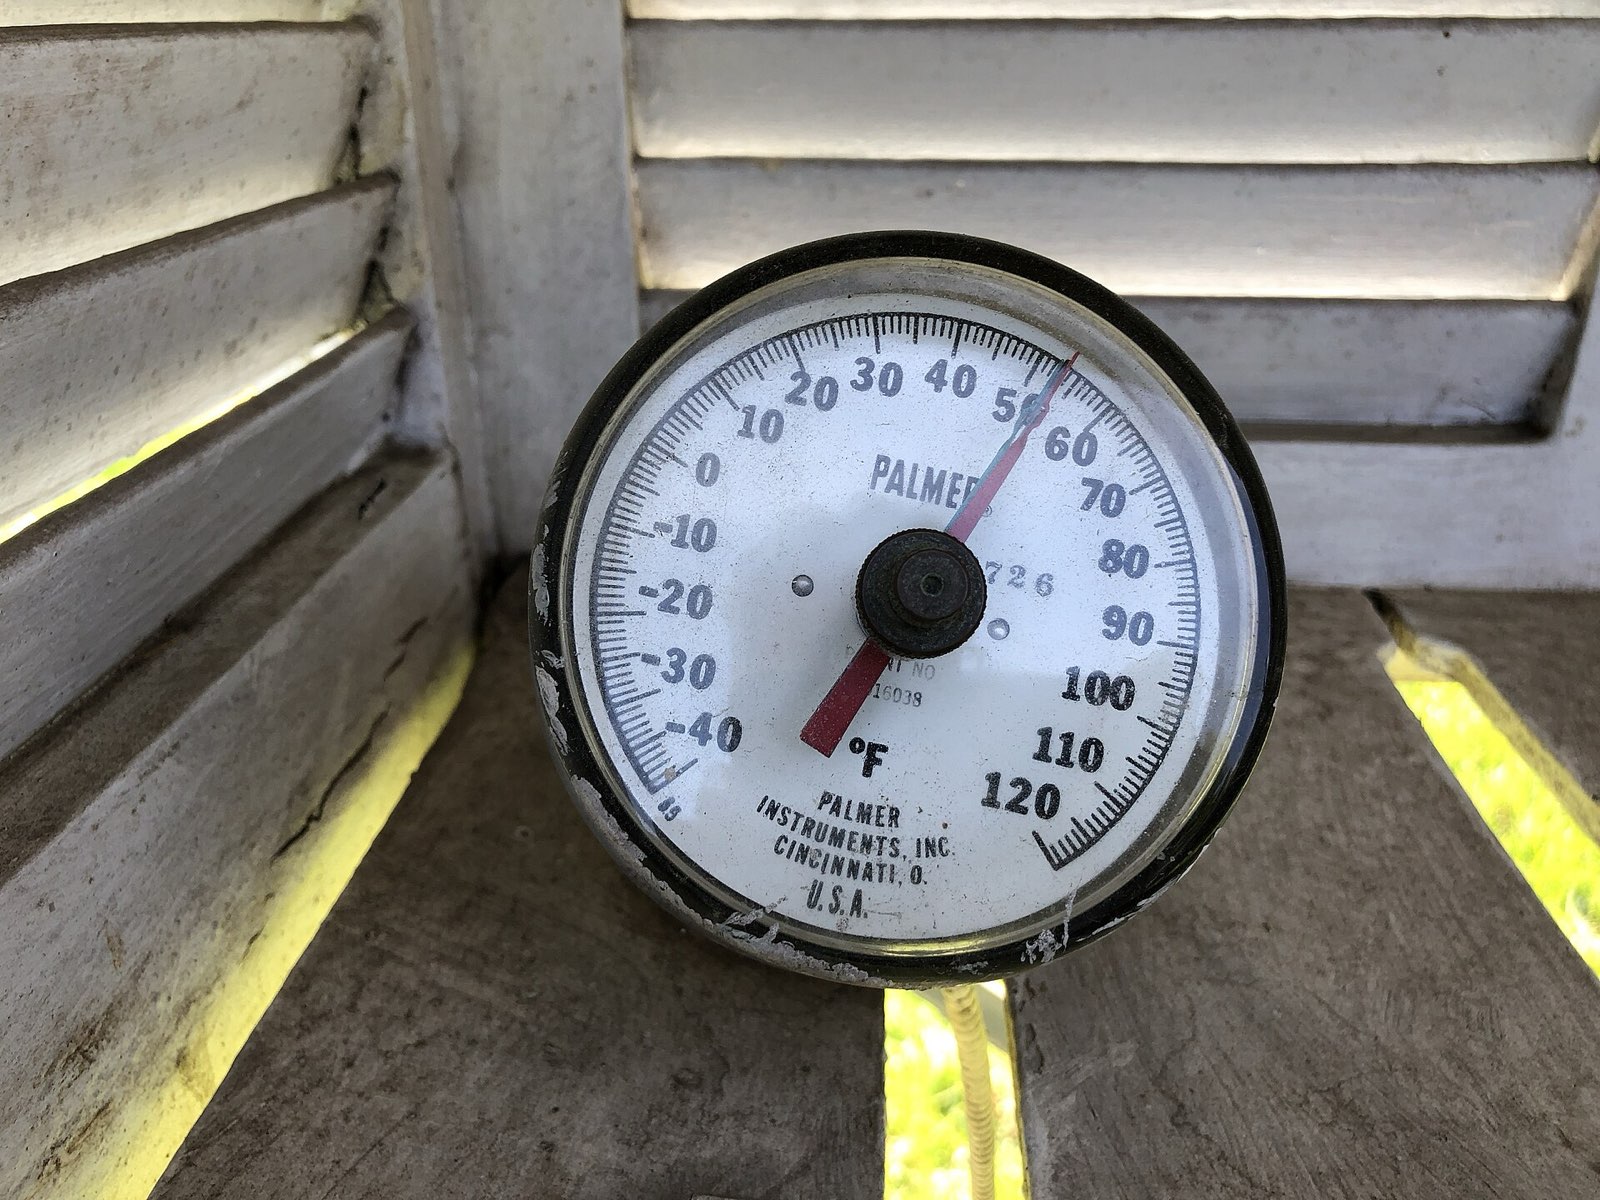
A dial soil thermometer pushed into bare ground at a weather station
The number that decides planting is not the air temperature. Cool season seed germinates with the soil near 50 F and warm season transplants want 60 F, both measured a few inches down and read in the morning.2024-04-26 14 45 08 A Palmer soil thermometer at the weather station at the Rutgers Gardens in North Brunswick Township, Middlesex County, New Jersey, Famartin, CC BY-SA 4.0
The research

What decides how early spring arrives

Four things move the reading at the top of this page. The forecast hub carries all of them with every quote behind them, including the snowpack and the drought.

The March to May temperature outlook

CPC’s official call on the season spring happens in. A warm tilt moves leaf-out and the last freeze earlier; equal chances move nothing.

  • The temperature outlook holds its winter shape into spring, so the March to May map is not a new pattern but the winter one carried forward.

    The evolution of the Temperature Outlooks from Dec-Jan-Feb (DJF) 2026-2027 through MAM 2027 maintain the NDJ forecast pattern in large order and are consistent with strong El Nino events through these seasons with additional attention paid to some of the historically strong events.

  • A white area on the outlook map is not a forecast of normal. It means the three categories are near their climatological odds and the outlook has no usable signal there.

    Equal chances (EC, white areas) are forecast for areas where probabilities for each category of seasonal mean temperatures and accumulated precipitation amounts are forecast to be similar to climatological probabilities.

  • CPC writes these outlooks to be read before the season starts, which is what makes a spring outlook read in autumn the right document and not a stale one.

    These climate outlooks are intended for use prior to the start of their valid period.

The ENSO state

An El Nino advisory is in effect and favored to hold through spring. It is the reason the outlook maps look the way they do, and it tilts odds rather than setting outcomes.

  • CPC has an El Nino advisory in effect and favors the event continuing through spring 2027, which is why the spring outlook looks the way it does.

    The ongoing El Nino event continues to strengthen, and an El Nino advisory remains in effect and is favored to continue through Spring 2027.

  • CPC puts an 80 percent chance on at least a strong El Nino holding through January to March, and favors an El Nino of some strength through March to May 2027.

    The official CPC ENSO Outlook forecasts high probabilities (80%) for at least a strong El Nino event to continue through the Jan-Feb-Mar (JFM) 2027 season and favors an El Nino event of any strength to continue through the Mar-Apr-May (MAM) 2027.

  • The advisory puts the chance of a strong to very strong El Nino through January to March above 83 percent.

    El Niño continues to strengthen, with a strong-to-very strong El Niño likely through January-March 2027 (remaining greater than an 83% chance).

  • A strong event raises the odds of the usual El Nino outcomes without guaranteeing any of them, which is the whole reason a tilt is not a forecast.

    With an event of this magnitude, the chances of experiencing impacts consistent with El Niño are larger, though not guaranteed (see CPC outlooks for probabilities of seasonal anomalies).

  • In an El Nino the storm track sits south of mainland Alaska, which is the mechanism behind the dry tilt there.

    The Pacific Jet is shifted southward and eastward during El Nino events and so the storm track and associated precipitation tends to be located south of most of mainland Alaska.

A pack holding the ground cold

Snow cover keeps the air above it cool and pushes warming later, which is a brake on spring the temperature outlook does not carry on its own.

  • Widespread snow cover keeps the air above it cooler and pushes spring warming later, then makes the melt faster when it comes.

    Also, when snow cover is widespread, it usually keeps air temperatures cooler and delays spring warming, which increases the potential for more rapid snowmelt.

  • A snowpack is water held in place until the thaw, so a spring that starts with a deep pack starts with its runoff already banked.

    Unlike rainfall that can reach the soil almost immediately, the snowpack can store the water for an extended amount of time until temperatures rise above freezing and the snow melts.

The gap between leaf-out and the last freeze

Both ends are published normals for the same 30 years, so the days between them are a climatology of how long plants are normally out while a freeze is still likely.

  • The First Leaf and First Bloom Indices are modeled from recent temperatures, not counted from observed plants, so a date from them is a model output.

    The First Leaf and First Bloom Indices are synthetic measures of these early season events in plants, based on recent temperature conditions.

  • The indices exist to follow spring moving across the country, which is what makes a normal leaf-out date comparable between states.

    These models allow us to track the progression of spring onset across the country.

  • The Late Bloom Index marks the tail of the season, so a state has a modeled start and a modeled end to its spring.

    The Late Bloom Index indicates when plants that bloom at the tail end of the season are flowering, effectively representing the end of the spring season.

  • NCEI describes its normals as a ruler for today and a predictor of the near future, which is exactly the job a last freeze date does.

    Normals act both as a ruler to compare today’s weather and tomorrow’s forecast, and as a predictor of conditions in the near future.

  • The normals come from a uniform 30 year period across almost 15,000 stations, which is why a station a county away can carry a different last freeze date.

    The official normals are calculated for a uniform 30 year period, and consist of annual/seasonal, monthly, daily, and hourly averages and statistics of temperature, precipitation, and other climatological variables from almost 15,000 U.S. weather stations.

  • Every tilt is measured against the 1991 to 2020 period, the same 30 years the frost dates and spring indices on these pages use.

    The Climatic normals are based on conditions between 1991 and 2020, following the World Meterological Organization convention of using the most recent 3 complete decades as the climatic reference period.

Pennsylvania spring 2027 questions

Advertisement

More for Pennsylvania this spring

Spring forecasts in other states

The March to May 2027 outlook was issued by NOAA’s Climate Prediction Center on October 15, 2026 and shifts the odds between three categories. It is a probability, never a promise. Freeze and frost dates come from NOAA NCEI U.S. Climate Normals 1991-2020, annual/seasonal, by station (v1.0.1), a 30 year average rather than a forecast for one year. Live readings come from the National Weather Service forecast for the ZIP you enter, and the Philadelphia/Mt Holly office issues the warnings that govern. Philadelphia is the reference city used in the headline figures on this page.