
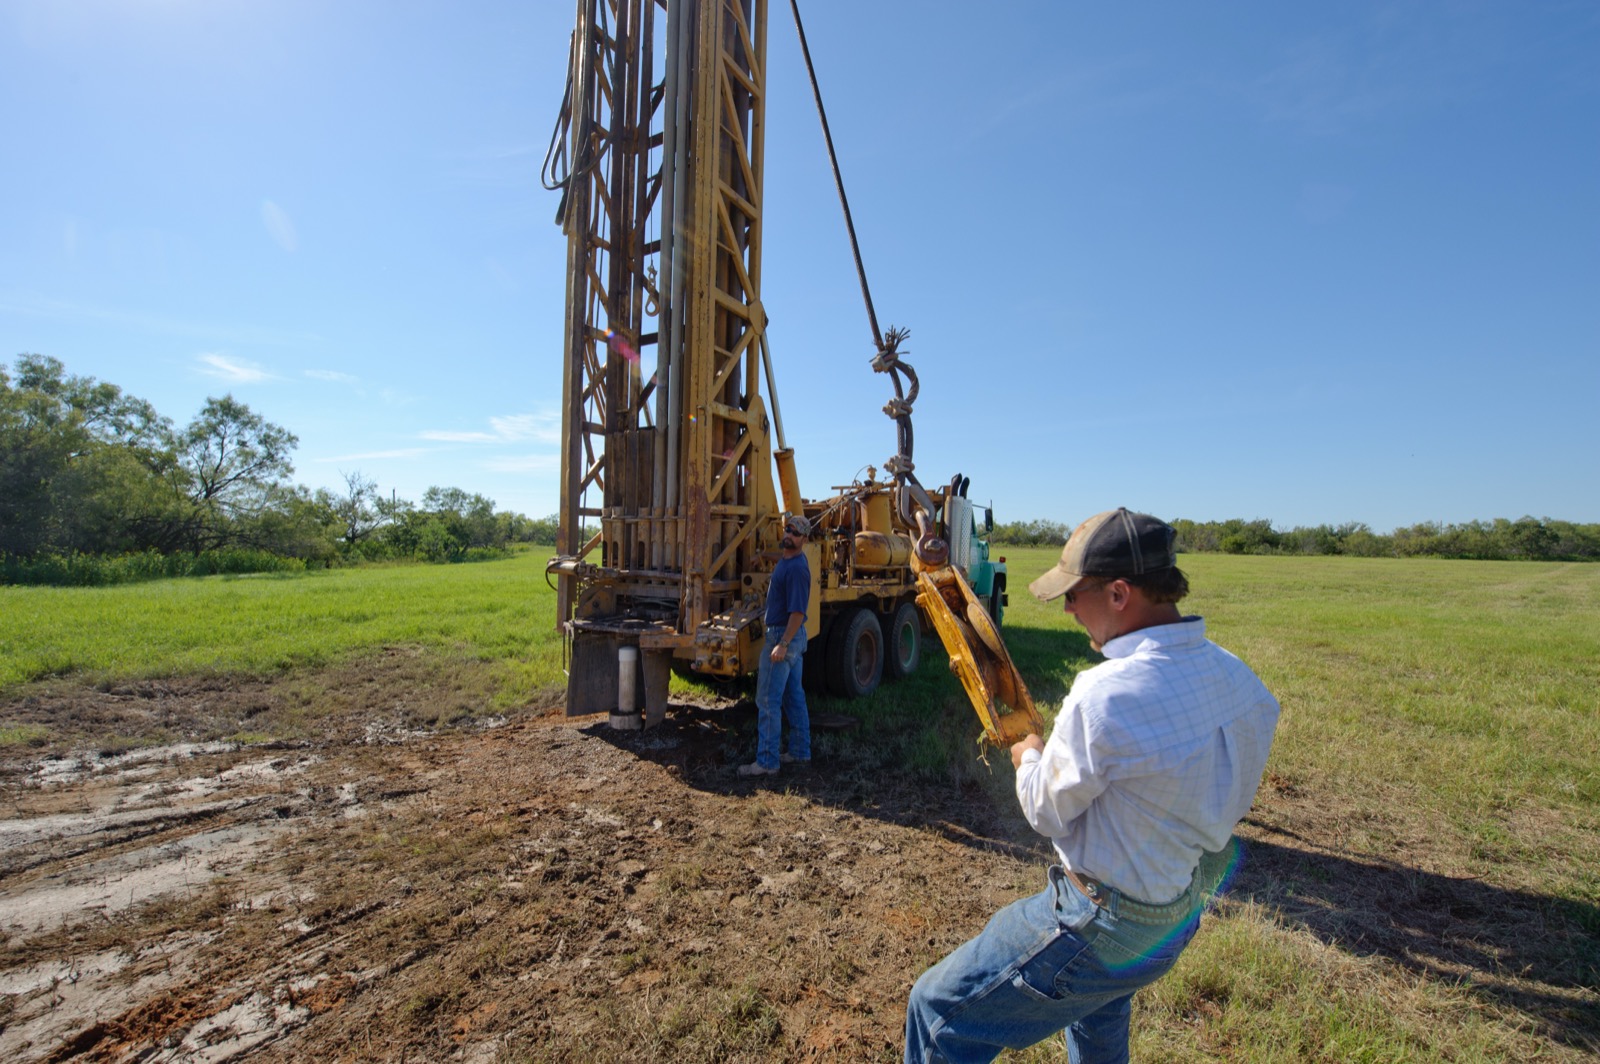
Private Well Water in Tennessee
Most of Tennessee is on a utility that tests its water and mails a report about it. If you are on a well, none of that reaches you. Enter your ZIP below to see which principal aquifers USGS maps under your county, how many neighbours USGS counted on wells, and where the state well program and testing guidance live. Every figure here is USGS's, from 2015, and none of it is a statement about your water.
about 594,000 people in Tennessee are on private wells, 9 percent, outside every drinking water rule there isWhat is under your Tennessee well?
USGS county estimates, 2015Tennessee is a long state and its 594,000 well users change aquifer as you drive it: about 215,000 on the folded Valley and Ridge in the east, about 92,000 on Mississippian limestone through the middle, and about 94,000 on the Mississippi embayment sands out west toward Memphis. Rutherford County southeast of Nashville carries the most at about 42,000. At 9 percent statewide, Tennessee is just under the line this site draws for a utility state.
Nobody is testing Tennessee's private wells
The Safe Drinking Water Act regulates community water systems. It does not regulate your well, and neither, in most respects, does Tennessee. There is no Consumer Confidence Report for a private well, no required sampling schedule, no violation record and no agency that would notice if something changed. EPA says it plainly:
US EPA, Private Drinking Water Wells“The quality and safety of drinking water from private domestic wells are not regulated by the Federal Government under the Safe Drinking Water Act nor by most state governments and laws.”
US EPA, Private Drinking Water Wells“Private well owners are responsible for delivering safe drinking water to their households.”
The two halves of Tennessee's drinking water
On a community water system
- Sampling schedule set by federal rule
- Violations reported to EPA and public
- An annual Consumer Confidence Report by law
- A primacy agency reviewing the results
On a private well, like 594,482 people here
- No required test, ever
- No record anyone can look up
- No report in the mail
- Nobody reviewing anything
This page covers the well side. Tennessee drinking water quality covers the other: what EPA lists for the systems that do report, which stops at the property line of everyone on this page.
By USGS's 2015 count, Tennessee ranks 38 of 50 by the share of its population on self-supplied water and 24 of 50 by the raw number of people. The national share is 13.2 percent. Tennessee is one of 15 states under 10 percent, which makes a well owner here unusually alone: the neighbours, the local news and the county conversation are all about a utility.
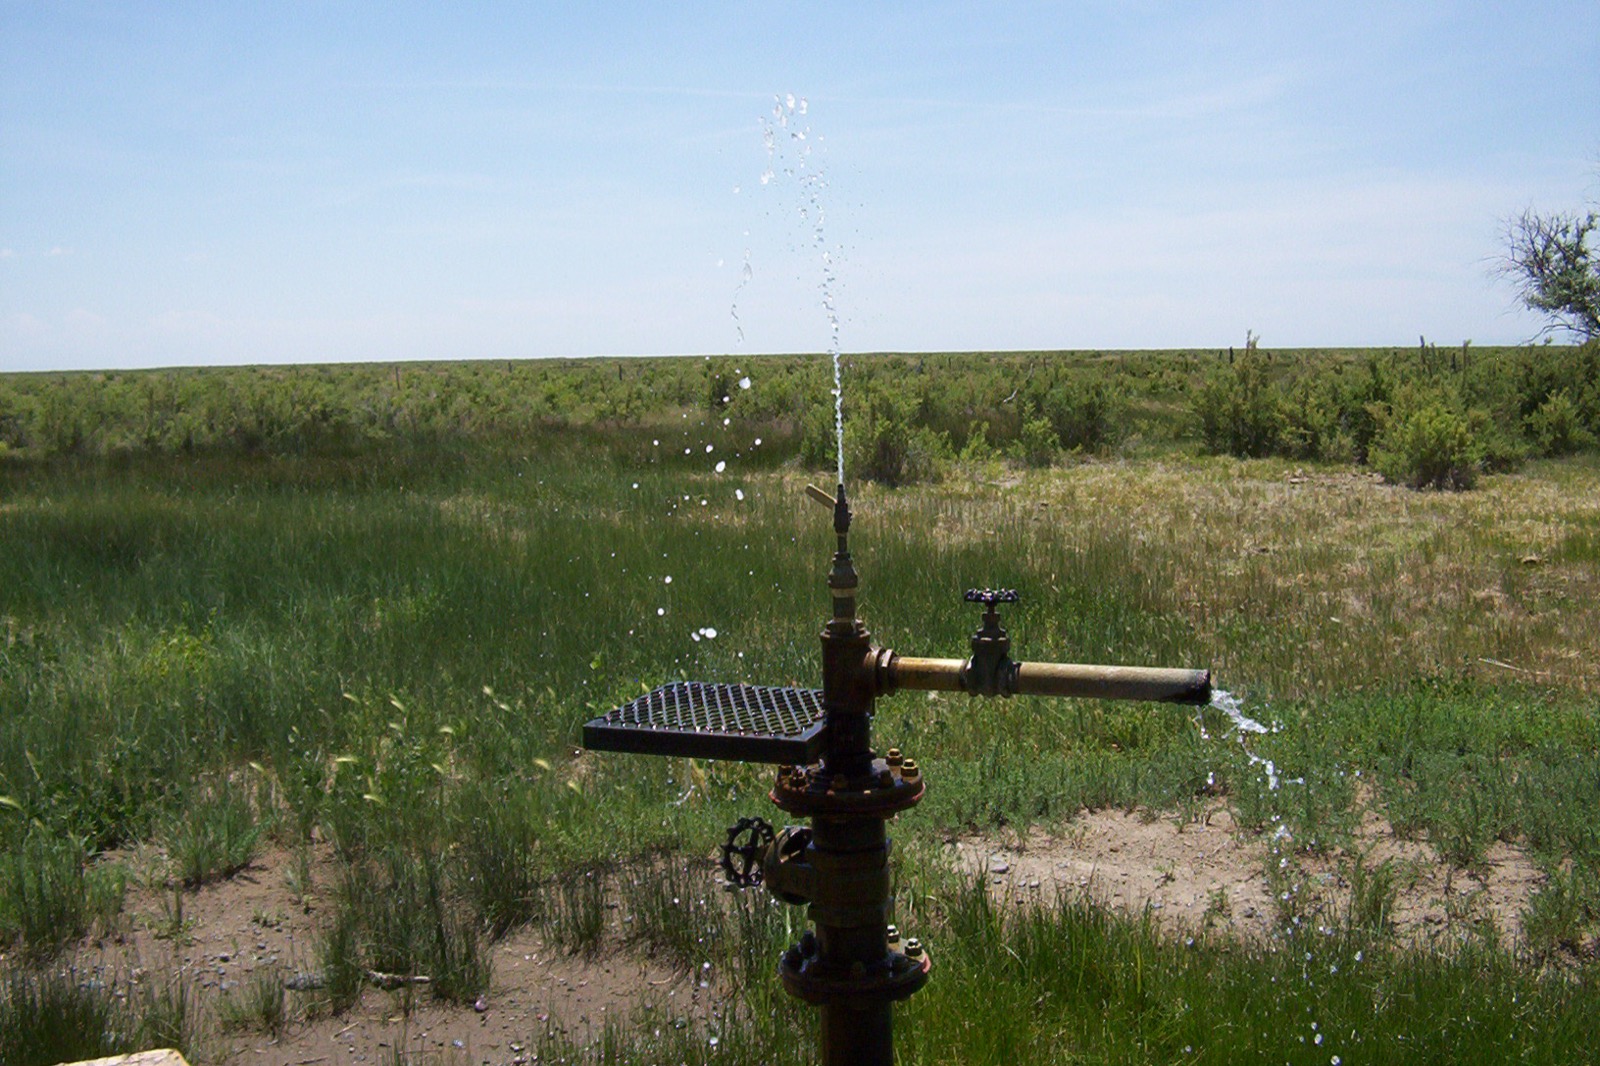
Tennessee well water mostly comes from the Valley and Ridge aquifers
USGS attributes each county's groundwater to the principal aquifer or aquifers it draws from. A principal aquifer is USGS's own category, defined this way:
USGS, Principal Aquifers of the United States“A principal aquifer is defined as a regionally extensive aquifer or aquifer system that has the potential to be used as a source of potable (drinkable) water. For study or mapping purposes, aquifers are often combined into aquifer systems.”
Across Tennessee's 95 counties USGS attributed self-supplied residents to the aquifers below. Many counties carry more than one, which is why the ZIP report shows every aquifer for a county rather than picking a headline.
Valley and Ridge aquifers
self-supplied residents USGS attributed to it in Tennessee, across 32 counties. Nationally it supplies about 1.9 million people in 9 states.
USGS 2015Mississippi embayment aquifer system
self-supplied residents USGS attributed to it in Tennessee, across 16 counties. Nationally it supplies about 384,000 people in 6 states.
USGS 2015Mississippian aquifers
self-supplied residents USGS attributed to it in Tennessee, across 37 counties. Nationally it supplies about 840,000 people in 12 states.
USGS 2015Ordovician aquifers
self-supplied residents USGS attributed to it in Tennessee, across 20 counties. Nationally it supplies about 82,000 people in 2 states.
USGS 2015These counts are of people, not of wells, and they come from an estimate rather than a census. USGS built them county by county from population and water use records; there is no national well registry to count against, which is itself the point. Read a large figure as a large number of households in the county drawing from that aquifer, and nothing more precise than that.
Our summary of information published by USGS estimated groundwater withdrawals from principal aquifers, county level data for 2015
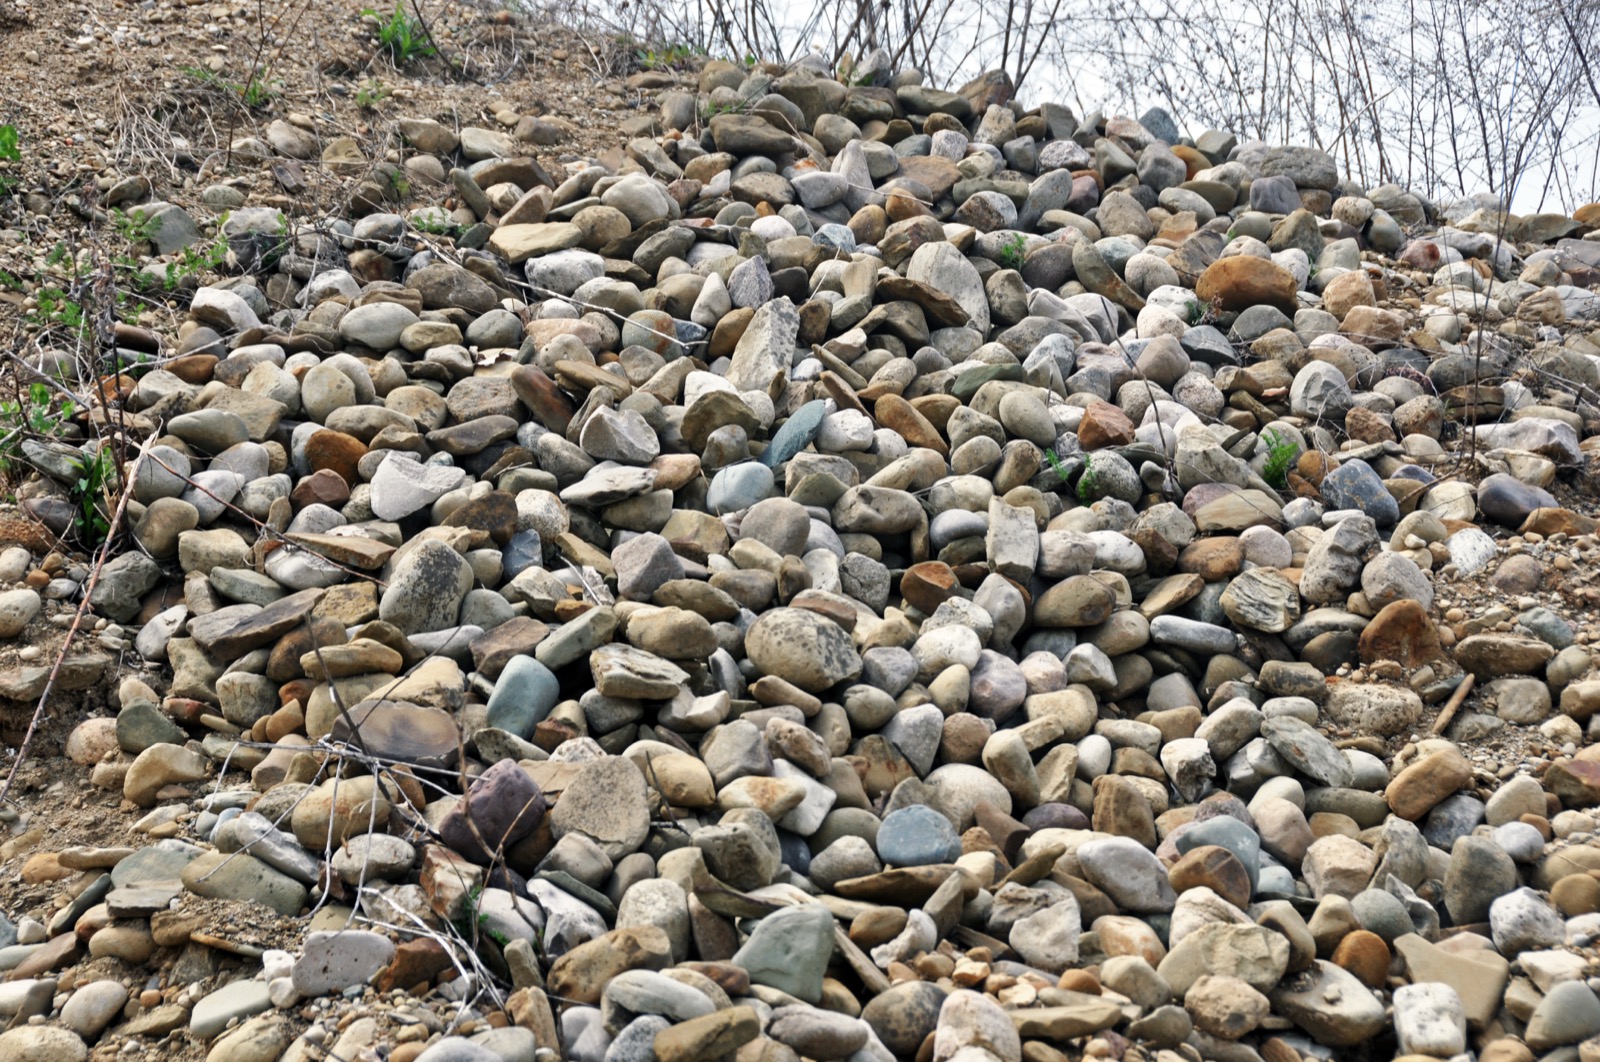
Tennessee well water by county
The table below is USGS's 2015 record for every county in Tennessee, sorted by the number of people on self-supplied water. The largest is Rutherford County at about 42,000 people. It is an inventory of use, not a ranking of anything: a county with more well users is a county where more households are on their own, which says nothing about the water in any of them.
Loading the county table from the committed USGS snapshot.
Testing a well in Tennessee
Here is EPA's baseline, in EPA's own words:
US EPA, Protect Your Home’s Water“Test your private well annually for total coliform bacteria, nitrates, total dissolved solids, and pH levels. If you suspect the presence of other contaminants, you should test for those also. You can also contact your local health department to find out what substances may be common in your area’s groundwater.”
US EPA, Protect Your Home’s Water“You may want to test more frequently if small children or elderly adults live in your house or if someone in your house is pregnant or nursing. These segments of the population are often more vulnerable to pollutants than others.”
Beyond that baseline the list is local, and Tennessee Department of Environment and Conservation, well water is where Tennessee publishes it. Your county health department usually knows the local answer better still, and in many states will run or subsidise the test. CDC Private Wells and EPA Protect Your Home’s Water cover the general case. Laboratory, test kit and treatment choices follow from a test result and a licensed installer, so the state program and your county health department are the next step.
What state programs typically do regulate is construction, not water: who may drill, how a well must be cased and sealed, and what record gets filed afterwards. EPA's own summary of the national picture:
US EPA, Private Drinking Water Well Programs in Your State“While most states have zero or limited regulations for private drinking water wells, states do have programs to assist well-owners.”
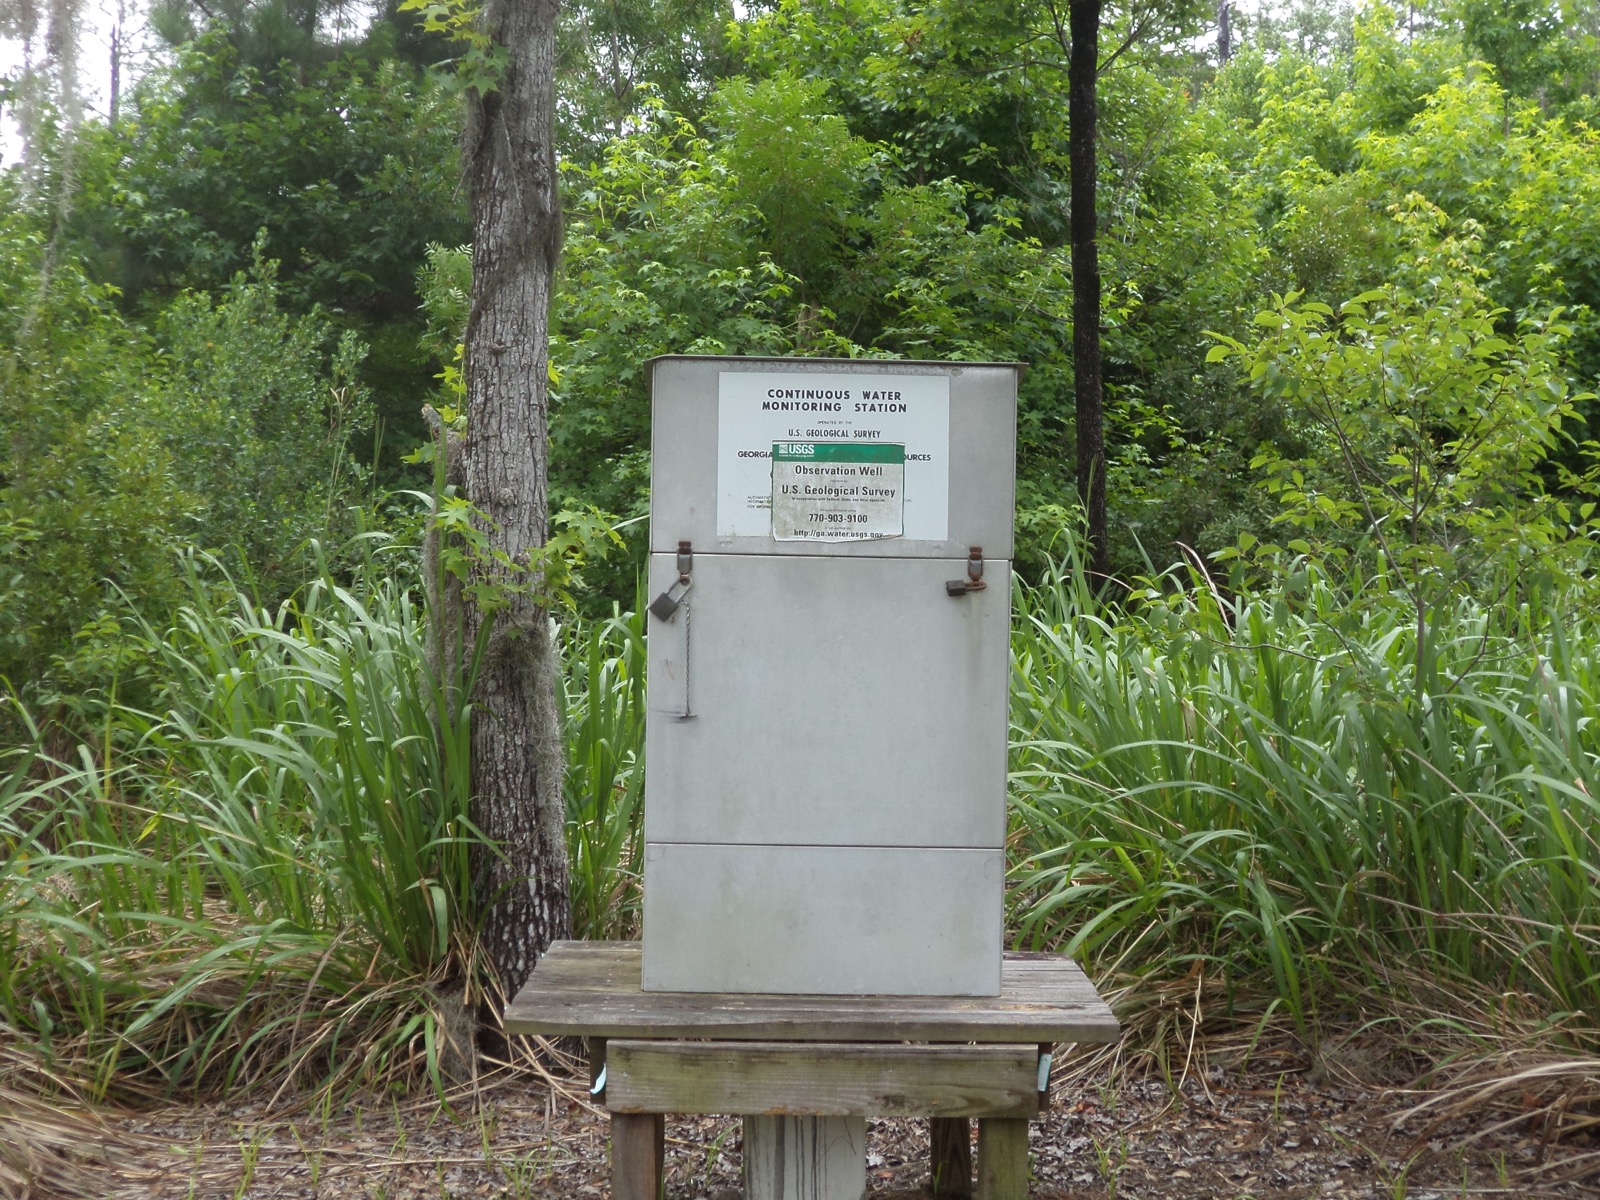
One last framing, from USGS, about why the absence of a test is not the same as the absence of a problem:
USGS, Domestic (Private) Supply Wells“Typically, the water supplied by domestic wells is not routinely tested. As a result, people using domestic-supply wells could be drinking water with elevated concentrations of some contaminants.”
Tennessee well water FAQ
The rest of Tennessee's water picture
Well water in nearby states
Population, withdrawal and aquifer figures are USGS's, from its estimated use of water in the United States county level data for 2015 (published June 2018 (v2.0)) and its estimated groundwater withdrawals from principal aquifers county level data for 2015 (published February 2020 (v1.0)). ZIP to county resolution uses the Census Bureau's ZCTA relationship file. All are US Government works in the public domain. In EPA's words: "Private well owners are responsible for delivering safe drinking water to their households." National picture: private wells in every state