
Skip to content

Spring Bloom in Vermont: Peak Timing for 2027

Apple blossom normally peaks around May 15. Below: how far ahead or behind this spring is actually running, and what that does to the date.

Apple blossom normally peaks around May 15 in Vermont. No Spring Index anomaly is on file for Vermont for 2026.
Apple blossom peak
May 15
Spring Index now
…
Sourced blooms
4

How spring is running in Vermont right now

Live · USA-NPN, updated daily
…
First Bloom Index
final for 2026
May 15
typical apple blossom peak
per University of Vermont Extension, UVM Fruit Blog
not shifted
shifted for this year
live grid holds the spring just gone
0 of 3
reference points reporting
Shelburne, Montpelier, Brattleboro

Vermont Agency of Agriculture makes the useful point that apple bloom timing is really a pollination story: apples flower at a time in the spring when there are diverse and abundant wild insect pollinators, so the date matters to the orchard for reasons that have nothing to do with the view.

Live, from the USA National Phenology Network

The three Spring Indices for Vermont

USA-NPN runs three models of spring onset and publishes a daily anomaly grid for each: how many days ahead of or behind the 1991 to 2020 normal this year’s index date fell, at 4 km resolution. All three are read at Shelburne, Montpelier, Brattleboro and averaged.

First Leaf Index
Reading the grid
Fetching the 2026 anomaly from USA-NPN.
First Bloom Index
Reading the grid
Fetching the 2026 anomaly from USA-NPN.
Late Bloom Index
Reading the grid
Fetching the 2026 anomaly from USA-NPN.

This is a measurement, not a forecast. None of these grids carries a date later than today. They say how spring has run so far this year, which is a leading indicator for the blooms still ahead of you and nothing stronger. Right now it is the second half of the calendar year, so the live grid holds the spring that finished months ago. It is shown as history, and 2027’s dates are not moved by it. The 2027 readings start filling in from late January.

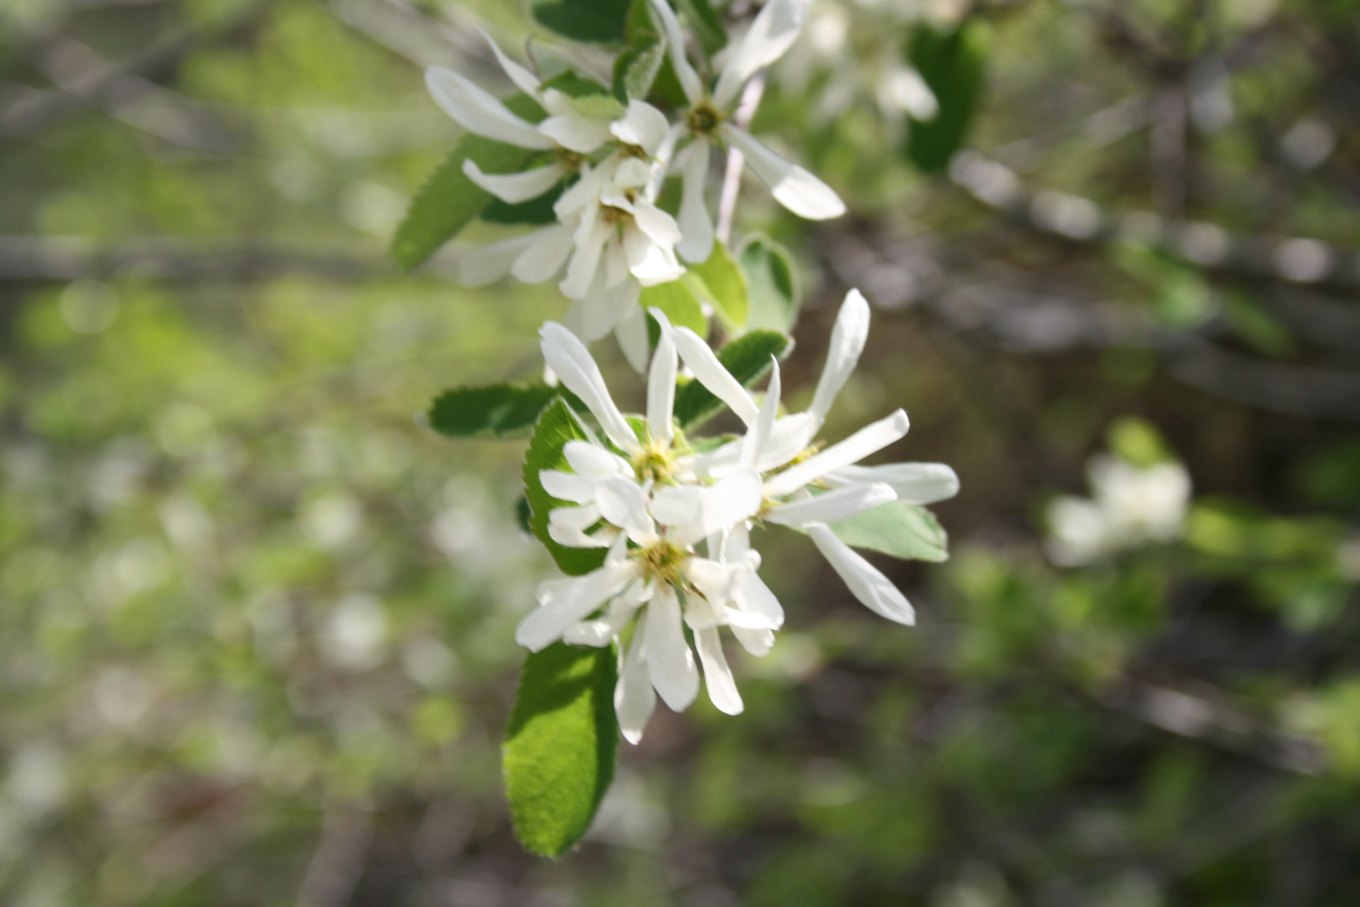
White serviceberry flowers with long narrow petals opening on a thin branch against a blurred brown background
Serviceberry, the plant that opens first in a lot of eastern woods and is the reason the shad run and the bloom share a name. Early species like this one track the First Leaf Index closely; a June mountain flower does not. “Amelanchier-ovalis-flower” by Sten Porse, CC BY-SA 3.0
Advertisement
What Vermont is known for

Signature blooms, with their sources

Each card shows the typical window from the institution that published it, and next to it the same window shifted by whichever Spring Index normally fires closest to that species’ own peak. The quote under each one is the sentence the window came from.

Apple blossom

Malus domesticaorchard
Typical peak
May 15
May 5 to May 28
Shifted estimate
Not shifted out of season
The live grid currently holds the spring just finished, so next spring's dates are not moved by it.

The Champlain Valley orchards around Shoreham and Addison County, Grand Isle, and southern Vermont.

That is a dated field observation from May 15, not a published normal. It supports "around mid May in the Champlain Valley" and nothing stronger. No UVM or state agriculture page publishes a Vermont bloom normal.

“By now most orchards in the Champlain Valley should be at full pink, and a few blossoms were observed open today at the UVM Hort Research and Education Center in South Burlington.”

Source: University of Vermont Extension, UVM Fruit Blog · the source gives the window; the peak shown is its midpoint, not a published date.
Trilliums

Trillium grandiflorum, T. erectum, T. undulatumwild
No published window. No citable institution puts months on this one, so the card carries where and what, and the source, without a date.

Mount Philo State Park at Charlotte and Kingsland Bay State Park at Ferrisburgh for white trillium; Brighton State Park at Island Pond for painted trillium.

Locations are sourced; months are not. Vermont State Parks names where to go and never says when, so the where is here and the window is blank.

“Painted trillium was spotted this spring at Brighton State Park in Island Pond. White trillium is often seen at Mt. Philo in Charlotte and Kingsland Bay State Park in Ferrisburgh.”

Source: Vermont State Parks, Department of Forests, Parks and Recreation

Pink lady's slipper

Cypripedium acaulewild
Typical peak
June 1
May 1 to July 31
Shifted estimate
Not shifted out of season
The live grid currently holds the spring just finished, so next spring's dates are not moved by it.

Lowell Lake State Park at Londonderry and Seyon Lodge State Park in Groton State Forest.

“bloom between May and July”

Source: Vermont State Parks, Department of Forests, Parks and Recreation · the source gives the window; the peak shown is its midpoint, not a published date.

Starflower

Lysimachia borealiswild
Typical peak
May 25
May 1 to June 30
Shifted estimate
Not shifted out of season
The live grid currently holds the spring just finished, so next spring's dates are not moved by it.

Woods statewide, and Wilgus State Park at Weathersfield in particular.

“blooms in woods all across the eastern United States and Canada in May and June”

Source: Vermont State Parks, Department of Forests, Parks and Recreation · the source gives the window; the peak shown is its midpoint, not a published date.

One species above carries no date: no institution publishes months for it, and only sourced dates are printed here.

The method

Two halves: a sourced window and a live index

The Spring Index is a genuinely good national product that almost nobody outside research uses, and it has one enormous limitation: it is species-agnostic. USA-NPN built it from historical observations of first leaf and first bloom in a cloned lilac cultivar and two cloned honeysuckle cultivars, chosen because they are among the first woody plants to leaf out and bloom and are common across much of the country. It can tell you spring is running six days early in your county. It has never heard of apple blossom.

So the two are paired. The typical window for each species on this page was researched by hand from a state agency, an extension service, a park service unit or a botanical garden, and the sentence it came from is printed under the card. That half is stable and specific but says the same thing every year. The anomaly half is live and current but knows nothing about the plant. Neither works alone. Together they answer the question people actually ask.

The matching rule is simple: each species is shifted by whichever of the three indices normally fires closest to that species’ own typical peak at Shelburne. A February desert bloom gets the First Leaf anomaly. A June mountain laurel gets the Late Bloom anomaly. Using one number for both would be the mistake.

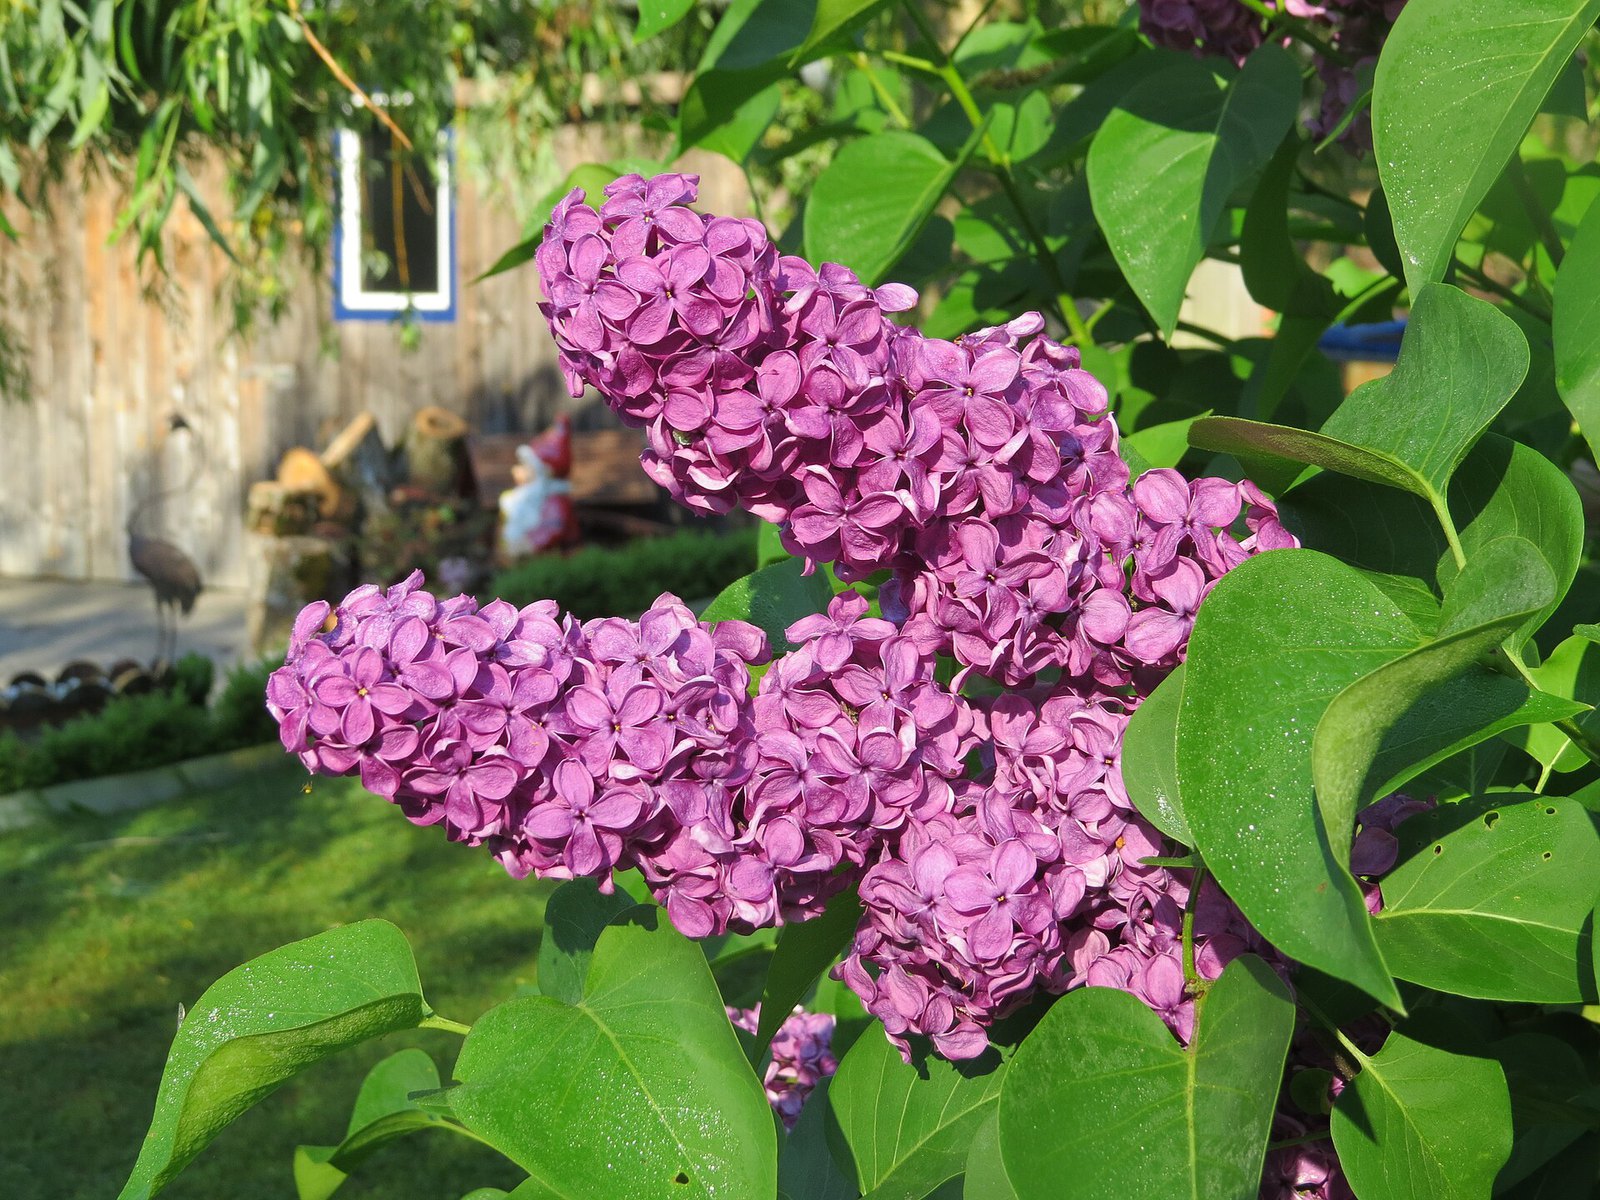
Dense panicles of white lilac flowers in full bloom on a sunlit shrub
Lilac, which is not incidental here. The Spring Index models were built from decades of observations of a cloned lilac cultivar and two cloned honeysuckles, planted at sites across the country so the same genetics were being watched everywhere. That is why the index is a clean measure of weather rather than of local plant variation, and also why it cannot speak for any other species without an assumption. “2018-05-13 (139) Syringa vulgaris (common lilac) at Bichlhäusl in Frankenfels, Austria” by GT1976, CC BY-SA 4.0

The Vermont bloom season at a glance

Climatological typicals
From the earliest sourced bloom in Vermont to the latest. Any single season commonly lands a week to a fortnight either side, which is what the Spring Index anomaly above is measuring.
Getting the timing right

What actually moves a bloom date

Accumulated warmth, not one warm day

The Spring Index models take temperature from January 1 onwards and fire when a threshold of accumulated warmth and warm-day events is met. One February afternoon does nothing. A mild fortnight moves everything.

Elevation and aspect

A 4 km grid cell averages over ground that a plant does not. South-facing slopes run ahead of the cell; shaded coves and high ground run behind it, often by more than the anomaly itself.

Winter rain, for the annuals

Temperature sets when. Autumn and winter rainfall often sets how much. That split matters most for desert annuals and prairie wildflowers, where an early spring and a thin display are perfectly compatible.

The late freeze

An early spring is not automatically a good one. Bloom that arrives ahead of the last freeze date is exposed, and a hard frost on open flowers ends that species’ season rather than delaying it.

Fixed festival dates

Bloom festivals are scheduled months ahead. In a fast spring the flowers can be finished by the weekend named after them, and in a slow one the buds are still shut. Check the anomaly before booking.

Local reports beat models

For the final week of planning, a park’s own bloom report or a recent photo beats any grid. Use this page to pick the fortnight; use somebody on the ground to pick the day.

Common questions

Vermont spring bloom FAQ

Pink peach blossoms in close-up with a honey bee crawling into one pale flower
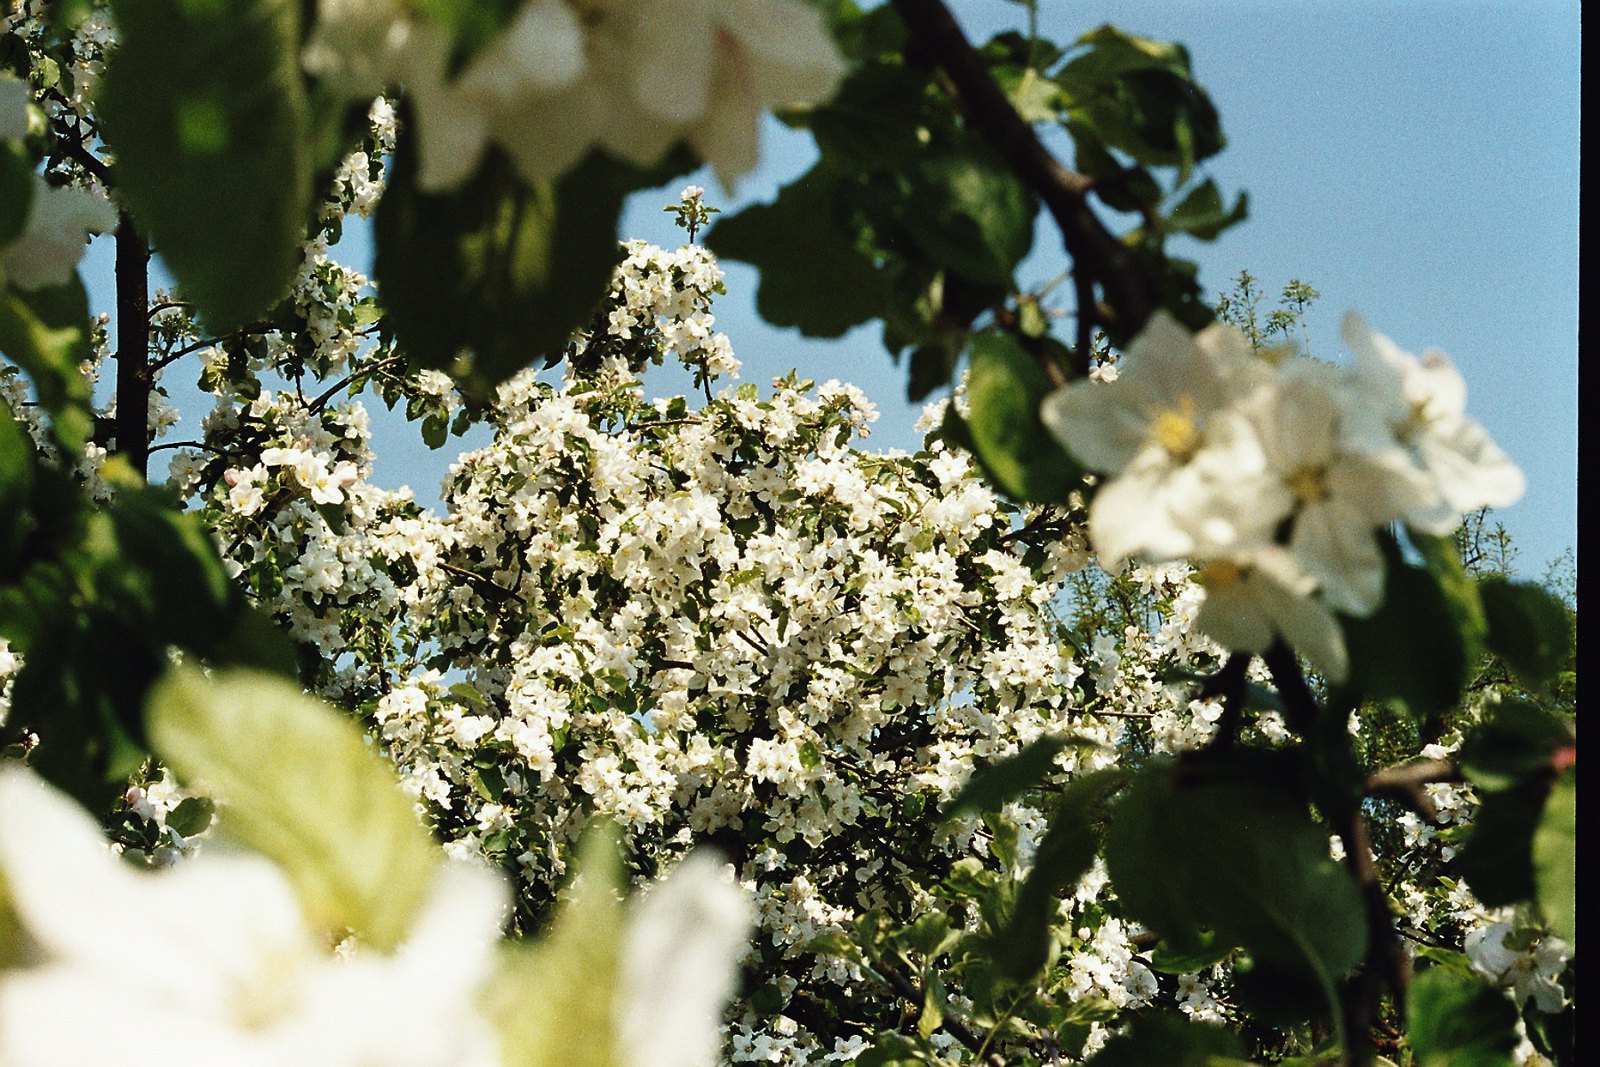
Orchard bloom is the one place where an early spring has a cost attached. Fruit growers watch these dates against the last freeze rather than for the view, because open blossom is the most frost-vulnerable stage of the year. “Apple Blossom1” by Wolfgang Bergmann sen., CC BY-SA 3.0
The rest of the Vermont calendar

Plan the rest of your Vermont year

More Northeast spring bloom pages

Dense panicles of white lilac flowers in full bloom on a sunlit shrub
Northeast spring. The bloom front moves north and uphill at roughly the pace the Spring Index tracks, which is why a single national date has never meant anything. “2018-05-13 (139) Syringa vulgaris (common lilac) at Bichlhäusl in Frankenfels, Austria” by GT1976, CC BY-SA 4.0
Advertisement

Bloom windows are climatological typicals, each one attributed on its card to the institution that published it, with the supporting sentence quoted. Where no institution publishes a window, the card carries the source and no date. Spring Index anomalies are read live in your browser from the USA National Phenology Network’s Extended Spring Indices (First Leaf, First Bloom and Late Bloom), 4 km gridded products regenerated daily from PRISM temperature data and compared against the 1991 to 2020 normal; source: USA National Phenology Network, www.usanpn.org, used under CC BY 4.0. Those grids measure the spring that has already run and are not a forecast. The rule that matches each species to one of the three indices is ours. Heading days to peak: 147 (past). National picture: where spring stands across the country →
Hero image: “2018-05-13 (139) Syringa vulgaris (common lilac) at Bichlhäusl in Frankenfels, Austria” by GT1976, CC BY-SA 4.0