Akaka Falls
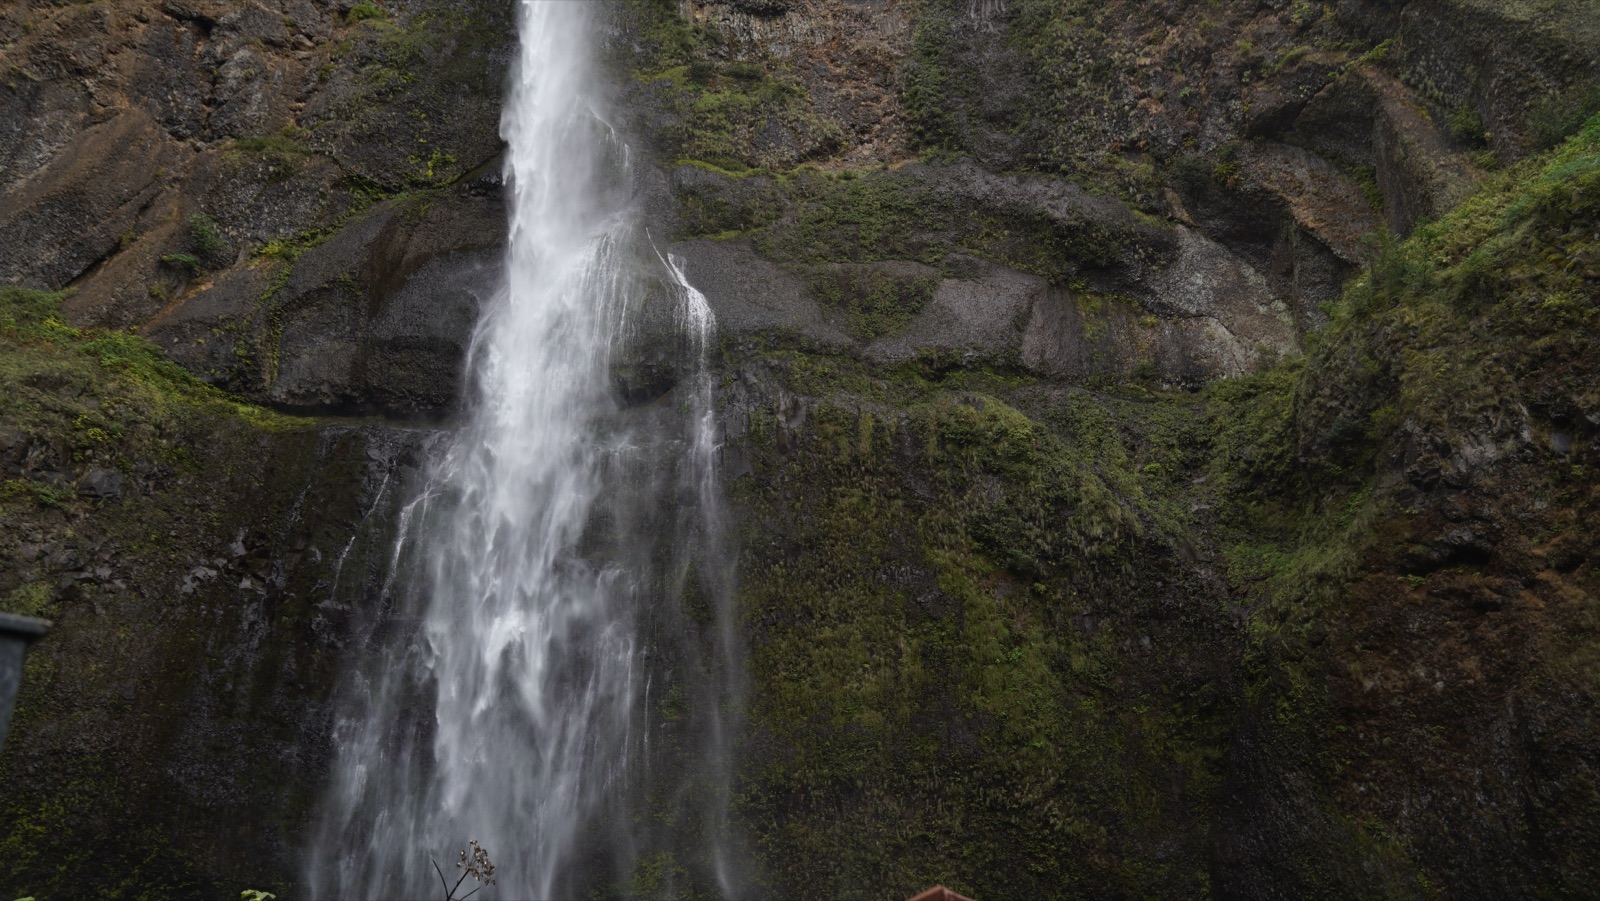
Rain fedHawaii's postcard plunge: 442 feet of free fall into a stream-eroded gorge on the Hamakua Coast, framed by a paved loop through tropical forest.
Big water: November through April
No gauge, climatology onlyFull season page →

5 documented waterfalls in Hawaii, when each one actually runs, and what the river is doing right now where a gauge exists.
Trail status, closures and safety rules belong to each falls' managing agency, named and linked on every page.
Each card carries the typical big-water window drawn from the falls' actual driver, and the latest USGS reading on its feeding river where a gauge exists. The full page for each falls explains the season, shows today against the USGS percentile band, and quotes the managing agency on access.
Hawaii's postcard plunge: 442 feet of free fall into a stream-eroded gorge on the Hamakua Coast, framed by a paved loop through tropical forest.
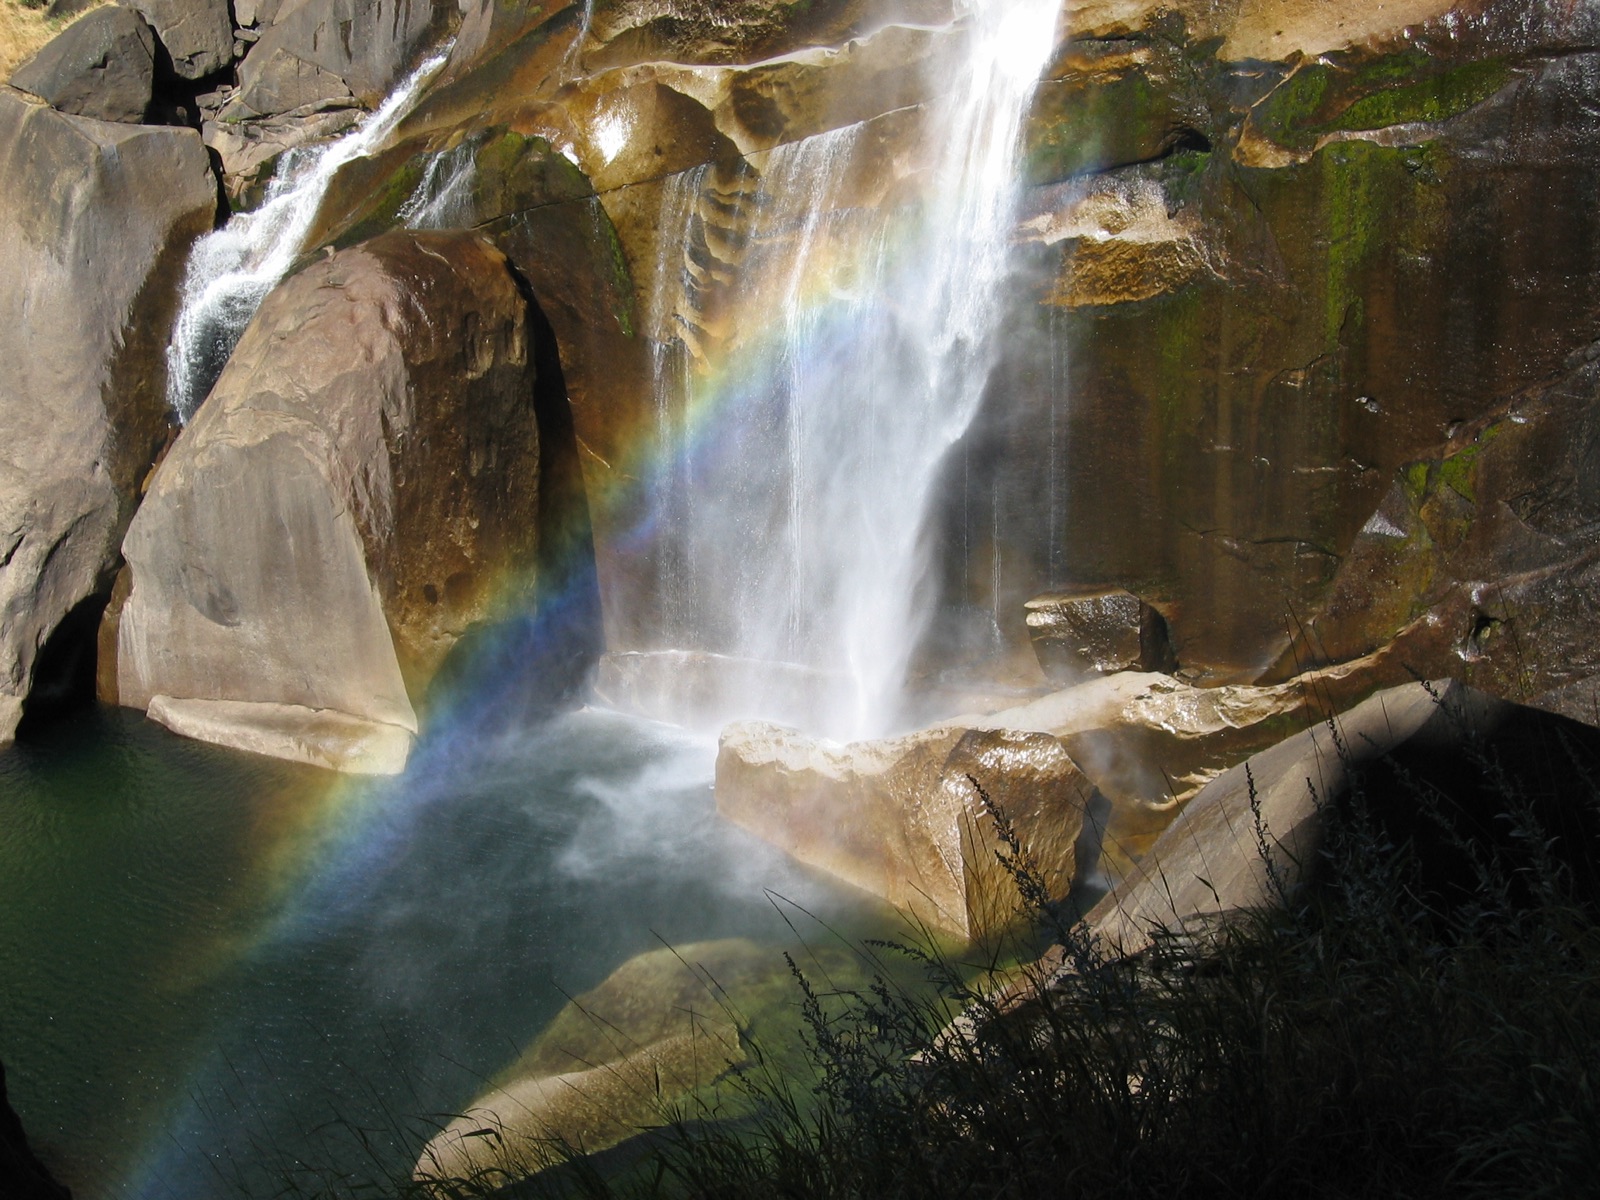
Hilo's drive-up falls on the Wailuku River, 80 feet over a lava cave said to be the home of Hina, and named for the rainbows in its morning mist.
The 400 foot wall of water at the end of Haleakala's Pipiwai Trail, past the bamboo forest in the Kipahulu District beyond Hana.
Kauai's easiest great falls: a roadside overlook above the Wailua River valley, with the falls splitting and rejoining across its basalt lip as the rain dictates.
The double falls at the end of Maalo Road made famous by television, pouring off the South Fork Wailua and swelling into a single curtain after Kauai rain.
Live readings: USGS Water Services (National Water Information System). Instantaneous values and daily statistics services. U.S. Geological Survey data are works of the United States Government and are in the public domain.
Most of Hawaii's documented falls run on rain, so they answer to the last few storms rather than to any fixed date. The mix here is all 5, and 4 of them have an active USGS gauge on or near the stream.
Windows are typical-year climatology from each falls' driver, not forecasts. Live readings and percentile bands are USGS data, public domain; where a page says a river is above or below typical, that comparison is ours and is labelled. Access and safety belong to each falls' managing agency, named on its page. National picture →